
Abstract
Purpose
Autophagy, the process responsible for degrading cytoplasmic organelles to sustain cellular metabolism, has been associated with cancer initiation and progression. As TP53-induced glycolysis and apoptosis regulator (TIGAR) is among the important genes that can regulate autophagy, we aimed to investigate the correlation between the expression levels of TIGAR and the autophagy-related protein microtubule-associated protein 1 light chain 3 (LC3B), as well as their association with clinical outcomes, in nasopharyngeal carcinoma (NPC) patients.
Methods
We detected the expressions of TIGAR and LC3B in 182 NPC tissue samples via immunohistochemical staining.
Results
A significant correlation between TIGAR and LC3B expressions was identified (P=0.045). Moreover, survival analysis showed that TIGAR− or LC3B+ expression was associated with improved overall survival, local regional failure-free survival, distant failure-free survival, and failure-free survival rates, compared with TIGAR+ or LC3B− expression, respectively. Meanwhile, when combining TIGAR with LC3B expression in terms of prognostic value, patients with TIGAR+/LC3B− expression were significantly disadvantaged with regard to overall survival, local regional failure-free survival, distant failure-free survival, and failure-free survival compared with other groups based on the log-rank test and Cox regression analyses (all P<0.05).
Conclusion
TIGAR and LC3B may be novel biomarkers for predicting the prognosis of NPC patients and could be utilized as potential targets for future therapeutics aimed at treating NPC patients.
Introduction
Nasopharyngeal carcinoma (NPC), a head and neck malignancy, is prevalent in East and South Asia, where it has a high incidence rate of up to 71%.Citation1 Although the availability of intensity-modulated radiation therapy (IMRT) and adjuvant chemotherapy has partially improved the survival rate of patients, there remains a significant fraction of patients who experience clinical therapy failure, due to local recurrence and distant metastasis.Citation2 Although traditional TNM staging can be used to predict cancer prognosis, it is not very effective. In recent years, studies have focused on biomarkers with potential use in targeted treatment and predicting prognosis. Although several molecular markers have been identified to predict a favorable prognosis in NPC,Citation3–Citation6 it will be of great value for NPC patients if more potent biomarkers can be identified that not only aid in the prediction of prognosis, but also provide promising therapeutic targets for therapy.
Autophagy is a programmed prosurvival mechanism in eukaryotic cells that serves to degrade cytoplasmic organelles in order to sustain cellular metabolism.Citation7 Recent evidence has suggested that dysfunction in autophagy is associated with a wide range of diseases.Citation8 Autophagy has dual functions in tumorigenesis: it plays a tumor-suppressive role when autophagic cell death is induced via several mechanisms,Citation9,Citation10 and a tumor-promoting role by sustaining cancer cell survival in an energy-deficient environment.Citation11,Citation12 Clinical studies in various types of cancer demonstrated that either low or high expression of autophagy-related proteins was associated with an adverse prognosis.Citation13–Citation15 Hence, the relationship between autophagy and clinical prognosis remains controversial.
TP53-inducible glycolysis and apoptosis regulator (TIGAR), as a target of P53, plays an essential role in apoptosis and autophagy.Citation16,Citation17 It has been reported that TIGAR regulates autophagy by regulating the upstream genes of reactive oxygen species (ROS) responses through inhibiting glycolysis, and that this process may be interrupted by ectopic supplementation of nicotinamide adenine dinucleotide phosphate.Citation16 TIGAR can also regulate intracellular ROS levels by regulating glucose metabolism, and promote cell survival and DNA damage repair in response to DNA damage.Citation18–Citation20 Previous studies have demonstrated that TIGAR is also associated with the regulation of cell cycle and metastasis-related proteins and may play an important role in the proliferation, invasion, and metastasis of tumor cells.Citation21 Moreover, various investigations have reported that TIGAR expression is significantly elevated in human tumors, such as colon cancer, breast cancer, and glioblastoma.Citation22–Citation24 Therefore, TIGAR is likely to play a significant role in oncogenesis and may be a potential therapeutic target for cancer treatment. To the best of our knowledge, the mechanism of action of TIGAR in NPC occurrence and development has not yet been clarified, and how TIGAR expression level may affect the prognosis of NPC patients also remains unclear.
Microtubule-associated protein 1 light chain 3 (LC3B) is a well-established marker of autophagic activity in cancer cells. The determination of LC3B expression is frequently performed by immunohistochemistry. Therefore, in the present study, we detected the expression levels of TIGAR and LC3B in NPC tissue samples via immunohistochemistry, and investigated the association of TIGAR and/or LC3B protein expression with clinicopathological features and prognosis using log-rank and Cox regression analyses, with the aim of identifying the relationship between TIGAR and LC3B expression levels and the clinical outcomes of NPC patients.
Materials and methods
Immunohistochemical staining
Immunohistochemical staining was performed with rabbit anti-TIGAR (dilution, 1:400; Abcam, Cambridge, UK, ab37910) and mouse anti-LC3B (dilution 1:200; Cell Signaling Technology, Inc., Danvers, MA, USA, #3868) antibodies. In the negative control group, the primary antibody was replaced by PBS. Each sample was graded according to the intensity and extent of staining. The intensity of staining was scored as 0 (no staining), 1 (weak staining), 2 (warm staining), or 3 (strong staining). The percentage of positively stained tumor cells was scored as 0 (0%), 1 (1%–25%), 2 (26%–50%), 3 (51%–75%), or 4 (76%–100%). The intensity score × the percentage score was used to obtain the final overall score, and the specimens were classified into two groups according to overall score. Samples were considered LC3B− with a score of 0–5 or LC3B+ with a score of 6–12; samples were considered TIGAR− with a score of 0–5, or TIGAR+ with a score of 6–12. All slides were assessed independently by two pathologists blinded to patient identity and clinical outcome.
Clinical data and treatment
Patient data for this study were gathered between January 2012 and December 2015. This study obtained the ethical approval of Southwest Medical University (reference number: k2017041) and written informed consent was obtained from all patients. All patients were restaged according to the seventh edition of the Union for International Cancer Control/American Joint Committee on Cancer (UICC/AJCC) system.Citation25 Patients with the following criteria were included: NPC confirmed by pathological diagnosis; no prior history of radiotherapy, chemotherapy, or oncological surgery; Karnofsky score 70; received IMRT at the Affiliated Hospital of Southwest Medical University; and regular follow-up data were available. Patients with the following criteria were excluded: uncontrolled infection; previous receipt of any anticancer therapy; pregnancy or lactation; prior malignancy; or unsuitable for chemotherapy due to a deficiency of the liver, kidney, lung, or heart.
Baseline examinations included thoracic and abdominal computed tomography scans, nasopharyngeal and neck magnetic resonance imaging, nasopharyngeal fiberscope analysis, and bone scanning. All patients were treated with definitive IMRT. The treatment regimens included platinum-based induction chemotherapy and concurrent chemoradiotherapy. The induction chemotherapy consisted of paclitaxel 175 mg/m2 (day 1) and cisplatin 75 mg/m2 (day 1), or fluorouracil 1,000 mg/m2/day through continuous IV infusion for 96 hours and cisplatin 75 mg/m2 (day 1). Two cycles were administered at 3-week intervals, followed by IMRT performed concurrently with 40 mg/m2/week cisplatin.
Target volumes for the nasopharyngeal and nodal regions were defined according to the recommendations of the International Commission on Radiation Units and Measurements 50,Citation26 62,Citation27 71,Citation28 and 83Citation29 guidelines. The doses prescribed on planning gross tumor volume of nasopharynx, planning gross tumor volume of neck metastasis lymph node, planning clinical target volume of high-risk area, and planning clinical target volume of low-risk area were 70, 70, 64, and 54 Gy (in 33 fractions), respectively. The plan was delivered once daily, with a total of five fractions per week.
Follow-up and statistical analyses
The duration of follow-up was calculated from the date of diagnosis to the date of death or the date of last follow-up examination for the surviving patients. Generally, after the completion of therapy, patients were followed up every 3 months during the first 2 years, and every 6 months during the next 3 years. The median follow-up time for the entire group was 35 months (range, 17–64 months). Overall survival (OS), failure-free survival (FFS), local regional failure-free survival (LR-FFS), and distant failure-free survival (D-FFS) were calculated from the initial diagnosis to death, disease failure, local regional failure, and distant failure, respectively. For patients who survived until the last follow-up, the duration of survival was censored.
Statistics
The association between TIGAR and LC3B expression levels and clinicopathological variables was evaluated using the chi-squared test. The correlation between TIGAR and LC3B expression levels was evaluated using Spearman’s correlation analysis. Cumulative recurrence, cumulative metastasis, and survival probability were estimated using Kaplan–Meier analysis, and the statistical significance of differences was assessed by the log-rank test. Prognostic factors for survival were identified using univariate and multivariate Cox regression analyses. In all cases, a two-tailed P-value of <0.05 was considered statistically significant. Statistical analyses were performed using SPSS 17 software.Citation30
Results
Patient characteristics
A total of 182 NPC cases were assessed in our research. The median age of the patients was 48 years (range, 20–73 years). The patients comprised 128 males and 54 females. A total of 48 patients (26.4%) were initially diagnosed at an early stage (Stage I–II) and 134 (73.6%) at an advanced stage (Stage III–IV). The UICC/AJCC T stage was T1–2 for 97 cases (53.3%) and T3–4 for 85 cases (46.7%). Lymph node metastases were absent in 33 cases (18.1%) and present in 149 cases (81.9%). The WHO pathology classification was grade I for 4 cases (2.2%), grade II for 65 cases (35.7%), and grade III for 113 cases (62.1%). The baseline clinical information of the patients is presented in .
Table 1 Relationship between TIGAR and LC3B expressions and clinicopathologic variables in NPC
Association of TIGAR and LC3B expressions with clinicopathological characteristics
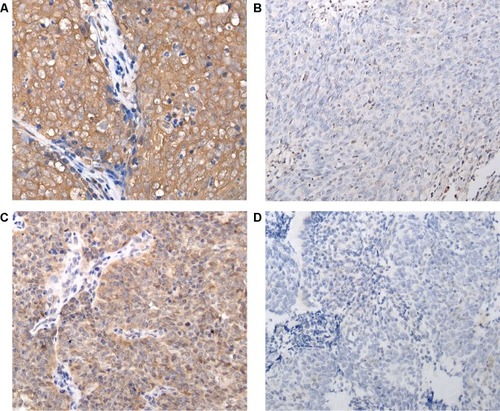
Cytoplasmic staining was observed for both LC3B and TIGAR. The tumors from 117 patients were TIGAR+ (64.3%), whereas 65 (35.7%) were TIGAR−. There were 56 LC3B+ (30.8%) and 126 LC3B− (69.2%) tumors (). In order to investigate whether the expressions of TIGAR and LC3B in NPC were significantly associated with clinical characteristics, chi-squared tests were used to analyze the relationship between clinicopathological parameters and the expressions of TIGAR and LC3B. However, no statistically significant associations were observed with clinicopathological parameters, including sex, age, pathology classification, lymph node metastasis, and TNM stage, for either TIGAR or LC3B expression (all P>0.05) ( and ).
Figure 1 Immunostaining of TIGAR and LC3B protein expressions in nasopharyngeal carcinoma.
Notes: (A) TIGAR+ (×200); (B) TIGAR− (×200); (C) LC3B+ (×200); (D) LC3B− (×200).
Abbreviations: LC3B, microtubule-associated protein 1 light chain 3; TIGAR, TP53-induced glycolysis and apoptosis regulator.
Correlation between TIGAR and LC3B expressions in NPC patients
We analyzed the correlation between the expression levels of TIGAR and LC3B. The expression of TIGAR was significantly negatively associated with the expression of LC3B (Spearman’s correlation analysis, R=−0.149, P=0.045, ).Citation31 Thirty NPC patients presented with TIGAR+/LC3B+ tumors, 26 with TIGAR−/LC3B+, 87 with TIGAR+/LC3B−, and 39 with TIGAR−/LC3B− ().
Table 2 The correlation between TIGAR and LC3B expressions
Association of TIGAR and LC3B expressions with clinical outcomes
We made a comparison of survival outcomes, including of OS, FFS, LR-FFS, and D-FFS rates, depending on the TIGAR and LC3B expressions status of tumors in NPC patients. As shown in –, NPC patients with TIGAR+ tumors had a relatively poor OS (P=0.002), FFS (P=0.003), LR-FFS (P=0.025), and D-FFS (P=0.034) rates compared with those with TIGAR− tumors, as determined by Kaplan–Meier survival analyses and log-rank tests. By contrast, patients with LC3B− tumors had a relatively poor FFS (P=0.015) and LR-FFS (P=0.027) rates compared with those with LC3B+. Although the differences in D-FFS (P=0.118) and OS (P=0.059) were not statistically significant, the trend was toward an association with poorer OS and D-FFS ().
Table 3 The correlation between TIGAR and LC3B expressions in outcomes
Figure 2 Correlation of TIGAR and LC3B expressions with LR-FFS time.
Notes: (A) Correlation between TIGAR expression and LR-FFS; (B) correlation between LC3B expression and LR-FFS; (C) correlation between TIGAR and LC3B expressions and LR-FFS.
Abbreviations: LC3B, microtubule-associated protein 1 light chain 3; LR-FFS, local regional failure-free survival; TIGAR, TP53-induced glycolysis and apoptosis regulator.
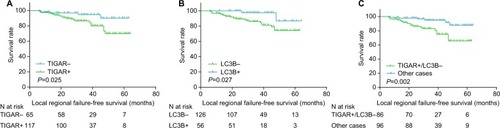
Figure 3 Correlation of TIGAR and LC3B expressions with D-FFS time.
Notes: (A) Correlation between TIGAR expression and D-FFS; (B) correlation between LC3B expression and D-FFS; (C) correlation between TIGAR and LC3B expressions and D-FFS.
Abbreviations: D-FFS, distant failure-free survival; LC3B, microtubule-associated protein 1 light chain 3; TIGAR, TP53-induced glycolysis and apoptosis regulator.
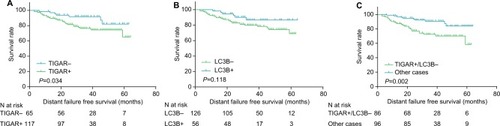
Figure 4 Correlation of TIGAR and LC3B expressions with FFS time.
Notes: (A) Correlation between TIGAR expression and FFS; (B) correlation between LC3B expression and FFS; (C) correlation between TIGAR and LC3B expressions and FFS.
Abbreviations: FFS, failure-free survival; LC3B, microtubule-associated protein 1 light chain 3; TIGAR, TP53-induced glycolysis and apoptosis regulator.
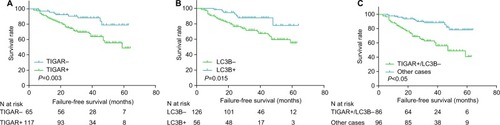
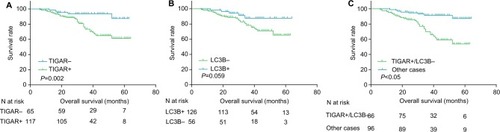
Figure 5 Correlation of TIGAR and LC3B expressions with OS time.
Notes: (A) Correlation between TIGAR expression and OS; (B) correlation between LC3B expression and OS; (C) correlation between TIGAR and LC3B expressions and OS.
Abbreviations: LC3B, microtubule-associated protein 1 light chain 3; OS, overall survival; TIGAR, TP53-induced glycolysis and apoptosis regulator.
– show the results of the univariate and multivariate Cox proportional hazards analyses for the association of clinicopathological variables with OS, LR-FFS, D-FFS, and FFS. TIGAR+ tumors were associated with poor outcomes, including decreased OS (P=0.005, ), LR-FFS (P=0.035, ), D-FFS (P=0.041, ), and FFS (P=0.004, ) rates. In multivariate analysis, TIGAR+ was associated with poorer OS (P=0.004, ), LR-FFS (P=0.041, ), and FFS (P=0.015, ), but not with D-FFS (P=0.079, ). Similarly, LC3B− was associated with a poorer LR-FFS (P=0.044, ) and FFS (P=0.02, ) in the univariate and multivariate analyses (P=0.05, ; P=0.03, , respectively), but not with OS (P=0.068 in univariate analysis, P=0.057 in multivariate analysis, ) or D-FFS (P=0.126 in univariate analysis, P=0.177 in multivariate analysis, ). HRs are shown in –.
Table 4 Univariate and multivariate Cox proportional hazard analyses of clinicopathologic variables for LR-FFS rate
Table 5 Univariate and multivariate Cox proportional hazard analyses of clinicopathologic variables for D-FFS rate
Table 6 Univariate and multivariate Cox proportional hazard analyses of clinicopathologic variables for FFS rate
Table 7 Univariate and multivariate Cox proportional hazard analyses of clinicopathologic variables for OS rate
We also analyzed the relationship between the combinations of TIGAR and LC3B expression patterns and patient prognoses. The patterns assessed were LC3B−/TIGAR+, LC3B+/TIGAR+, LC3B+/TIGAR−, and LC3B−/TIGAR−. The subgroup of LC3B−/TIGAR+ tumors (n=87) was associated with poor OS, FFS, LR-FFS, and D-FFS rates (all P<0.05 –; , , , and ). By contrast, the LC3B−/TIGAR− (n=39), LC3B+/TIGAR+ (n=30), and LC3B+/TIGAR− (n=26) patterns each had a similarly favorable prognostic impact (, , , and ). HRs are shown in –.
Table 8 Univariate and multivariate Cox proportional hazard analyses of clinicopathologic variables for LR-FFS rate
Table 9 Univariate and multivariate Cox proportional hazard analyses of clinicopathologic variables for D-FFS rate
Table 10 Univariate and multivariate Cox proportional hazard analyses of clinicopathologic variables for FFS rate
Table 11 Univariate and multivariate Cox proportional hazard analyses of clinicopathologic variables for OS rate
Discussion
In this study, we investigated the expression levels of TIGAR and LC3B in NPC specimens, and their relationship with OS, LR-FFS, D-FFS, and FFS. Our results showed that negative LC3B expression and positive TIGAR expression were associated with a relatively poor prognosis. We therefore propose that TIGAR and LC3B may be indicators of prognosis in NPC patients.
Previous studies have found that TIGAR is highly expressed in certain tumor cell lines, including U2OS, RKO, and H1299, and regulates their growth and proliferation.Citation32 Ye et al found that silencing TIGAR by RNA interference in Hep-G2 cells decreased TIGAR mRNA and protein levels and thereby inhibited cell proliferation, by inducing apoptosis and autophagy (P<0.001).Citation19 Cheung et al reported that TIGAR was dispensable in normal cell proliferation and development, but played a critical role in tumor generation; notably, they observed that deficient TIGAR expression reduced tumor burden and increased survival time in an intestinal adenoma mouse model.Citation22 This indicates that TIGAR contributes to tumor progression and may be a potential therapeutic target for cancer treatment. In addition, high TIGAR expression has been identified in colon tumors,Citation19 breast cancer,Citation24 and glioblastoma,Citation23 which suggests that upregulated TIGAR expression may contribute to cancer development.
Our previous study showed that TIGAR expression was elevated in NPC tissues, and silencing TIGAR by lentivirus-shRNA led to a decreased rate of tumor cell growth, proliferation, migration, and invasion, followed by an increase in the apoptosis rate of NPC cells.Citation33 This indicated that TIGAR plays an important role in the growth, proliferation, and metastasis of NPC. In the present study, the relationship between TIGAR expression and the OS, LR-FFS, D-FFS, and FFS rates of NPC patients was evaluated via univariate and multivariate Cox regression analyses. The results showed that the TIGAR+ group is associated with a poorer outcome than the TIGAR− group. These findings suggest that TIGAR overexpression may be related to the prognosis of NPC, which is consistent with the previous reports.Citation19,Citation22–Citation24
LC3B immunostaining has been reported to be generally higher in the majority of human cancer tissue types compared with their normal counterparts,Citation34,Citation35 including in head and neck cancer,Citation15 esophageal adenocarcinomas,Citation13,Citation36 and early stage non-small-cell lung cancer.Citation37 LC3B expression has also been demonstrated to be associated with cancer prognosis. In the present study, we used a univariate analysis to identify that the LC3B+ group had improved LR-FFS and FFS rates (P=0.027 and P=0.015, respectively, ) and tended toward improved D-FFS and OS, compared with the LC3B− group. Multivariate Cox proportional hazards analysis confirmed that LC3B expression was associated with LR-FFS and FFS. This was in accordance with the results of Schläfli et al.Citation37 However, LC3B expression was not significantly associated with D-FFS. This may be due to the small sample size employed in the study. As autophagy has been reported to be related to cancer development, a large number of studies have studied the correlation between autophagy-related proteins and cancer prognosis. The results of research by Shereen Elmashed et alCitation38 showed that a globular pattern of LC3B+expression predicted a better outcome in esophageal adenocarcinoma. Previous staining for LC3B has shown a cytoplasmic distribution,Citation34,Citation39 but here we failed to detect obvious distinctions among the LC3B staining patterns. The differences in antibody, cancer type, tumor stage, or tumor genetic context may account for such results.Citation11,Citation40
In our study, the expression levels of TIGAR and LC3B were significantly correlated (R=−0.149, P=0.045, ). Therefore, we further combined the expression patterns of TIGAR and LC3B to analyze the relationship between their combined expression status and NPC outcomes. Kaplan– Meier survival analysis demonstrated that patients with TIGAR+/LC3B− tumors had a relatively poor OS, FFS, D-FFS, and LR-FFS rates (all P<0.05, ). The univariate and multivariate analyses also demonstrated a statistically significant relationship between LC3B−/TIGAR+ and OS, FFS, D-FFS, and LR-FFS rates. Thus, TIGAR+ and LC3B− expressions were associated with a relatively poor prognosis.
TIGAR+ alone was associated with a poor outcome in terms of D-FFS according to Kaplan–Meir survival analysis, log-rank test, and univariate Cox proportional hazards analysis (P=0.034, ), but multivariate Cox proportional hazards analysis showed that TIGAR was not an independent prognostic factor (HR =0.471, P=0.079; ) for D-FFS. In contrast, Cox proportional hazards analysis showed the combination of TIGAR+/LC3B− expression to be an independent prognostic factor (HR =2.744, P=0.008; ) for D-FFS. A previous study showed that the relationship between autophagy-related proteins and cancer prognosis was significantly different between various tumor types and cohorts.Citation41 Moreover, autophagy is a dynamic process, which is positively or negatively regulated at several levels by autophagy-related proteins.Citation41 Therefore, combining two or more autophagy-related proteins may better predict the role of autophagy in tumor development. In summary, combining data regarding the expression of TIGAR and LC3B in tumor tissue may have a more significant prognostic value than the expression of either protein alone.
A recent study reported that TIGAR could affect cancer cell survival and exert a dual role in anticancer therapy through regulating apoptosis and autophagy. TIGAR silencing resulted in increased LC3B, and conversely, overexpression of TIGAR correlated with decreased levels of LC3B.Citation16 This suggested that TIGAR has a negative correlation with LC3B, and that the expression of TIGAR plays an anti-autophagy role in cancer cells, in accordance with the current study revealing a significant relationship between TIGAR and LC3B expression in NPC (P=0.045, R=−0.149, ). Xie et alCitation42 reported that TIGAR silencing increased the activation of autophagy and could inactivate the mTOR pathway induced by epirubicin. Furthermore, in vivo suppression of TIGAR expression reduced tumorigenicity. Ting Ma et alCitation43 revealed that TIGAR knockdown could increase physa pubenolide-induced apoptosis and autophagy-related cell death. These studies imply that the TIGAR gene through its protein inhibition of autophagy plays a significant role in cancer progression.
In summary, the role of autophagy is complex and paradoxical in tumorigenesis. Most studies support that autophagy can support cell survival in response to different stress conditions during cancer progression and treatment. Some studies have also found that defects in autophagy could promote tumor development. Previous study by our group showed that the autophagy activity and apoptosis rate of NPC cells were enhanced after silencing of TIGAR.Citation33 Hence, we speculated that the autophagy process regulated by TIGAR may suppress the development of NPC cells. However, we still do not know the exact autophagy-related regulatory mechanism involved in the development of NPC, and thus will focus on this potential regulatory mechanism underlying pharyngeal cancer development in further research.
Conclusion
In conclusion, TIGAR was frequently expressed in NPC tissues, and positive TIGAR expression was revealed to be associated with poor prognosis. These findings indicate that TIGAR is associated with the development of NPC, and may be a potential therapeutic target. We also examined the different expression patterns of TIGAR and LC3B in NPC tumors; TIGAR+ and LC3B− expressions were significantly associated with relatively poor prognosis in NPC, alone and in combination. The results of this study implied that TIGAR and LC3B may be a novel molecular target in the therapy for NPC.
Acknowledgments
This study was supported by the National Natural Science Foundation of China, grant number NSCF81201784. We thank Jun Liu for the technical assistance and Shaozhi Fu for providing helpful comments on the manuscript. We would like to acknowledge the staff at the Department of Oncology, the Affiliated Hospital of Southwest Medical University, for collecting the follow-up data. In addition, we thank Yan Tang for the assistance in statistics and data analyses.
Author contributions
All authors contributed toward data analysis, drafting and critically revising the paper, gave final approval of the version to be published, and agree to be accountable for all aspects of the work. MW was responsible for designing the research regime based on the current data, and analyzing and interpreting data and writing the manuscript. JP was involved in acquiring data and helping to analyze data. PW made contributions to data aquisition and gave some suggestions in the writing of the manuscript. PC directed the conception and design of the research. HY helped to acquire data and directed analysis of data. YC was involved in revising the manuscript. LY put forward the study concept and provided critical advice on the experimental design. All authors have read and approved the final manuscript.
Disclosure
The authors report no conflicts of interest in this work.
References
- MelvinLKChuaJHuiEPChanATCNasopharyngeal carcinomaLancet2016387100221012102426321262
- AhmadlooNKaniA-AMohammadianpanahMThe efficacy and safety of induction chemotherapy with docetaxel, cisplatin and 5-fluorouracil (TPF) in treating patients with locally advanced nasopharyngeal carcinomaEJENTAS2012133107112
- GriffinSWalkerSSculpherMCetuximab plus radiotherapy for the treatment of locally advanced squamous cell carcinoma of the head and neckHealth Technol Assess200913Suppl 14954
- ZhouYShiDMiaoJPD-L1 predicts poor prognosis for nasopharyngeal carcinoma irrespective of PD-1 and EBV-DNA loadSci Rep201774362728256540
- ZhaoYShenLHuangXHigh expression of Ki-67 acts a poor prognosis indicator in locally advanced nasopharyngeal carcinomaBiochem Biophys Res Commun20174941–239039628947213
- AliSMYaoMYaoJComprehensive genomic profiling of different subtypes of nasopharyngeal carcinoma reveals similarities and differences to guide targeted therapyCancer2017123183628363728581676
- MizushimaNLevineBCuervoAMKlionskyDJAutophagy fights disease through cellular self-digestionNature200845171821069107518305538
- LevineBKroemerGAutophagy in the pathogenesis of diseaseCell20081321274218191218
- KroemerGLevineBAutophagic cell death: the story of a misnomerNat Rev Mol Cell Biol20089121004101018971948
- KimuraTTakabatakeYTakahashiAIsakaYChloroquine in cancer therapy: a double-edged sword of autophagyCancer Res20137313723288916
- WhiteEDeconvoluting the context-dependent role for autophagy in cancerNat Rev Cancer201212640141022534666
- WhiteEThe role for autophagy in cancerJ Clin Invest20151251424625654549
- AdamsODislichBBerezowskaSPrognostic relevance of autophagy markers LC3B and p62 in esophageal adenocarcinomasOncotarget2016726392413925527250034
- NiklausMAdamsOBerezowskaSExpression analysis of LC3B and p62 indicates intact activated autophagy is associated with an unfavorable prognosis in colon cancerOncotarget2017833546045461528903368
- LiuJLChenFFLungJPrognostic significance of p62/SQSTM1 subcellular localization and LC3B in oral squamous cell carcinomaBr J Cancer2014111594495424983366
- BensaadKCheungECVousdenKHModulation of intracellular ROS levels by TIGAR controls autophagyEmbo J200928193015302619713938
- KumarBIqbalMASinghRKBamezaiRNResveratrol inhibits TIGAR to promote ROS induced apoptosis and autophagyBiochimie2015118263526212201
- ZhangHGuCYuJRadiosensitization of glioma cells by TP53-induced glycolysis and apoptosis regulator knockdown is dependent on thioredoxin-1 nuclear translocationFree Radic Biol Med201469723924824509157
- YeLZhaoXLuJQianGZhengJCGeSKnockdown of TIGAR by RNA interference induces apoptosis and autophagy in HepG2 hepatocellular carcinoma cellsBiochem Biophys Res Commun2013437230030623817040
- YuHPXieJMLiBTIGAR regulates DNA damage and repair through pentose phosphate pathway and Cdk5-ATM pathwaySci Rep20155985325928429
- Al-KhayalKAbdullaMAl-ObeedOIdentification of the TP53-induced glycolysis and apoptosis regulator in various stages of colorectal cancer patientsOncol Rep20163531281128626675982
- CheungECAthineosDLeePTIGAR is required for efficient intestinal regeneration and tumorigenesisDev Cell201325546347723726973
- SinhaSGhildiyalRMehtaVSSenEATM-NFκB axis-driven TIGAR regulates sensitivity of glioma cells to radiomimetics in the presence of TNFαCell Death Dis201345e61523640457
- WonKYLimSJKimGYRegulatory role of p53 in cancer metabolism via SCO2 and TIGAR in human breast cancerHum Pathol201243222122821820150
- EdgeSBComptonCCThe American Joint Committee on Cancer: the 7th edition of the AJCC cancer staging manual and the future of TNMAnn Surg Oncol20101761471147420180029
- ICRUPrescribing Recording and Reporting Photon Beam Therapy. ICRU report 50Bethesda, MDInternational Commission on Radiation Units and Measurements1993318
- ICRUPrescribing Recording and Reporting Photon Beam Therapy (Supplement to ICRU Report 50). ICRU report 61Bethesda, MDInternational Commission on Radiation Units and Measurements1999420
- ICRUPrescribing Recording and Reporting Photon Beam Therapy. ICRU report 71Bethesda, MDInternational Commission on Radiation Units and Measurements20042534
- ICRUPrescribing Recording and Reporting Photon Beam Therapy Intensity-Modulated Radiation Therapy (IMRT). ICRU report 83International Commission on Radiation Units and Measurements2010101134
- RichardsRJResponsibility for statistical analysesEndocr Pract200394329
- WangJYWuTMaWExpression and clinical significance of autophagic protein LC3B and EMT markers in gastric cancerCancer Manag Res2018101479148629928144
- BensaadKTsurutaASelakMATIGAR, a p53-inducible regulator of glycolysis and apoptosisCell2006126110712016839880
- ZhaoMFanJLiuYOncogenic role of the TP53-induced glycolysis and apoptosis regulator in nasopharyngeal carcinoma through NF-κB pathway modulationInt J Oncol201648275676426691054
- ChenSJiangYZHuangLThe residual tumor autophagy marker LC3B serves as a prognostic marker in local advanced breast cancer after neoadjuvant chemotherapyClin Cancer Res201319246853686224141623
- SumanSdasTPReddyRThe pro-apoptotic role of autophagy in breast cancerBr J Cancer2014111230931724945999
- WangYWangCTangHDecrease of autophagy activity promotes malignant progression of tongue squamous cell carcinomaJ Oral Pathol Med201342755756423464740
- SchläfliAMAdamsOGalvánJAPrognostic value of the autophagy markers LC3 and p62/SQSTM1 in early-stage non-small cell lung cancerOncotarget2016726395443955527250032
- ElmashedSO’DonovanTRKayEWLC3B globular structures correlate with survival in esophageal adenocarcinomaBMC Cancer201515111225971837
- WuDHJiaCCChenJAutophagic LC3B overexpression correlates with malignant progression and predicts a poor prognosis in hepatocellular carcinomaTumour Biol20143512122251223325256671
- JoshiSRyanKMAutophagy chews Fap to promote apoptosisNat Cell Biol2014161232524366033
- HeYZhaoXSubahanNRFanLGaoJChenHThe prognostic value of autophagy-related markers beclin-1 and microtubule-associated protein light chain 3B in cancers: a systematic review and meta-analysisTumour Biol20143587317732624838948
- XieJMLiBYuHPTIGAR has a dual role in cancer cell survival through regulating apoptosis and autophagyCancer Res201474185127513825085248
- MaTZhangYZhangCLuoJGKongLYDownregulation of TIGAR sensitizes the antitumor effect of physa pubenolide through increasing intracellular ROS levels to trigger apoptosis and autophagosome formation in human breast carcinoma cellsBiochem Pharmacol20171439010628774732