

Abstract
Background
Most carcinomas are composed of heterogeneous populations of tumor cells with distinct and apparently stable phenotypic characteristics.
Methods
Using an in vitro model of carcinogenesis we aimed at experimentally elucidating the significance of heterogeneity in the expression of CD24, a marker frequently overexpressed in various cancers and correlated with poor prognosis.
Results
We show that CD24Neg and CD24Pos cells issued from the same tumorigenic cell line display striking differences in stem-related properties, expression of epithelial–mesenchymal transition/mesenchymal-epithelial transition markers, and tumorigenic capacity. Indeed, while CD24Neg cells were as tumorigenic as the parental cell line, CD24Pos cells, although unable to form tumors, were unexpectedly more mesenchymal, displayed enhanced stemness-related properties, and expressed a proinflammatory signature.
Conclusion
Our findings support the view that acquisition of stem-like cell, CD24-associated, attributes like migration, invasion, and plasticity by a tumor subpopulation is not necessarily related to local tumor growth but may be required for escaping the niche and colonizing distant sites.
Supplementary materials
Figure S1 Early evaluations of the differentiation capacity did not reveal differences between CD44+CD24Neg and CD44+CD24Pos cells.
Notes: Differentiation to adipocytes (stained with oil red-O), osteoblasts (stained for alkaline phosphatase activity), and chondrocytes (stained with Safranin O) mesenchymal cell lineages was induced by standard protocols. Differentiation was evaluated after 3 days of induction. Representative images (20×) and image enlargements from the experiment are shown.
Abbreviations: Neg, negative; Pos, positive.
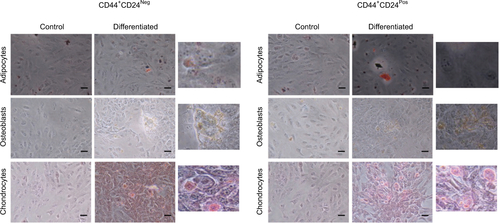
Figure S2 CD44+CD24Pos cells show more efficient adipogenic differentiation capacity.
Notes: (A) Adipogenic differentiation was evaluated after 6 and 9 days of induction by oil red-O staining. Relative gene expression levels of PPARγ and CBPF involved in adipogenic differentiation were determined by qRT-PCR; the values were normalized to (B) GAPDH and relative to control cells (undifferentiated) or to (C) CD44+CD24Neg cells. Error bars represent SEM (*P<0.05).
Abbreviation: GAPDH, glyceraldehyde 3-phosphate dehydrogenase; Neg, negative; Pos, positive.
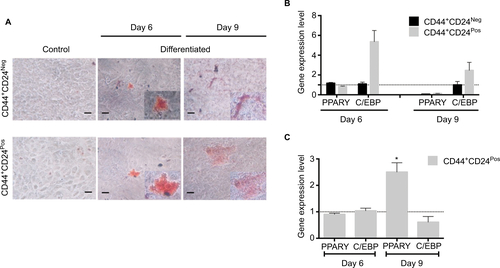
Figure S3 CD44+CD24Pos cells show more efficient osteogenic differentiation capacity.
Notes: (A) Osteogenic differentiation was evaluated after 6 and 9 days of induction by alkaline phosphatase staining. Relative gene expression levels of ALP and RUNX2 involved in osteogenic differentiation were determined by qRT-PCR; the values were normalized to (B) GAPDH and relative to control cells (undifferentiated) or to (C) CD44+CD24Neg cells. Error bars represent SEM (*P<0.05; **P<0.01).
Abbreviations: ALP, alkaline phosphatase; GAPDH, glyceraldehyde 3-phosphate dehydrogenase; Neg, negative; Pos, positive.
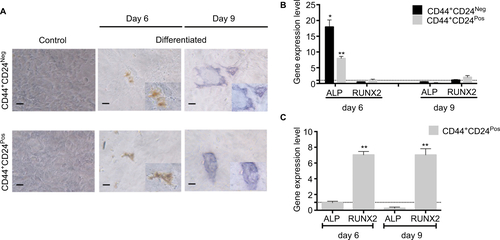
Figure S4 CD44+CD24Pos cells show more efficient chondrogenic differentiation capacity.
Notes: (A) Chondrogenic differentiation was evaluated after 6 and 9 days of induction by Safranin O staining. Relative gene expression levels of SOX9 and AGGRECAN involved in chondrogenic differentiation were determined by qRT-PCR; the values were normalized to (B) GAPDH and relative to control cells (undifferentiated) or to (C) CD44+CD24Neg cells. Error bars represent SEM (*P<0.05; **P<0.01; ***P<0.001).
Abbreviation: GAPDH, glyceraldehyde 3-phosphate dehydrogenase; Neg, negative; Pos, positive.
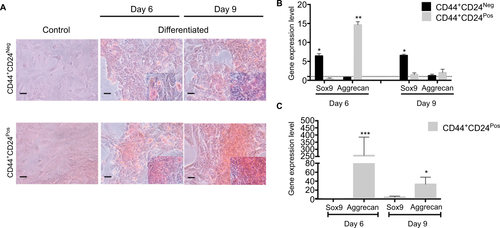
Table S1 Primer sequences
Acknowledgments
We would like to thank Doctor Jinneth Acosta, Pathology Group, Faculty of Medicine, Universidad Nacional de Colombia, for processing and analyses of tumors. This work was supported by funding from the Patrimonio Autónomo Fondo Nacional de Financiamiento para la Ciencia, la Tecnología y la Innovación, Francisco José de Caldas, Colciencias (Contract No RC-692–2013), División de Investigación y Extensión, Bogotá, and Faculty of Medicine, Universidad Nacional de Colombia, to JPV. Work in the laboratory of ALV was supported by INCa and ARC grants and the Labellisation Program of the “Ligue contre le Cancer”.
Author contributions
PO-M, AL-V, and JPV conceived and designed the study. PO-M carried out most of the experiments. W-YL-B carried out animal experimentation. PO-M, AL-V, and JPV analyzed data, interpreted the results, and wrote the article. All authors contributed to data analysis, drafting and revising the article, gave final approval of the version to be published, and agree to be accountable for all aspects of the work.
Disclosure
The authors report no conflicts of interest in this work.