
Abstract
Background
Dysregulation of erythropoietin-producing hepatoma (Eph) proteins in human cancers is extensively documented but not clear in colorectal cancer (CRC). In this study, we aimed to investigate the role of Notch signaling pathway and epigenetic modification of EPHB2 and EPHB4 expression in serrated neoplasia development.
Methods
The expression of EPHB2 and EPHB4 in CRC clinical specimens and cell lines were determined by immunohistochemistry, Western blot, and real-time PCR. Cell proliferation and invasion were evaluated by MTT and chamber kits, luciferase assay and co-immunoprecipitation were used to detect the transcriptional regulation and protein–protein interactions, respectively. The immunofluorescence assay was employed to confirm the subcellular location of Notch intracellular domain (NICD), and chromatin immunoprecipitation assay was implied to detect the modification types of H3K4me3 and H3K27me3. Mice xenograft model was used to detect the in vivo effects of EPHB2 and EPHB4 genes on cell growth.
Results
In CRC clinical specimens and cell lines, we found that EPHB2 was significantly decreased, while EPHB4 was elevated in the CRC tissues, and these aberrant expression manners correlated with worse overall survival rates in the clinic. When the EPHB2 and EPHB4 expressions were manipulated by overexpression or knockdown in the SW620 cells, the cell proliferation and invasion were obviously suppressed, whereas EPHB2 knockdown or EPHB4 overexpression showed the opposite phenotypes. We also found that Notch signaling pathway was abnormally activated and treatment of Notch signaling ligand human Jagged1 peptide downregulated EPHB2 and upregulated EPHB4 in the SW620 cells, as well as promoted the chromatin modification protein Jumonji domain-containing protein-3 (JMJD3) cytonuclear trans-localization with the NICD, which indicated that NICD brought JMJD3 to the EPHB4 enhancer region to decrease the H3K27me3 level.
Conclusion
Taken together, we provide a new mechanistic option in understanding the role of Notch signaling and the roles of EPHB2 and EPHB4 in CRC.
Introduction
Colorectal cancer (CRC) accounts for ~95% colorectal tumors and is the most common lethal disease of digestive system,Citation1 and rates in individuals aged <55 years increased by almost 2% per year from the mid-1990s to 2014.Citation2 Conventional adenoma and serrated polyps (SPs) are main types of the colorectal adenoma, in which the conventional adenomas include tubular adenoma, tubular-villous adenoma, and villous adenoma subtypes, and the SP includes hyperplastic polyp (HP), sessile serrated adenoma (SSA), and traditional serrated adenoma (TSA) subtypes.Citation3 Recently, the serrated neoplasia pathways have been investigated and results indicated that they varied from HP proliferation to the serrated adenoma and the malignant adenocarcinoma. About 60% of CRC started from conventional adenoma and 35% from the serrated pathway.Citation4 SSAs are believed to be the precursors of sporadic BRAF-mutated CRCs, microsatellite instability, and concurrent hypermethylation of multiple loci, which is termed as CpG island methylator phenotype.Citation5,Citation6 TSAs may be precursors of the microsatellite stable CRCs,Citation7 but the fundamental mechanisms underlying the progression of carcinogenesis are still unclear.
It has been clarified that Notch signaling takes part in the origination and maintenance of colon cancers, and highly expressed Notch signaling components are correlated with cancer progression and metastasis.Citation8 Unfortunately, key roles of Notch signaling in early-stage CRC initiation are not clear, and only a few in vitro mechanistic studies of Notch signaling have been investigated.Citation9
The erythropoietin-producing hepatoma (Eph) family of receptor tyrosine kinases as well as the ephrins, ligands of their membrane bound, have been found to play important roles in regulating cell adhesion and migration during cancer development.Citation10 Roles of EPHB2 and EPHB4 in colon cancer have been extensively studied,Citation11 for example, EPHB2 acts to control cell compartmentalization in the proliferative crypts of the colon,Citation12 but downregulation of EPHB2 has been correlated with more advanced CRC, differentiation, and overall survival (OS).Citation13 Increased expression of the molecular target, EPHB4 receptor, has been observed in several cancer types. High EPHB4 expression enhanced migratory ability of these CRC cell lines in vitro and contributed to a significant increase in tumor growth and vascularization in vivo.Citation14 However, studies on the role of EPHB2 and EPHB4 in CRC have yielded contradictory results.
Epigenetic modifications play major role in gene expression through DNA methylation in the promoter regions and histone modifications, including acetylation, phosphorylation, ubiquitination, sumoylation, and methylation. Among these modifications, histone methylation is dynamically modified by histone methyltransferases and demethylases, resulting in mono- to tri-methylation status at different sites with different functions. For example, trimethylation of histone 3 at lysine 4 (H3K4) is considered to activate gene expressions; however, trimethylation of histone 3 at lysine 27 (H3K27) is thought to be the repression status of gene expression. The polycomb repressive complex 2 contains the H3K27 methyltransferase Ezh2, and the Jumonji domain-containing protein 3 (JMJD3) are known as the H3K27 demethylases of H3K27me2/3.Citation15 Although JMJD3 downstream effects have been reported, its underlying mechanism in regulating transcription in CRC prognosis is still not understood.Citation16
The aim of this study was to investigate the role of Notch signaling pathway and epigenetic modification of EPHB2 and EPHB4 expression contribution to serrated neoplasia development.
Materials and methods
Clinical samples and ethic approval
Colorectal polyps/adenoma specimens from colonoscopy were collected at the Binzhou Medical University Hospital from May 2011 to May 2016, and 146 cases of polyps and adenomas with serrated structure of crypts were selected to gather case information. According to the diagnostic criteria of WHO and related literature, serrated lesions were classified histologically, including 140 SPs (HP, SSA/P, and TSA) and 6 mixed polyps/adenomas. A specially trained researcher performed primary screening of polyps and adenomas that had serrated structures from all sections and handed over the screened specimens to two senior pathologists. According to the diagnostic criteria for SPs of WHO and the literature renew of histological diagnosis,Citation17 differential diagnosis and classification to reorganize the serrated lesions were provided. Clinicopathological information and patient personal history were also collected. Experiments involving human samples were approved by the Ethic Committee of Binzhou Medical University, and written informed consent was obtained from all patients.
Immunohistochemistry and scoring
Paraffin-embedded tissues were cut into 4 µm slides, de-paraffinized at 60°C for 1 hour, and rehydrated in xylene and ethanol. After antigen retrieval and endogenous peroxidase blockage with 3% hydrogen peroxide for 10 minutes at room temperature, slides were blocked with 10% normal goat serum to exclude nonspecific bindings. Then, slides were incubated with goat polyclonal antibody against human EPHB2 (R&D, Minneapolis, MN, USA, #AF467; 1:200 dilution) and EPHB4 (R&D, # AF3038; 1:200 dilution) at 4°C overnight. The sections were then incubated with horseradish peroxidase-conjugated secondary antibody (ZSGB-BIO, Beijing, China, #ZB-2306) for 1 hour at room temperature. After washing, DAB substrate kit (ZSGB-BIO, #ZLI9017) was used to visualize the antigen–antibody complex. The percentage of stained cells on each section was scored as 0 (<25%), 1 (25%–50%), 2 (50%–75%), and 3 (>75%) by independent pathologists. Staining intensity was scored as 0 (no staining), 1 (weak staining), 2 (moderate staining), and 3 (strong staining).
Cell culture and transfection
CRC cell line SW620 and HCT116 cells were bought from American Type Culture Collection and was cultured in DMEM media containing 10% FBS (Gibco, Thermo Fisher Scientific, Shanghai, China) and maintained in a 5% CO2 air-humidified atmosphere at 37°C. The EPHB2 and EPHB4 overexpression plasmids (OE group) were constructed by Genechem Company (Shanghai, China). The siRNA targeting human EPHB2 or EPHB4 (KD group) and siRNA-negative scramble control (Scr) were synthesized and purified by Invitrogen (Thermo Fisher Scientific). Non-target control or siRNA was transfected by using Lipofectamine 3000 or RNAi-MAX (Thermo Fisher Scientific), and medium was replaced 6 hours after transfection. A final concentration of 100 nM siRNA and Scr was used, and the expression and mRNA were checked at 48 hours after transfection. The human Jagged1 peptide (hJAG-1, Abcam Trading, #ab94375, Shanghai, China) was Notch signaling ligand.
RNA isolation and quantitative real-time (qRT)-PCR
Total mRNA was isolated using the Trizol reagent (Invitrogen). Complementary DNA was reversely transcribed and then subjected to RT-PCR according to the protocols of the manufacturer (Applied Biotechnology, Grand Island, NY, USA). The primers used included the following. EPHB2: CCAGCCGGACCAGCCCAATG, ACGATGGCGATGACAACCACAGC; EPHB4: CCAACTCCAGCCACGTCTTGCT, ATACTCCGCGCGGGACTCCT; glyceraldehyde-3-phosphate dehydrogenase (GAPDH): GGAGCGAGATCCCTCCAAAAT, GGCTGTTGTCATACTTCTCATGG. A triplicate sample was analyzed in each group.
Western blotting and co-immunoprecipitation (Co-IP)
Whole cell extracts of cell lines were used in Western blots for EPHB2 (Santa Cruz, Dallas, TX, USA, #sc-130752), EPHB4 (Santa Cruz, #sc-5536), and GAPDH (Santa Cruz, #sc-51631). Nuclear extracts for Co-IP were prepared and diluted using the NE-PER Nuclear and Cytoplasmic Extraction Kit (Thermo Fisher Scientific, #78835) and RIPA buffer (Life Technologies, Grand Island, NY, USA, 89900). The IP was incubated with JMJD3 antibody (Abcam, #ab38113), Notch intracellular domain (NICD) antibody (Abcam, # ab8925), or EZH2 antibody (Abcam, #ab186006) overnight at 4°C, the protein G Dyna-beads (Life Technologies, 10009D) were added and incubated at 4°C for 3 hours. After washing with RIPA buffer three times, the beads were resuspended in reducing SDS gel loading buffer. The gray-scale assay for each blots was analyzed using MultiGauge V3.0 software (Fujifilm, Tokyo, Japan), and number under each blots presents the relative level compared with the vector or Scrss.
Invasion assay
2.5×10⁴ serum-starved cells were added to the chamber of BioCoat Matrigel Invasion Kit (BD Biosciences, Franklin Lakes, NJ, USA, #354480) with complete culture media containing 10% FBS at the bottom. After being incubated for 24 hours, non-invading cells were removed from upper surface of the membrane using cotton-tipped swabs. Blind counts of invaded cells were obtained following Crystal Violet staining of live cells. This assay was performed with four replicates for each cell type.
Luciferase activity assay
A DNA fragment containing EPHB2 or EPHB4 promoter was amplified from human genomic DNA by Genechem Company, Shanghai, China, and then cloned into luciferase report vector pGL3. Luciferase activity assay was performed as previously described using the Dual-Luciferase Reporter Assay System (Promega, Madison, WI, USA) according to the instructions of the manufacturer. SW620 cells were transient transfected with pLG3-EPHB2 or pLG3-EPHB4 promoters and Renilla luciferase vector. Cell lysate was collected 48 hours after transfection for luciferase assay, and Renilla luciferase activity was used as the endogenous control. All experiments were performed in triplicate.
Immunofluorescence
Immunofluorescence analysis of NICD and JMJD3 was performed on CRC cell lines using the mouse monoclonal to Notch1 antibody (Abcam, # ab44986) and rabbit polyclonal to JMJD3 antibody (Abcam, #ab38113). In brief, formaldehyde fixed cells (2% formaldehyde for 10 minutes) were washed and incubated with primary antibodies for 20 minutes, then cells were washed and incubated with fluorescent secondary antibody for 15 minutes. The cover slips were mounted onto slides using the DAKO fluorescent mounting medium (Agilent, Carpinteria, CA, USA). Cells were scanned using a Leica TCS SP2 confocal microscope and Leica Confocal Software v2.7. The excitation source for Alexa 488 was a 20 mW Argon Laser at 488 nm, whereas the excitation source for Alexa 594 was a 1.2 mW Green HeNe Laser at 543 nm.
Chromatin immunoprecipitation (ChIP)
Cells were trypsinized and fixed for 15 minutes at room temperature. The reaction was quenched with 0.125 M glycine at room temperature. After washing with PBS, the cells were collected, and the pellet was lysed in lysate buffer. The isolated nuclei were spin and washed, then sonicated using a Diagenode Bioruptor to an average chromatin size of 200 bp. Chromatin was diluted with 2× IP buffer, to which antibodies were added to each IP. IPs were performed overnight, after which Dynabeads (Life Technologies) were incubated for an additional 2 hours. The beads were washed five times with wash buffer and resuspended in IP buffer. The chromatin was incubated for 15 minutes at room temperature, and the cross-linking was reversed at 65°C for 16 hours. After reversal, a Proteinase K digest was performed for 2 hours at 55°C, and DNA was extracted using a PCR purification kit (Qiagen, Valencia, CA, USA). A total of 10% of the input was treated in parallel.
Animal experiments
The guidelines for the welfare and use of animals in cancer research were approved by the Binzhou Medical University Hospital Laboratory Animal Ethical Committee (20160323) according to the Regulations of Laboratory Animal Administration of China (2011). A total of 40 BALB/c mice (20 males and 20 females) were divided into four groups in the xenograft experiments: the EPHB2 Vec group (n=10), the EPHB2 OE group (n=10), the EPHB4 Scr group (n=10), and the EPHB4 KD group (n=10). For xenograft experiments, 2×10⁶ cells were implanted in the flanks of male BALB/c mice. Tumor size was measured every 3 days and calculated by 0.5×L×W,Citation2 where L and W mean the largest and smallest lengths of the palpable tumor, respectively. Mice were sacrificed after 24 days treatment when tumor size reached 15 mm, and tumors were excised to measure the final tumor size.
Statistical analysis
Quantitative gene expression data from tissue arrays and paired normal and CRC samples were analyzed using the non-parametric Wilcoxon signed-ranks. Two-tailed t-tests and one-way ANOVA were used to determine statistical significance, and F tests to compare variances among groups. All statistical analyses were performed using SPSS v15.0, and a P<0.05 was considered statistically significant. Where appropriate, a Bonferroni adjustment was applied to P-values.
Results
Expression of EPHB2 and EPHB4 were dysregulated during carcinogenesis of SPs
First of all, 140 cases of SP were included in the current study. There were 85 cases of HP, accounts for 60.7% of SPs; 5 cases of SSA, accounts for 3.6%; 50 cases of TSA, accounts for 35.7%. 58.9% diameter <5 mm in HP; 40% diameter <5 mm, 60.0% diameter <10 mm in SSA; 52.0% diameter 5–10 mm in TSA. The differences between SP sizes were statistically significant (P<0.05) (). Then, we found that HP and TSA occurred mostly in the rectum and sigmoid colon, accounting for about 76.5% (65/85) and 70.0% (35/50), respectively. SSA occurred mostly in ascending and transverse colons, accounting for 60.0% (3/5). The differences between lesion distribution sites were statistically significant (χ2=30.61, P<0.005) ().
Table 1 Serrated polyp sizes
Table 2 The distribution sites of serrated polyps (case)
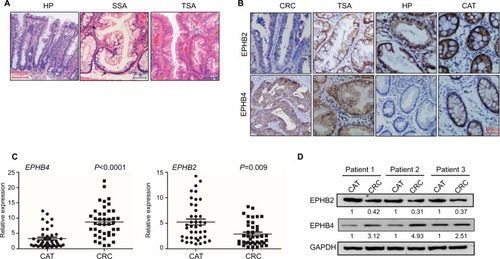
Furthermore, the clinical and pathological features of HP, SSA, and TSA were detected using H&E staining. The representative images showed that crypts were narrow with serrated structure in the upper one-half or one-third of the HP tissues, but no significant cell atypia was observed. Glands structures were significant serrated with obvious dysplasia in the TSA tissues. Abundant serrated structures were seen in the SSA/P tissues, and the base was enlarged to branch shape and shaped a typical inverted “T” type or boot type; mitosis was seen in the upper and middle part of the crypts (). Then, we detected the expression of EPHB2 and EPHB4 in different types of SP by immunohistochemistry. These results showed that the positive expression rates of EPHB2 in normal colorectal mucosa, HP, TSA, and CRC tissues were 90.9% (30/33), 72.4% (21/29), 80.8% (21/26) and 56.9% (41/72). The positive expression rates of EPHB4 in normal colorectal mucosa, HP, TSA, and CRC tissues were 45.5% (15/33), 17.2% (5/29), 42.3% (11/26), and 73.6% (53/72), respectively (, ). We examined the mRNA levels of EPHB2 and EPHB4 via qPCR in the cancer adjacent tissues (CAT) and CRC tissues, and found that EPHB2 gene was downregulated in CRC cancer tissues compared with CAT, whereas the expression of EPHB4 was increased in CRC tissues (). In addition, the protein levels of EPHB2 and EPHB4 were verified by Western blot, which showed that EPHB2 maintained high level and EPHB4 maintained low level in normal tissues, but the expression of EPHB2 and EPHB4 were dysregulated in the CRC tissues (). These data implied that EPHB2 and EPHB4 gene might play opposite roles during carcinogenesis of SPs.
Table 3 Expression of EphB2 and EphB4 in various tissues (case)
Figure 1 Expression of EPHB2 and EPHB4 in serrated polyps.
Note: (A) Shown are H&E staining for typical HP, SSA, and TSA tissues. Magnification, 200×. (B) Immunohistochemistry staining showed the expressions of EPHB2 and EPHB4 in the representative CAT, HP, TSA, and CRC. Magnification, 200×. (C) Relative mRNA levels of EPHB2 and EPHB4 in CAT group and CRC group via qRT-PCR. (D) Protein expression levels of EPHB2 and EPHB4 in Para group and CRC group via Western blot, and number under each blot presents means of three independent analysis, and are compared to the endogenous GAPDH controls.
Abbreviations: CAT, cancer adjacent tissues; CRC, colorectal cancer tissues; GAPDH, glyceraldehyde-3-phosphate dehydrogenase; HP, hyperplastic polyp; SSA, sessile serrated adenoma; TSA, traditional serrated adenoma.
EPHB2 and EPHB4 indicate opposite prognosis
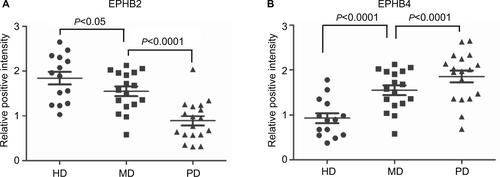
In 72 cases of CRC, the positive expression rates of EPHB2 in highly differentiated and poorly differentiated groups were 69.6% (32/46) and 34.6% (9/26), respectively, which were lower in poorly differentiated group than in highly differentiated group (χ2=8.2758, P<0.005). The positive expression rates of EPHB2 in lymphatic metastasis and non-lymphatic metastasis groups were 33.3% (10/30) and 73.8% (31/42), respectively; the expression of EPHB2 in metastasis group was lower than that in non-metastasis group (χ2=11.6938, P<0.005). In 72 cases of CRC, 41 cases were Dukes A+B and the positive expression rate of EPHB2 was 73.2%; 31 cases were Dukes C+D and the positive rate of EPHB2 was 35.5% (χ2=10.2262, P<0.005). The results showed that the expression of EPHB2 decreased during tumor development, suggesting that its high level of expression may inhibit tumor development and reduce tumor cell invasiveness. There was no significant correlation between age, sex, and lesion site (P>0.05). On the other hand, the positive expression rates of EPHB4 in highly differentiated and poorly differentiated groups were 65.2% (30/46) and 88.5% (23/26), respectively, which were higher in poorly differentiated group than in highly differentiated group. The positive expression rates of EPHB4 in lymphatic metastasis and non-lymphatic metastasis groups were 86.7% (26/30) and 64.3% (27/42), respectively. The expression of EPHB4 in metastasis group was higher than that in non-metastasis group (P<0.05). In 72 cases of CRC, 41 cases were Dukes A+B and the positive rate of EPHB4 was 56.1%, 31 cases were Dukes C+D and the positive rate of EPHB4 was 96.8%. The results showed that EPHB4 expres sion increased during tumor development, suggesting that its expression level may be related to tumor development and invasiveness (, , and ).
Table 4 EphB2, EphB4 receptor expression and clinicopathological features of colorectal cancer (case)
Figure 2 EPHB2 and EPHB4 indicate opposite prognosis.
Note: (A) Immunohistochemistry staining of EPHB2 and EPHB4 expressions in the representative HD CRC, MD CRC, and CRC. Magnification, 200×. (B) Relative mRNA levels of EPHB2 and EPHB4 in metastasis group (M) and non-metastasis group (Non-M) via qRT-PCR. (C) Kaplan–Meier assay showed the survival analyses of CRC patients based on EPHB2 or EPHB4 expression. High EPHB2 or EPHB4 represents patients with individual expression of EPHB2 or EPHB4 ≥ cutoff, and low EPHB2 or EPHB4 represents patients with individual expression < cutoff.
Abbreviations: CRC, colorectal cancer; HD, high differentiation; PD, poor differentiation; MD, medium differentiation.
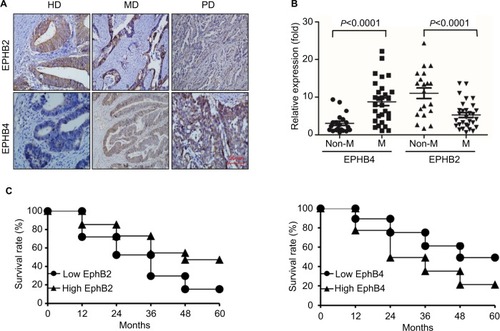
The qPCR was used to detect the mRNA levels of EPHB2 and EPHB4 in different groups. We found that the expression of EPHB2 was decreased in lymphatic metastasis group compared with non-lymphatic metastasis group, whereas the expression of EPHB4 showed opposite trend (). Additionally, the 5-year OS rates were detected for patients in the different groups according to the expression levels of EPHB2 and EPHB4. The result showed that patients with high EPHB2 and low EPHB4 expression had better OS than those with low EPHB2 and high EPHB4 (), which confirmed that EPHB2 and EPHB4 indicate opposite prognosis.
EPHB2 and EPHB4 participate in the proliferation and invasion of CRC cells
Human CRC cell lines SW620 and HCT116 were used to investigate the biological function of EPHB2 and EPHB4; first, the overexpression (OE) and knockdown (KD) systems for EPHB2 and EPHB4 were constructed in these two CRC cells, and Western blot assay was used to confirm the protein levels of EPHB2 and EPHB4 in the OE or KD cells. As shown in , both the EPHB2 and EPHB4 protein levels were successfully elevated or suppressed in our OE or KD systems, respectively. Then, the MTT assay was used to measure the cell growth rate. Our data showed that when EPHB2 was overexpressed in SW620 cells, the proliferation rate was significantly decreased compared with the vector control, whereas the cells grew up rapidly when EPHB2 expression was knocked down, the biological function of EPHB4 showed the opposite phenomenon (). On the other hand, invasion capability was also detected in SW620 cells. We found that OE of EPHB2 resulted in lower invasion rate, and KD of EPHB2 led to higher invasion rate compared with control. At the same time, the EPHB4 showed the opposite phenomenon again (). In addition, EPHB2 and EPHB4 genes were also manipulated in the HCT116 cells successfully as previously (), and the effects of EPHB2 and EPHB4 alternation on cell growth and cell invasion capability were also successfully elicited similarly as in the SW620 cells ().
Figure 3 Manipulation of EPHB2 and EPHB4 alters the proliferation and invasion of SW620 and HCT 116 cells.
Note: (A) Western blot assay showed the protein levels of EPHB2 and EPHB4 in OE or KD SW620 cells. Vec, Scr siRNA. (B) Shown were cell proliferation of SW620 cells with EPHB2 and EPHB4 OE or KD via MTT assay. (C) Analysis of the cell invasion capability of SW620 cells with EPHB2 and EPHB4 OE or KD. (D) Protein levels of EPHB2 and EPHB4 in HCT116 cells with EPHB2 and EPHB4 OE and KD. (E) and (F) showed the cell proliferation and invasion capability in HCT116 cells with EPHB2 and EPHB4 OE and KD. *P<0.05; **P<0.01, OE vs Vec and KD vs Scr, respectively. Numbers under each blot present the means of three independent analysis and are compared with the Vec or Scr controls.
Abbreviations: KD, knockdown; OE, overexpression; Scr, scramble; Vec, vector control.

EPHB2 and EPHB4 play different roles in tumorigenesis and serrated neoplasia
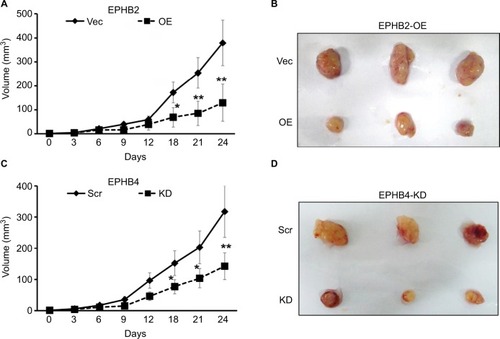
To explore the roles of EPHB2 and EPHB4 in colorectal tumorigenesis, xenograft model was employed, in which SW620 cells with different expression of EPHB2 and EPHB4 were planted into the BALB/c athymic mice. We found that tumor growth was significantly slower in the EPHB2 OE groups compared with the vector control group (EPHB2-Vec) (), and tumor size was obviously smaller when mice were sacrificed for tumor excision (). Similarly, we found that tumorigenesis generated from SW620 cells with EPHB4 KD could be attenuated (). Taken together, EPHB2 OE or EPHB4 KD play important roles in tumorigenesis and serrated neoplasia pathway.
Figure 4 Roles of EPHB2 and EPHB4 in tumorigenesis and serrated neoplasia.
Note: (A) Tumor growth of SW 620 clones with EPHB2 OE (n=10) or Vec control (n=10) in xenografts implanted subcutaneously in nude mice, and tumor size of each group was shown after sacrificed (B). Tumor growth of SW 620 clones with EPHB4 KD (N=10) or Scr control (n=10) in xenografts implanted subcutaneously in nude mice, and tumor size of each group was shown after sacrificed (D). *P<0.05; **P<0.01, compared with the Vec control or Scr control, respectively.
Abbreviations: KD, knockdown; OE, overexpression; Scr, scramble; Vec, vector control.
Activation of Notch signaling in serrated neoplasia
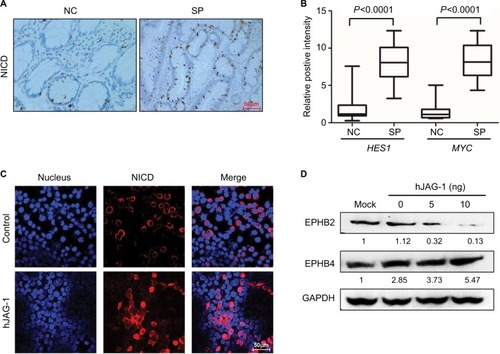
To determine whether activation of Notch signaling is involved in the pathogenesis of serrated neoplasia, we detected the expression of the key regulator of Notch sig-naling, NICD, and HES1 in the normal control (NC) and serrated neoplasia (SP) tissues from patients. The immunohistochemistry of staining showed that NICD protein was significantly elevated in the SP samples, and mainly localized in the nucleus (); meanwhile, the mRNA levels of downstream target genes, MYC and HES1, were also highly expressed in the SP groups compared with the NC (). Whether the Notch signaling pathway was involved in the serrated neoplasia pathogenesis, the Notch ligand, hJAG-1 peptide was added to the SW620 cells in a dose-dependent manner, and the immunofluorescence assay was employed to confirm the subcellular location of NICD. We found that SW620 cells treated with hJAG-1 could promote the NICD protein transported from cytoplasm into nuclear (), and activation of Notch signaling pathway could decrease the EPHB2 expression and increase the EPHB4 expression (), which could indicate that Notch pathway participates in SP pathway.
Figure 5 Activation of Notch signaling in serrated neoplasia.
Note: (A) Immunohistochemistry staining of NICD in the NC tissue and SP tumor. Magnification, 200×. (B) Real-time PCR determined the downstream target genes of Notch signaling in the NC and SP. (C) Immunofluorescence staining showed the cytonuclear translocation of NICD (red) in SW620 cells treated with 10 ng of recombinant human JAG-1 (hJAG-1) for 24 hours. Cell nuclei were stained using DAPI stain (blue). Magnification, 400×. (D) Protein levels of EPHB2 and EPHB4 in SW620 cells stimulated with increasing dosage of hJAG-1 for 24 hours. Numbers under each blot present the means of three independent analysis and are compared with the mock controls.
Abbreviations: hJAG-1, human Jagged1 peptide; GAPDH, glyceraldehyde-3-phosphate dehydrogenase; NC, normal control; NICD, Notch intracellular domain; SPs, serrated polyps.
Expression of EPHB2 and EPHB4 were regulated transcriptionally or epigenetically
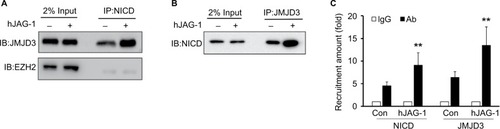
Next, our aim was to evaluate whether the Notch signaling pathway regulate the expression of EPHB2 and EPHB4 in CRC, as well as the detailed mechanism. First, the promoter of EPHB2 and EPHB4 was cloned from the human cDNA and constructed to the luciferase reporter as the EPHB2-luc and EPHB4-luc. Then, hJAG-1 was added to the culture medium. We found that the activation of Notch signaling pathway by hJAG-1 significantly downregulated the luciferase activity in EPHB2 group; however, the luciferase activity nearly maintained the original level in EPHB4 group, which indicated that Notch signaling pathway could inhibit the expression of EPHB2 transcriptionally (). Since EPHB4 was not regulated transcriptionally, so we wanted to investigate whether the epigenetic modification occurred on the EPHB4 enhancer. The ChIP assay data showed the main modification types H3K4me3 and H3K27me3 caused little change on the EPHB2 enhancer (); however, the amount of H3K27me3 was greatly decreased on the EPHB4 enhancer in SW620 cells treated with hJAG-1 compared with control (). Therefore, the H3K27me3 demethylase JMJD3 was chosen for further research. We found that the SW620 cells treated with hJAG-1 showed more NICD into nucleus and co-localization with JMJD3 (). Furthermore, the Co-IP assay indicated that JMJD3 and NICD could form a protein complex when the cells were treated with hJAG-1, which might imply that NICD could bring JMJD3 to some enhancer to play the demethylase function (). Finally, the ChIP assay showed that the enhancer region of EPHB4 harbored more JMJD3 as well as NICD in cells treated with hJAG-1 compared with control group (), which indicated that Notch signaling pathway could regulate the EPHB4 expression epigenetically.
Figure 6 Expression of EPHB2 and EPHB4 were regulated transcriptionally or epigenetically.
Note: (A) Luciferase activities from EPHB2 and EPHB4 promoter reporters in SW620 cells stimulated with increasing dosage of hJAG-1 for 24 hours, and Renilla activities were used as the normalization control. The amount of H3K4me3 and H3K27me3 levels on EPHB4 enhancer (B) and EPHB2 enhancer (C) in SW620 cells stimulated with 10 ng of hJAG-1 for 24 hours. (D) Immunofluorescence staining of JMJD3 (green) and NICD (red) in representative cells. Cell nuclei were stained using DAPI stain (blue). *P<0.05; **P<0.01, compared with the controls. Magnification, 600×.
Abbreviations: hJAG-1, human Jagged1 peptide; JMJD3, Jumonji domain-containing protein 3; NICD, Notch intracellular domain.
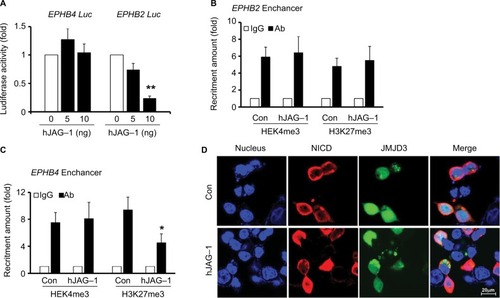
Figure 7 Interaction between NICD and JMJD3 in SW620 cell.
Note: Immunoprecipitation assay showed the enhanced interaction of (A) NICD and (B) JMJD3 in SW620 cells stimulated with hJAG-1 for 24 hours. Immune complexes were immunoprecipitated either NICD antibody or JMJD3 antibody, then analyzed by immunoblotting with JMJD3 or NICD antibody, respectively. (C) The amount of NICD and JMJD3 levels on EPHB4 gene enhancer in SW620 cells stimulated with hJAG-1 for 24 hours. **P<0.01, vs the control.
Abbreviations: IB, immunoblotting; hJAG-1, human Jagged1 peptide; JMJD3, Jumonji domain-containing protein 3; NICD, Notch intracellular domain.
Discussion
The diagnosis of SSA/P could be challenging due to the heavy reliance on the morphology of basal crypts and the interobserver variability. A biomarker that is easy to perform and interpret in daily practice would help practicing pathologists in morphological challenging cases.Citation18 EPHB2 was reported to express by colon progenitor cells but only in 39% of colorectal tumors; EPHB4 is relatively highly expressed in CRC patients, and its expression level correlated with higher tumor stage and grade.Citation19 In our present study, the EPHB2 and EPHB4 were our focus molecule, which indicated that the two genes might play important roles in the tumorigenesis. Through the Cell Counting Kit-8 assay, invasion assay, and xenograft model assay, the biological function of EPHB2 and EPHB4 was confirmed, which indicated that EPHB4 was induced in CRC, in contrast to the downregulation of EPHB2, whereby tumor cells acquire a survival advantage to enter to the SP pathway.
In the previous study, activation of Wnt signaling was required for the progression of CRC by regulating EPHB4 and EPHB2 expression. Lectures also showed that β-catenin–CBP/p300 complex induced EPHB4 and repressed EPHB2 expression, in contrast to the β-catenin–p300 complex. Gain of EPHB4 provides survival advantage to tumor cells and resistance to innate tumor necrosis factor-related apoptosis-inducing ligand-mediated cell death. KD of EPHB4 inhibits tumor growth and metastases.Citation19 On the other hand, Notch signaling pathway plays an important role in the differentiation balance of intestinal crypts and carcinogenesis in CRC.Citation20 Release of the NICD by NOTCH activation to the nucleus activates transcription of numerous downstream target genes.Citation21 Besides, Notch signaling was very important in CRC cancer chemoresistance, and blockage of the Notch signaling pathway by a γ-secretase inhibitor could enhance sensitivity of chemotherapy drugs.Citation22,Citation23 In our present study, we confirmed that Notch signaling pathway could regulate the protein levels of EPHB2 and EPHB4, which make the two genes participate in the serrated neoplasia pathway.
Histone modification alternations, including H3K4me3 and H3K27me3, play important roles in carcinogenesis.Citation24 Al Emran et al showed that the transcriptional active mark H3K4me3 and the repressive mark H3K27me3 decrease occurred on specific molecules in many kinds of cancer cells, and distinct histone modifications denote early stress-induced drug tolerance in cancer.Citation25 Roles of JMJD3 have been investigated in solid and blood cancers.Citation26,Citation27 Whether JMJD3 acts as an oncoprotein or tumor suppressor is controversial. JMJD3 was reported as a tumor suppressor to regulate the INK4B–ARF–INK4A axis and interferon regulatory factor 4, which suppresses proliferation and carcinogenesis, but it is also reportedly highly expressed in cancer tissue, as an oncogene.Citation28 In CRC, JMJD3 is reportedly induced by the vitamin D and suppresses cancer invasion and inhibits epithelial to mesenchymal transition.Citation29 The underlying mechanisms of how Notch regulate EPHB2 and EPHB4 and their relative contribution to SP pathway are still elusive. In our present study, we found that activation of Notch signaling pathway could downregulate EPHB2 transcriptionally and upregulate EPHB4 epigenetically via removing the H3K27me3 level on EPHB4 enhancer region. Taken together, Notch-induced dys-regulation of EPHB2 and EPHB4 could be developed as novel therapeutic targets in the serrated neoplasia pathway in CRC.
In conclusion, our study found the activation of Notch signaling pathway could decrease the EPHB2 expression and increase the EPHB4 expression, which could indicate that Notch pathway participate in SP pathway. Also, the ChIP assay showed that the enhancer region of EPHB4 harbored more JMJD3 as well as NICD in cells treated with hJAG-1 compared with control group, which indicated that Notch signaling pathway could regulate the EPHB4 expression epigenetically. Taken together, we provide a new mechanistic option in understanding the role of Notch signaling and the roles of EPHB2 and EPHB4 in the CRC; meanwhile, Notch-induced dysregulation of EPHB2 and EPHB4 could be developed as novel therapeutic targets in the serrated neoplasia pathway in CRC.
Acknowledgments
This study was supported by the National Science Foundation of Shandong Province (ZR2015HL083, CXL), the National Science Foundation of Shandong Province (ZR2014HQ072, HFL), and the Medicine and Health Science Technology Developing Program (2014WS0490, HFL). We thank our colleagues from the Binzhou Medical University Hospital, Binzhou Medical University, and Shandong University who provided insight and expertise that greatly assisted the research. We are also immensely grateful to the reviewers whose criticism and comments made our manuscript improved.
Supplementary material
Figure S1 Real time PCR data showed expressions of EPHB2 (A) and EPHB4 (B) in HD, MD, and PD CRC tissues from patients.
Abbreviations: HD, high differentiation; PD, poor differentiation; MD, medium differentiation.
Author contributions
All authors contributed to data analysis, drafting and revising the article, gave final approval of the version to be published, and agree to be accountable for all aspects of the work.
Disclosure
The authors report no conflicts of interest in this work.
References
- AokiHYamamotoETakasawaAEpigenetic silencing of SMOC1 in traditional serrated adenoma and colorectal cancerOncotarget2018944707472129435136
- SiegelRLMillerKDJemalACancer statistics, 2018CA Cancer J Clin201868173029313949
- WuSLiTMuQExpression of PI3Kp110α and PI3Kp110β in the colorectal conventional adenoma, serrated lesions and adenoma with canceration and their significanceInt J Clin Exp Pathol2015812160261603526884879
- SnoverDCUpdate on the serrated pathway to colorectal carcinomaHum Pathol201142111020869746
- LeggettBWhitehallVRole of the serrated pathway in colorectal cancer pathogenesisGastroenterology201013862088210020420948
- IjspeertJEVermeulenLMeijerGADekkerESerrated neoplasia-role in colorectal carcinogenesis and clinical implicationsNat Rev Gastroenterol Hepatol201512740140925963511
- BettingtonMLWalkerNIRostyCA clinicopathological and molecular analysis of 200 traditional serrated adenomasMod Pathol201528341442725216220
- VinsonKEGeorgeDCFenderAWBertrandFESigounasGThe Notch pathway in colorectal cancerInt J Cancer201613881835184226264352
- SikandarSSPateKTAndersonSNOTCH signaling is required for formation and self-renewal of tumor-initiating cells and for repression of secretory cell differentiation in colon cancerCancer Res20107041469147820145124
- PasqualeEBEphephrin bidirectional signaling in physiology and diseaseCell20081331385218394988
- LiXChoiWWYanRThe differential expression of EphB2 and EphB4 receptor kinases in normal bladder and in transitional cell carcinoma of the bladderPLoS One201498e10532625148033
- BatlleEBacaniJBegthelHEphB receptor activity suppresses colorectal cancer progressionNature200543570451126113015973414
- GuoDLZhangJYuenSTReduced expression of EphB2 that parallels invasion and metastasis in colorectal tumoursCarcinogenesis200627345446416272170
- KadifeEWareTMBLuworRBChanSTFNurgaliKSeniorPVEffects of EphB4 receptor expression on colorectal cancer cells, tumor growth, vascularization and compositionActa Oncol20185781043105629368976
- BurchfieldJSLiQWangHYWangRFJMJD3 as an epigenetic regulator in development and diseaseInt J Biochem Cell Biol20156714815726193001
- TokunagaRSakamotoYNakagawaSThe prognostic significance of histone lysine demethylase JMJD3/KDM6B in colorectal cancerAnn Surg Oncol201623267868526416711
- AustDEBarettonGBMembers of the Working Group GI-Pathology of the German Society of PathologySerrated polyps of the colon and rectum (hyperplastic polyps, sessile serrated adenomas, traditional serrated adenomas, and mixed polyps)-proposal for diagnostic criteriaVirchows Arch2010457329129720617338
- CuiMAwadallahALiuWZhouLXinWLoss of Hes1 differentiates sessile serrated adenoma/polyp from hyperplastic polypAm J Surg Pathol201640111311926448192
- KumarSRScehnetJSLeyEJPreferential induction of EphB4 over EphB2 and its implication in colorectal cancer progressionCancer Res20096993736374519366806
- SunLKeJHeZHES1 promotes colorectal cancer cell resistance to 5-Fu by inducing of EMT and ABC transporter proteinsJ Cancer20178142802280828928869
- KopanRIlaganMXThe canonical Notch signaling pathway: unfolding the activation mechanismCell2009137221623319379690
- GroenewegJWDigloriaCMYuanJInhibition of notch signaling in combination with paclitaxel reduces platinum-resistant ovarian tumor growthFront Oncol2014417125072022
- LeeJYSongSYParkJYNotch pathway activation is associated with pancreatic cancer treatment failurePancreatology2014141485324555978
- LinBLeeHYoonJGGlobal analysis of H3K4me3 and H3K27me3 profiles in glioblastoma stem cells and identification of SLC17A7 as a bivalent tumor suppressor geneOncotarget2015675369538125749033
- Al EmranAMarzeseDMMenonDRDistinct histone modifications denote early stress-induced drug tolerance in cancerOncotarget2018998206822229492189
- NtziachristosPTsirigosAWelsteadGGContrasting roles of histone 3 lysine 27 demethylases in acute lymphoblastic leukaemiaNature2014514752351351725132549
- ShenYYuDQiPWangXGuoXZhangACalcitriol induces cell senescence of kidney cancer through JMJD3 mediated histone demethylationOncotarget201785910018710019529245970
- WangJLiuLLongQDecreased expression of JMJD3 predicts poor prognosis of patients with clear cell renal cell carcinomaOncol Lett20171421550156028789379
- PereiraFBarbáchanoASilvaJKDM6B/JMJD3 histone demethylase is induced by vitamin D and modulates its effects in colon cancer cellsHum Mol Genet201120234655466521890490