
Abstract
Background
Hepatocellular carcinoma (HCC) is a major cause of cancer mortality and an increasing incidence worldwide; however, there are very few effective diagnostic approaches and prognostic biomarkers.
Materials and methods
One hundred forty-nine pairs of HCC samples from Gene Expression Omnibus (GEO) were obtained to screen differentially expressed genes (DEGs) between HCC and normal samples. The Kyoto Encyclopedia of Genes and Genomes (KEGG) pathway, Gene ontology enrichment analyses, and protein–protein interaction network were used. Cox proportional hazards regression analysis was used to identify significant prognostic DEGs, with which a gene expression signature prognostic prediction model was identified in The Cancer Genome Atlas (TCGA) project discovery cohort. The robustness of this panel was assessed in the GSE14520 cohort. We verified details of the gene expression level of the key molecules through TCGA, GEO, and qPCR and used immunohistochemistry for substantiation in HCC tissues. The methylation states of these genes were also explored.
Results
Ninety-eight genes, consisting of 13 upregulated and 85 downregulated genes, were screened out in three datasets. KEGG and Gene ontology analysis for the DEGs revealed important biological features of each subtype. Protein–protein interaction network analysis was constructed, consisting of 64 nodes and 115 edges. A subset of four genes (SPINK1, TXNRD1, LCAT, and PZP) that formed a prognostic gene expression signature was established from TCGA and validated in GSE14520. Next, the expression details of the four genes were validated with TCGA, GEO, and clinical samples. The expression panels of the four genes were closely related to methylation states.
Conclusion
This study identified a novel four-gene signature biomarker for predicting the prognosis of HCC. The biomarkers may also reveal molecular mechanisms underlying development of the disease and provide new insights into interventional strategies.
Introduction
Hepatocellular carcinoma (HCC) is the second leading cause of cancer mortality worldwide and the fourth highest cancer-related death in Chinese males, with a steady rise in the incidence every year.Citation1–Citation3 In recent years, the development of modern medicine and the combined use of various therapeutic strategies (surgical resection, ablation, or liver transplantation) have improved the HCC patient’s outcomes,Citation4 but the overall 5-year survival rate is still unsatisfactory.Citation5,Citation6 Therefore, there is an urgent need to better understand the pathogenesis and progression in HCC and to find useful biomarkers for diagnosis and prognosis.
Tumorigenesis and cancer development are closely associated with genomic instability.Citation7 Like other cancers, HCC is considered as a heterogeneous disease with various gene aberrations and complex altered multipathways.Citation8 However, the precise molecular mechanisms underlying HCC progression are not thoroughly elucidated. Therefore, it is necessary to investigate the abnormal target molecules and new molecular mechanisms based on genomic instability, which could help in developing individualized strategies for the diagnosis and therapy of HCC. Genomic instability can be categorized into chromosomal instability, microsatellite instability, or significantly heightened levels of mutations at the nucleotide level, all of which can contribute to the development of cancer.Citation9 With the advances in next-generation sequencing technology, numerous genetic alterations have been revealed, following understanding of the well-characterized chromosomal instability pathway. Furthermore, a variety of pathways are related to the progression and metastasis of HCC, such as the RalA signaling pathway,Citation10 FGFR4 signaling pathway,Citation11 and Rac signaling pathway,Citation12,Citation13 has been reported. Meanwhile, several biomarkers for diagnosis and treatment have been revealed.Citation14–Citation16 Some of the biomarkers contribute to understanding the pathogenesis of HCCCitation17 or prognosticate the patients’ survival time.Citation16,Citation18 However, HCC is a heterogeneous disease with complex molecular mechanisms; thus, the occurrence and development of HCC are the result of mutations in multiple genes.Citation19 Gene expression analysis can be used for profiling tumors and predicting their prognosis. Dysregulated genes in the genome between tumors and normal tissues have been verified as promising tool to classify diagnostic and prognostic biomarkers, as well as being therapeutic targets. With limited success achieved when focusing on a single protein or gene mutation, a multigene combination analysis may be more accurate to describe the molecular mechanisms of HCC.
Emerging information has shifted emphasis from specific gene sequences to mRNA and ultimately to proteins – the “central dogma of molecular biology.” RNA modifications are important mechanisms for controlling multiple aspects of RNA biochemistry and cellular function.Citation20 The level of gene expression is associated with high DNA methylation,Citation21 and methylation of genes is an important cause of human phenotypic variation. Genomic alterations are hallmarks of many types of diseases, and DNA methylation is an epigenetic modification that is important in cancer development.Citation22,Citation23 In the past two decades, the potential use of DNA methylation as biomarkers for cancer diagnosis has received attention.Citation24
In general, disease-free survival or relapse-free survival has been used to determine the validity of putative biomarkers of prognosis. However, because the overall survival (OS) is considered to be the ultimate detection standard of therapeutic benefits, a more accurate prognostic assessment model based on patients’ OS is needed. Our findings provided a valid indicator for predicting the prognosis using datasets and bioinformatics analysis.
In this study, we performed univariate and multivariate survival analyses to identify a prognostic signature for OS of HCC based on the intersection of differentially expressed genes (DEGs) and clinical data from The Cancer Genome Atlas (TCGA). A four-gene signature was established by building a reliable likelihood-based survival model. Importantly, the prognostic value of this four-gene signature was evaluated and verified by another HCC gene expression dataset from Gene Expression Omnibus (GEO).
Materials and methods
Patients
One hundred HCC patients were recruited in this study that was approved by the Institutional Ethical Committee of the First Affiliated Hospital of Zhengzhou University, China, and is in accordance with the precepts established by the Declaration of Helsinki. All patients gave written informed consent. Fifty fresh tissues and adjacent normal liver tissues were collected from patients with untreated stage I to stage IV HCC between September 2016 and April 2018. Fifty formalin-fixed paraffin-embedded HCC tissue samples from the same institution were collected between November 2012 and September 2014 to examine SPINK1, TXNRD1, LCAT, and PZP expression at protein level.
Data study
Three mRNA expression datasets were downloaded from the GEO (https://www.ncbi.nlm.nih.gov/geo/), with the accession number of GSE57957, GSE64041, and GSE76427, including 37, 60, and 52 paired HCC tissue samples, respectively, used for discovering DEGs. Unpaired samples were removed.
Another transcriptional level data of HCC samples with clinical data for the screening of prognostic signature were obtained from TCGA (https://tcga-data.nci.nih.gov/). We used GEO (https://www.ncbi.nlm.nih.gov/geo/) with the accession number of GSE14520 (242 HCC samples with detailed clinical data) to verify the risk model. Methylation data were downloaded from the TCGA website.
All the tumor tissue samples and nontumor tissue samples were analyzed by the following methods.
Identification of differential expression genes
To identify DEGs between HCC and adjacent normal tissues, R (version 3.5.1, Auckland, New Zealand) was used to apply significance analysis of microarray with limma version 3.34.8 (http://www.bioconductor.org/packages/release/bioc/html/limma.html) packageCitation25 in these three GEO datasets consisting of GSE57957, GSE64041, and GSE76427. The DEGs in HCC samples compared with adjacent normal tissues were obtained with the thresholds of absolute log2-based fold change (log2FC)>1 and adjusted P-value <0.05. We also analyzed the DEGs in these datasets by Venn analysis and found the intersection genes screened out in all three datasets.
Annotation of DEGs
We used gene oncology and KEGG pathway enrichment (https://www.kegg.jp/) methods to analyze the overlapping upregulated and downregulated differential expression genes, respectively. The online tool DAVID (http://david.abcc.ncif-crf.gov/)Citation26 was used to analyze and annotate the genes. All biological characteristics were listed. P<0.05 was considered the level of statistical significance.
Protein–protein interaction (PPI) network
We used an online database (http://string.embl.de/) to construct a PPI network of DEGs and analyze the functional interactions between proteins. Confidence score >0.7 was considered of great significance. Subsequently, we used Cytoscape software (3.5.1) to visualize the results done by the tool online.Citation27
Survival analysis
To analyze the correlation between OS and gene expression, we used the Kaplan–Meier method. The statistical significance of OS was determined with the log-rank test based on the χ2 distribution. Survival analysis and the survival curve were performed with R. The samples with top and bottom expression levels were grouped high and low according to the cutoff point, respectively.
Prognostic index model
Multivariate Cox survival analysis was used to create the prognostic index model for HCC patients. This analytical method is based on the importance of score assigned to each gene. To create the Cox regression model, we calculated the risk score for each patient based on the individual gene expression levels of the screened genes. Then, the formula of this prognostic index model was completed, as follow, prognostic index (PI)=0.06324 × relative expression of SPINK1 + 0.18856 × relative expression of TXNRD1 + (−0.15727) × relative expression of LCAT + (−0.098) × relative expression of PZP. The relative expression value was defined as follows: score 1, < cutoff value; score 2, > cutoff value.
RNA isolation and quantitative real-time PCR
Total mRNA from HCC tissues was extracted with TRIzol reagent (Takara Bio, Kusatsu, Japan), and RNA was reverse transcribed with PrimeScript RT Reagent Kit (Takara Bio, Otsu, Shiga, Japan). Subsequently, expression levels of genes were quantified by qRT-PCR with SYBR Green qPCR Master Mix (Roche, Mannheim, Germany), with the housekeeping gene GAPDH used to normalize gene expression. The 2−ΔΔCt method was used to calculate the gene expression changes. The sequence of PCR primers used in this study is given in .
Immunohistochemistry (IHC)
Detection of SPINK1, TXNRD1, LCAT, and PZP protein expression was carried out on human HCC sections with IHC staining as described. Results of IHC staining were evaluated and scored by two individuals. Proportion of stained tumor cells was graded as follows: 0 (no positive tumor cells), 1 (<25% positive tumor cells), 2 (26%–50% positive tumor cells), 3 (51%–75% positive tumor cells), and 4 (>76% positive tumor cells). Scores for the intensity of staining were shown as follows: 0 (negative), 1 (weak), 2 (moderate), and 3 (strong). Staining index (SI) was calculated as staining intensity × proportion of positive tumor cells, resulting in scores of 0, 1, 2, 3, 4, 6, 8, 9, and 12. When SI score was ≥6, the tissue was considered high expression, and an SI score ≤4 was considered low expression.
Statistical analysis
All data analyses were carried out with Prism 6.0 (Graph-Pad, San Diego, CA, USA) or R (version 3.5.1). Data were expressed as mean ± SD, and univariate and multivariate analyses were performed with the Cox proportional hazards regression model. Student’s t-test was performed to analyze the differences between two groups. The Kaplan–Meier method was used to establish survival curves, and the survival differences were compared using the log-rank test. Differences were considered statistically significant for P<0.05 (*P<0.05; **P<0.01; ***P<0.001; ****P<0.0001).
Results
Flow chart of this work
Significance and Venn analysis were performed with R to identify DEGs. We categorized 98 DEGs (13 upregulated genes and 85 downregulated genes) in gene oncology, KEGG, and PPI analyses by using Kaplan–Meier method and Cox regression to identify a four-gene signature that could predict OS for HCC patients according to clinical data from TCGA database. To further evaluate the performance of this gene signature, another GEO cohort (GSE14520) was validated. Finally, we analyzed the key four-gene expression in TCGA, GSE14520, and clinical samples. Methylation analysis, which might display the potential mechanism of regulating expression of those genes, was used ().
Figure 1 Flowchart of bioinformatics analysis.
Abbreviations: DEGs, differentially expressed genes; GEO, Gene Expression Omnibus; KEGG, Kyoto Encyclopedia of Genes and Genomes; PPI, protein–protein interaction; TCGA, The Cancer Genome Atlas project.

Identification of differential expression genes
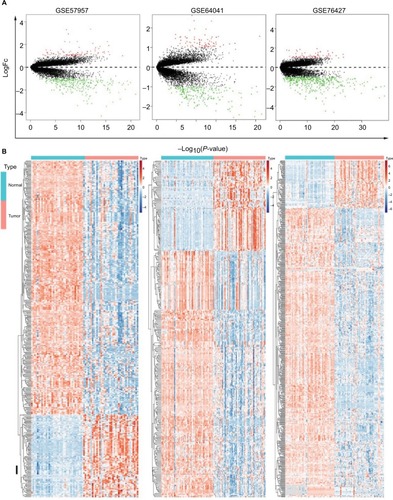
The genes significantly dysregulated in HCC were identified based on the three GEO datasets, with unpaired samples removed. Based on analysis of these three independent cohorts, 397, 298, and 482 DEGs were demonstrated from GSE57957, GSE64041, and GSE76427 datasets, respectively (). In addition, we identified all the DEGs that could differentiate HCC from the adjacent normal tissues in each independent dataset, using hierarchical clustering ().
Figure 2 Identification of DEGs in HCC-mRNA expression profiling datasets.
Notes: (A) Volcano plot of DEGs in datasets GSE57957, GSE64041, and GSE76427. (B) Cluster analysis of DEGs in these three GEO datasets.
Abbreviations: DEGs, differentially expressed genes; FC, fold change; GEO, Gene Expression Omnibus; HCC, Hepatocellular carcinoma.
Gene oncology and KEGG pathway enrichment analysis for the intersection genes
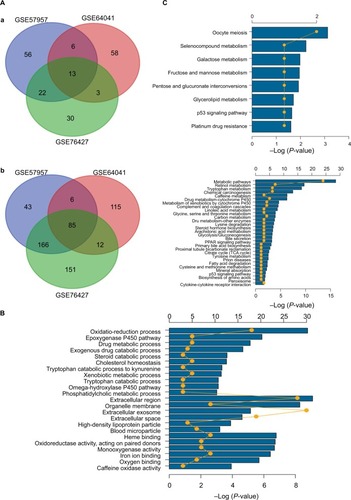
Given the abundant DEGs and the muddled data, we wished to find common rules in the three different datasets. First, in GSE57957, GSE64041, and GSE76427 datasets, we divided all the DEGs into upregulated genes and downregulated genes compared with genes in adjacent normal tissues. We then overlapped the upregulated DEGs from the three different datasets and found that there were 13 upregulated genes in all datasets; 85 genes were screened out in the downregulated DEGs (). To further investigate the characteristics of identified DEGs, we used gene oncology and KEGG pathway enrichment methods to analyze the intersection DEGs. No terms were obtained from upregulated genes for the limited numbers of genes. While we observed that the 85 downregulated genes mainly enriched in biological processes associated with the oxidation–reduction process () and most of the genes were located in extracellular region (). Moreover, we had some different findings when performing KEGG pathway enrichment analysis; the 13 upregulated DEGs were mainly related to oocyte meiosis (), and the downregulated DEGs were most strongly correlated with metabolic pathways. And retinol metabolism, tryptophan metabolism, and chemical carcinogenesis also had great significance, which were consistency with analyzing by gene oncology annotation (). With the help of KEGG pathway enrichment (https://www.kegg.jp/), we mapped the regulatory network of genes with significant differences ().
Figure 3 Gene oncology and KEGG pathway enrichment analysis of intersection mRNAs.
Notes: (A) Venn diagram analysis of DEGs in comparison groups (a) upregulated DEGs and (b) downregulated DEGs. (B) Gene oncology analysis of downregulated intersection DEGs. (C) KEGG pathway enrichment analysis of upregulated and downregulated intersection DEGs.
Abbreviations: DEGs, differentially expressed genes; KEGG, Kyoto Encyclopedia of Genes and Genomes.
PPI network analysis
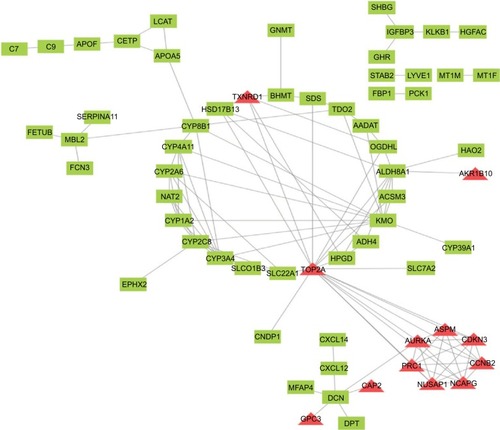
To find the correlation between the corresponding proteins encoded by DEGs, we constructed a PPI network of DEGs, including 85 downregulated genes and 13 upregulated genes (). We found that there were 64 nodes and 115 edges in the PPI network (average node degree of 3.58 and average local clustering coefficient = 0.285), and the functional enrichment in this kind of PPI network was similar to gene oncology and KEGG pathway enrichment analysis, which indicates that these genes may play a role not only at the mRNA level but also at the protein level.
Figure 4 PPI network of DEGs. Red means upregulated genes and green indicates downregulated genes.
Abbreviations: DEGs, differentially expressed genes; PPI, protein–protein interaction.
Construction of the DEG-based prognostic signature
To further investigate these differential expression genes in identification value and the risk implications of HCC and to guide the subsequent effective treatment for patients as well, we sought to determine which genes could differentiate high-risk from low-risk HCC patients. Most of the previous studies suffered from a lack of systematical evaluation because a single biomarker gene for prognosis may lack sensitivity and specificity. None of the genes or proteins function alone but form a network through interaction. Therefore, we used Cox regression analysis to search for a model that could predict the risk of HCC accurately.
First, we performed univariate Cox regression analysis of the DEGs individually to find which genes were associated with survival. Twenty-nine genes were correlated with prognosis (). Furthermore, to better understand which of the 29 candidate genes are more critical in evaluation of clinical outcome, multivariate Cox regression analysis was performed using a forward conditional method based on the results of univariate analysis. Only four genes were identified (): serine peptidase inhibitor Kazal type 1 (SPINK1), thioredoxin reductase 1 (TXNRD1), lecithin-cholesterol acyltransferase (LCAT), and alpha-2-macroglobulin like (PZP). Based on the estimated Cox regression coefficient, we then established a prognostic risk model. The risk score formula was as follows: risk score = 0.06324 × relative expression of SPINK1 + 0.18856 × relative expression of TXNRD1 + (−0.15727) × relative expression of LCAT + (−0.098) × relative expression of PZP.
Table 1 Univariate Cox regression analysis: P<0.05
Table 2 Coefficients of the four-gene signature for the risk score
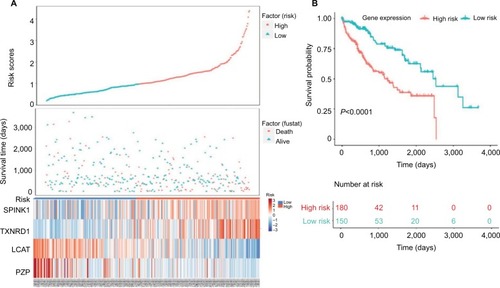
Next, we used Kaplan–Meier survival analysis to evaluate the prognostic impact of model on both the low-risk and high-risk groups. We found that the association between risk score and survival time of HCC patients was statistically significant, with the low-score patients (n=150) showing a substantial advantage in OS time compared with the high-score group patients (n=180) (). Patients with a high-risk score had a significantly increased risk of death. To explore the relationship among these survival-related genes with the risk scores and the true contributions of these genes to the HCC, we performed cluster analysis of every patient’s genes according to their risk scores, as the heat map shown in . Results indicated that SPINK1 and TXNRD1 were augmented in the high-risk score group. While LCAT and PZP mainly contributed to the low-risk scores. It is very easy to verify this conclusion from the risk prediction formula. These results independently predicted the oncogene role of SPINK1 and TXNRD1. In contrast, LCAT and PZP may serve as cancer suppressor gene.
Figure 5 Four-gene signature prognostic risk scoring model analysis of HCC patients’ prognosis in TCGA dataset.
Notes: (A) Distribution of patients’ survival status and four prognostic DEGs’ expression heat map in low-risk and high-risk groups. (B) Kaplan–Meier survival curves for low-risk and high-risk groups.
Abbreviations: DEGs, differentially expressed genes; HCC, hepatocellular carcinoma; TCGA, The Cancer Genome Atlas project.
Validation of the four-gene risk prediction model in GEO dataset
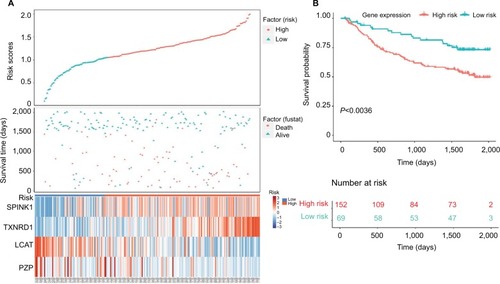
To verify the risk prediction model, we tested this model in the validation cohort. Another microarray dataset GSE14520Citation28 was acquired, which included detailed gene expression information and survival time of HCC patients from the GEO database. The visual diagram and the heat map of the contribution of each gene are illustrated in . The risk scores of every patient were calculated, and the high-risk scores predicted by our model (n=152) were significantly worse than those of low-risk scores (n=69) (). These results were further evidence that we had established a risk prediction model.
Figure 6 Validation of four-gene signature prognostic risk scoring model of HCC patients in GSE14520 dataset.
Notes: (A) Distribution of patients’ survival status and four prognostic DEG expression heat map in low-risk and high-risk groups. (B) Kaplan–Meier survival curves for low-risk and high-risk groups.
Abbreviations: DEGs, differentially expressed genes; HCC, hepatocellular carcinoma.
Identification of target genes expression
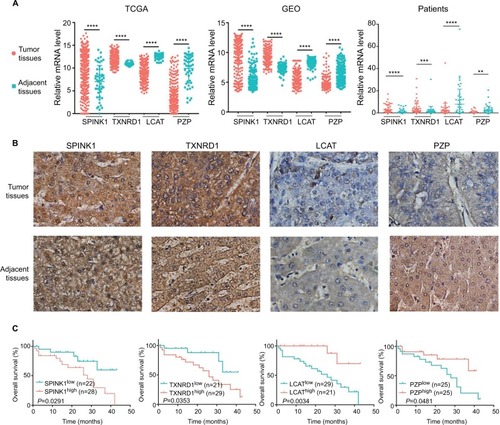
To confirm that the expression trends of SPINK1, TXNRD1, LCAT, and PZP were of identical in TCGA, GEO (GSE14520) databases and tumor tissues of HCC patients. We detected the differential expression of the four genes in tumor tissues and adjacent tissues. We found that SPINK1 and TXNRD1 were highly expressed in tumor tissues, whereas the expression of LCAT and PZP was significantly decreased in tumor tissues of HCC patients compared with nontumor tissues (). These results were further verified by IHC analysis in HCC patients’ samples, which revealed that SPINK1 and TXNRD1 protein are highly expressed, whereas LCAT and PZP are expressed at low levels in primary tumor cells of HCC patients (). In a set of 50 HCC patients for whom OS data were available, patients with higher SPINK1 or TXNRD1 protein expression had shorter OS than did those with lower expression. And in tumor tissues, the higher LCAT or PZP protein expression had longer OS (). Taken together, these data suggest that SPINK1 and TXNRD1 are upregulated, while LCAT and PZP are reduced in tumor tissues. The expression of SPINK1 or TXNRD1 protein is negatively correlated with prognosis, and LCAT or PZP is positively correlated with prognosis.
Figure 7 The expression of SPINK1, TXNRD1, LCAT, and PZP in gene and protein levels.
Notes: (A) Relative mRNA levels of SPINK1, TXNRD1, LCAT, and PZP expression in TCGA, GSE14520 dataset, and human liver tumor tissues and adjacent normal tissues in patients (n=50). (B) Immunohistochemistry staining of HCC specimens with antibodies specific for SPINK1, TXNRD1, LCAT, or PZP. Original magnification, ×200. (C) Kaplan–Meier analysis of overall survival was stratified by expression levels of SPINK1, TXNRD1, LCAT, and PZP protein expression. **P<0.01, ***P<0.001, ****P<0.0001.
Abbreviations: GEO, Gene Expression Omnibus; HCC, hepatocellular carcinoma; TCGA, The Cancer Genome Atlas project.
Methylation of the four prognostic genes
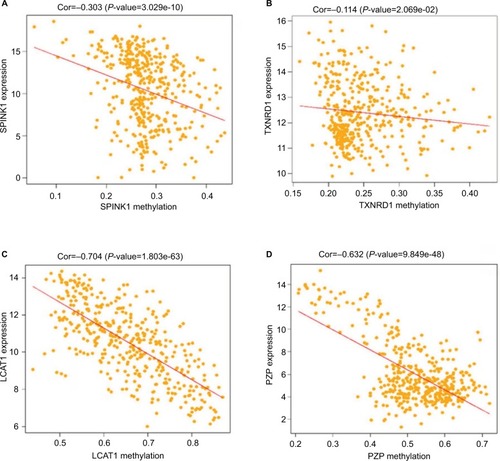
As previous copious literature published, aberrant DNA methylation in gene promoter regions plays a crucial role in the pathogenesis of cancer.Citation29,Citation30 To better understand this concept, we analyzed the relationship between the four prognostic genes and methylation. We found that the expression of the genes was significantly negatively correlated with their methylation () except for TXNRD1, which had only a trend toward negative correlation (). As methylation is important in hepatocellular carcinogenesis, we want to determine which characteristics of the HCC are associated with the four key genes. Thus, we analyzed these data in MEXPRESS (http://mexpress.be/)Citation31 and found that the methylation of SPINK1 correlated with sample type (). Therefore, we divided the HCC into three sample types: primary solid tumor, normal solid tissue, and recurrent solid tumor. And we found that the methylation of SPINK1 had the strongest correlation with normal solid tissue and recurrent solid tumor, which had higher degree of malignancy than did primary solid tumor. We then analyzed the other three genes in the same way. The methylation of TXNRD1 was mainly correlated with patients’ ages at the time of diagnosis of HCC and Ishak fibrosis score (), and the methylation of PZP also had strong relation with sample type (). As we had documented above, this kind of oncogene was mainly associated with the less malignant type, ie, primary solid tumor, while the methylation of LACT contributes to the pathological stage (). These data confirmed that methylation was of great importance in hepatocellular carcinogenesis in different ways.
Figure 8 Correlation analysis between the expression of SPINK1, TXNRD1, LCAT, and PZP and their methylation.
Notes: (A) The correlation analysis between SPINK1 and methylation. (B) The correlation analysis between TXNRD1 and methylation. (C) The correlation analysis between LCAT and methylation. (D) The correlation analysis between PZP and methylation.
Abbreviations: Cor, correlation; TCGA, The Cancer Genome Atlas project.
Discussion
HCC is a major contributor to both cancer incidence and mortality, with >700,000 new cases per year.Citation32 Surgical resection, liver transplantation, and ablation by radiofrequency or ethanol injection are now conventional therapies at early disease stages. With these options, survival at 5 years ranges between 50% and 70%.Citation33 The 5-year survival rates for patients with HCC undergoing surgery are low because a large proportion of tumors are unresectable or have already metastasized before diagnosis. This study achieved its goal of finding a valid indicator for predicting the prognosis of HCC, using bioinformatics analysis.
Biomarkers not only serve as accurate tools in cancer prognostication but also have implications for measuring treatment responses, surveilling tumor recurrence, and guiding clinical decision making.Citation34 For selecting suitable therapies and improving prognosis, it is important to find accurate targets that can predict survival. Over the past decades, in-depth analysis of databases to find potential genes for prognosis prediction has been widely used in the management of tumors, such as colon cancer,Citation35,Citation36 lung cancer,Citation37,Citation38 and glioma.Citation39 In HCC, gene expression-based signatures for prognosis prediction have been investigated in many studies, and numerous genetic alterations have been revealed. In this article, a six-gene-based prognostic signature for HCC OS prediction had been demonstrated.Citation32 By performing bioinformatics analysis, 106 DEGs and 21 differentially expressed miRNAs were identified in HCC.Citation40 Based on TCGA database, a three-gene prognostic signature composing of three genes UPB1, SOCS2, and RTN3 had been reported.Citation41 Reuse data have the potential to predict treatment response and disease progression and facilitate the development of precise therapies.Citation42 However, the advantage of this study was that mRNA expression profiles were performed in numerous paired HCC samples from three GEO datasets; more precise DEGs were discovered. Next, by establishing gene oncology, KEGG, and PPI analysis, we provided detailed and comprehensive descriptions of the functional enrichment analysis of these DEGs. Then, according to clinical data from TCGA, the optimum combination of four prognostic genes was investigated. Furthermore, we used another GEO dataset to test the SPINK1, TXNRD1, LCAT, and PZP expression-based prognostic signature to predict HCC clinical outcome. We constructed a more accurate four-gene signature prognostic model and conducted a comprehensive and complete validation. Moreover, because there are few published bioinformatics analyses combining gene expression and methylation profile, we examined the relationship of changes in screened DEG expression and DNA methylation. Finding changes in those genes’ methylation profile influenced the development of HCC. More precise targets and comprehensively annotated possible mechanisms for regulating these biomarkers are given in this article. Therefore, the four-gene signature is promising therapeutic targets and biomarkers that could enhance the clinical responses and the accurate judgment of HCC prognosis.
In this study, three GEO datasets about HCC tissues were used and 98 DEGs were identified by bioinformatics analysis, consisting of 13 upregulated genes and 85 downregulated genes. By performing KEGG analysis, results showed that the upregulated genes were mainly involved in biological processes associated with oocyte meiosis and selenocompound metabolism processes, while the downregulated genes were primarily enriched in metabolic pathways, retinol metabolism, and tryptophan metabolism. The gene oncology term enrichment showed that the downregulated DGEs were involved in those biological processes such as oxidation–reduction process and P450 epoxygenase pathway. And most of the genes were located in extracellular regions. We constructed a PPI to find the correlation between the corresponding proteins encoded by DEGs. Through varieties in analytical methods and means, we have more fully annotated the function of these differential genes, which may help to understand the development of liver cancer.
Currently, age and TNM stage, especially TNM stage, are considered important predictors of survival in HCC patients. However, during clinical treatment, we can find that patients with the same TNM stage may have different prognosis. Therefore, we are committed to pursuing the biomarkers that more precisely predict the prognosis of HCC and consequently improved personalized cancer treatment. For this purpose, we further narrowed down the gene size among these meaningful DEGs and selected an optimal four-gene signature (SPINK1, TXNRD1, LCAT, and PZP) for prognosis prediction. High SPINK1 expression in HCC tumor tissue was significantly associated with increasing risk of death.Citation43 Similar results were also validated by other researchers and concluded that SPINK1 may be a novel prognostic biomarker of HCC.Citation44 TXNRD1 was overexpressed in HCC tissues and cells, and its level was increased with increasing clinical stage.Citation45,Citation46 LACT plays an important role in many cancers, such as Hodgkin lymphoma,Citation47 ovarian cancer,Citation48 and breast cancer.Citation49 Plasma LCAT activity was associated with nonalcoholic fatty liver disease,Citation50 whereas in the tissues PZP was downregulated.Citation51 Others have reported that PZP impacts methylation of H3K79,Citation52 chromatin dynamics, and acetylation.Citation53 However, none of studies on liver cancer has reported the function of LCAT and PZP genes previously. We first combined these four genes to analyze finding that they might be oncogenes or tumor suppressor genes. It has been reported that the potential use of DNA methylation marks as biomarkers for cancer diagnosis. We found that differential expression of SPINK1, TXNRD1, LCAT, and PZP among patients was related to methylation of the gene. Therefore, this four-gene signature is a promising therapeutic target and biomarker that could enhance the clinical responses and the accuracy of HCC prognosis prediction. We have developed an accurate risk score model for HCC prognosis prediction based on the expression of four genes, and their functions need further investigation.
In this work, the predictive signature that comprises SPINK1, TXNRD1, LCAT, and PZP was validated in another independent datasets on a different platform and showed that it has more accurate prediction of survival. Although this model performs well in HCC prognosis prediction, due to the limitation of the number of cohorts, our finding needs to be evaluated against larger datasets. We established a prognostic signature for HCC OS prediction through combined analysis of gene expression datasets from TCGA and GEO. It is more accurate to predict the prognosis of HCC patients. The methods used in this study may be also suitable for other types of cancers.
Conclusion
Overall, based on network and module analysis of mRNA expression data, we constructed a novel four-gene expression signature for prediction of prognosis in HCC. These findings could advance the accuracy of diagnosis and prognosis and might aid in the development of targeted therapy for HCC.
Acknowledgments
We appreciate Dr Xinwei Wang (Center for Cancer Research, National Cancer Institute, USA) for sharing GSE14520 dataset clinical data with us. This study was supported by the First Affiliated Hospital of Zhengzhou University Youth Innovation Fund Project (YNQN2017136).
Supplementary materials
Figure S1 Gene ontology enrichment terms for DEGs.
Abbreviations: DEGs, differentially expressed genes; FC, fold change; GO, gene ontology.
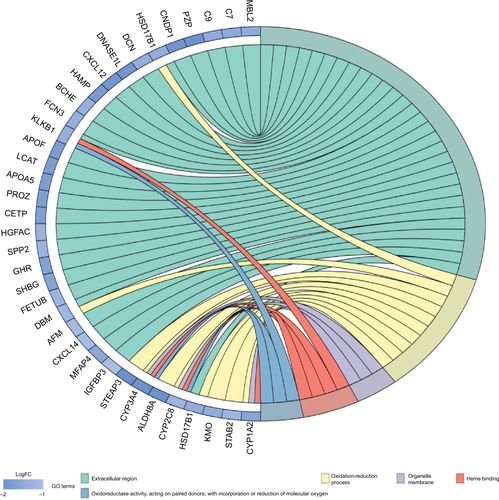
Figure S2 KEGG network analysis.
Abbreviation: KEGG, Kyoto Encyclopedia of Genes and Genomes.
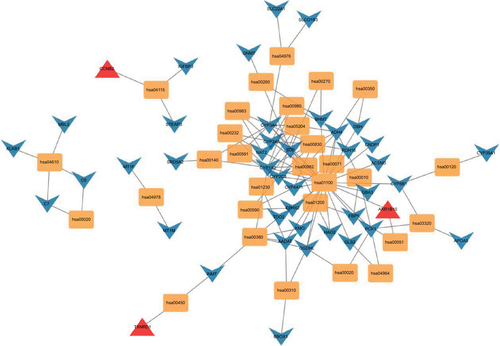
Figure S3 Detailed methylation information of (A) SPINK1, (B) TXNRD1, (C) LCAT, and (D) PZP.
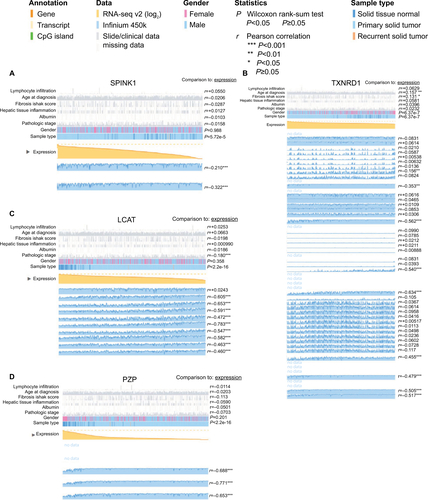
Table S1 The sequence of PCR primers
Author contributions
YY and LA participated in the study concept and design. YZ, YL, and CS helped in coordination and helped to draft the manuscript. YZ and YL contributed to the clinical sample collection. YY, SZ, and ZZ performed the data analysis. YZ and YL conducted the experiments. All authors contributed to data analysis, drafting and revising the article, gave final approval of the version to be published, and agree to be accountable for all aspects of the work.
Disclosure
The authors report no conflicts of interest in this work.
References
- MaluccioMCoveyARecent progress in understanding, diagnosing, and treating hepatocellular carcinomaCA Cancer J Clin201262639439923070690
- LiZZhangHHanJChenYLinHYangTSurface nanopore engineering of 2D MXenes for targeted and synergistic multitherapies of hepatocellular carcinomaAdv Mater20183025e170698129663543
- ChenWZhengRBaadePDCancer statistics in China, 2015CA Cancer J Clin201666211513226808342
- RazaASoodGKHepatocellular carcinoma review: current treatment, and evidence-based medicineWorld J Gastroenterol201420154115412724764650
- ByamJRenzJMillisJMLiver transplantation for hepatocellular carcinomaHepatobiliary Surg Nutr201321223024570911
- FrenetteCGishRTargeted systemic therapies for hepatocellular carcinoma: clinical perspectives, challenges and implicationsWorld J Gastroenterol201218649850622363115
- ChenZHYuYPZuoZHTargeting genomic rearrangements in tumor cells through Cas9-mediated insertion of a suicide geneNat Biotechnol201735654355028459452
- SanyalAJYoonSKLencioniRThe etiology of hepatocellular carcinoma and consequences for treatmentOncologist201015Suppl 4142221115577
- NegriniSGorgoulisVGHalazonetisTDGenomic instability – an evolving hallmark of cancerNat Rev Mol Cell Biol201011322022820177397
- EzzeldinMBorrego-DiazETahaMRalA signaling pathway as a therapeutic target in hepatocellular carcinoma (HCC)Mol Oncol2014851043105324785097
- HagelMMiduturuCSheetsMFirst selective small molecule inhibitor of fgfr4 for the treatment of hepatocellular carcinomas with an activated FGFR4 signaling pathwayCancer Discov20155442443725776529
- YueXAiJXuYPolymeric immunoglobulin receptor promotes tumor growth in hepatocellular carcinomaHepatology20176561948196228073159
- DelireBStärkelPThe Ras/MAPK pathway and hepatocarcinoma: pathogenesis and therapeutic implicationsEur J Clin Invest201545660962325832714
- LiuYSongCNiHUBE2L3, a susceptibility gene that plays oncogenic role in hepatitis B related hepatocellular carcinomaJ Viral Hepat201825111363137129969176
- HanHHQiuYJShiYYGlypican-3-targeted precision diagnosis of hepatocellular carcinoma on clinical sections with a supramolecular 2D imaging probeTheranostics20188123268327429930728
- TsuchiyaNSawadaYEndoISaitoKUemuraYNakatsuraTBiomarkers for the early diagnosis of hepatocellular carcinomaWorld J Gastroenterol20152137105731058326457017
- SangLWangXMXuDYZhaoWJBioinformatics analysis of aberrantly methylated-differentially expressed genes and pathways in hepatocellular carcinomaWorld J Gastroenterol201824242605261629962817
- JiFZhangZHZhangYLow expression of c-Myc protein predicts poor outcomes in patients with hepatocellular carcinoma after resectionBMC Cancer201818146029690860
- SingalAGEl-SeragHBHepatocellular carcinoma from epidemiology to prevention: translating knowledge into practiceClin Gastroenterol Hepatol201513122140215126284591
- Boriack-SjodinPARibichSCopelandRARNA-modifying proteins as anticancer drug targetsNat Rev Drug Discov201817643545329773918
- YouJSJonesPACancer genetics and epigenetics: two sides of the same coin?Cancer Cell201222192022789535
- LairdPWThe power and the promise of DNA methylation markersNat Rev Cancer20033425326612671664
- KochAJoostenSCFengZAnalysis of DNA methylation in cancer: location revisitedNat Rev Clin Oncol201815745946629666440
- DelpuYCordelierPChoWCTorrisaniJDNA methylation and cancer diagnosisInt J Mol Sci2013147150291505823873296
- DibounIWernischLOrengoCAKoltzenburgMMicroarray analysis after RNA amplification can detect pronounced differences in gene expression using limmaBMC Genomics2006725217029630
- Huang daWShermanBTLempickiRASystematic and integrative analysis of large gene lists using DAVID bioinformatics resourcesNat Protoc200941445719131956
- BaderGDHogueCWAn automated method for finding molecular complexes in large protein interaction networksBMC Bioinformatics20034212525261
- RoesslerSJiaHLBudhuAA unique metastasis gene signature enables prediction of tumor relapse in early-stage hepatocellular carcinoma patientsCancer Res20107024102021021221159642
- GalmOHermanJGBaylinSBThe fundamental role of epigenetics in hematopoietic malignanciesBlood Rev200620111316426940
- WeisenbergerDJVelicescuMPreciado-LopezMAIdentification and characterization of alternatively spliced variants of DNA methyltransferase 3a in mammalian cellsGene20022981919912406579
- KochADe MeyerTJeschkeJVan CriekingeWMEXPRESS: visualizing expression, DNA methylation and clinical TCGA dataBMC Genomics20151663626306699
- WangZTengDLiYHuZLiuLZhengHA six-gene-based prognostic signature for hepatocellular carcinoma overall survival predictionLife Sci2018203839129678742
- BruixJLlovetJMMajor achievements in hepatocellular carcinomaLancet2009373966461461619231618
- WongKFXuZChenJLeeNPLukJMCirculating markers for prognosis of hepatocellular carcinomaExpert Opin Med Diagn20137431932923642136
- ChenHSunXGeWQianYBaiRZhengSA seven-gene signature predicts overall survival of patients with colorectal cancerOncotarget2017856950549506529221110
- XieXJLiuPCaiCDZhuangYRZhangLThe generation and validation of a 20-Genes model influencing the prognosis of colorectal cancer20171181136753685
- LiuWTWangYZhangJA novel strategy of integrated microarray analysis identifies CENPA, CDK1 and CDC20 as a cluster of diagnostic biomarkers in lung adenocarcinomaCancer Lett2018425435329608985
- GyőrffyBSurowiakPBudcziesJLánczkyAOnline survival analysis software to assess the prognostic value of biomarkers using transcriptomic data in non-small-cell lung cancerPLoS One2013812e8224124367507
- LuGChangJTLiuZChenYLiMZhuJJPhospholipase C Beta 1: a candidate signature gene for proneural subtype high-grade gliomaMol Neurobiol20165396511652526614510
- ZhouLDuYKongLZhangXChenQIdentification of molecular target genes and key pathways in hepatocellular carcinoma by bioinformatics analysisOnco Targets Ther2018111861186929670361
- LiBFengWLuoODevelopment and validation of a three-gene prognostic signature for patients with hepatocellular carcinomaSci Rep201771551728717245
- KannanLRamosMReAPublic data and open source tools for multi-assay genomic investigation of diseaseBrief Bioinform201617460361526463000
- YingHYGongCJFengYJingDDLuLGSerine protease inhibitor Kazal type 1 (SPINK1) downregulates E-cadherin and induces EMT of hepatoma cells to promote hepatocellular carcinoma metastasis via the MEK/ERK signaling pathwayJ Dig Dis201718634935828544403
- MarshallALukkMKutterCDaviesSAlexanderGOdomDTGlobal gene expression profiling reveals SPINK1 as a potential hepatocellular carcinoma markerPLoS One201383e5945923527199
- FuBMengWZengXZhaoHLiuWTXNRD1 is an unfavorable prognostic factor for patients with hepatocellular carcinomaBiomed Res Int20172017469816728536696
- RieswijkLClaessenSMBekersOAflatoxin B1 induces persistent epigenomic effects in primary human hepatocytes associated with hepatocellular carcinomaToxicology20163503523139
- CookeALMorrisJMelchiorJTA thumbwheel mechanism for APOA1 activation of LCAT activity in HDLJ Lipid Res20185971244125529773713
- RussellMRGrahamCD’AmatoAA combined biomarker panel shows improved sensitivity for the early detection of ovarian cancer allowing the identification of the most aggressive type II tumoursBr J Cancer2017117566667428664912
- SubbaiahPVLiuMWittTRImpaired cholesterol esterification in the plasma in patients with breast cancerLipids19973221571629075205
- NassKJvan den BergEHGruppenEGDullaartRPFPlasma lecithin:cholesterol acyltransferase and phospholipid transfer protein activity independently associate with nonalcoholic fatty liver diseaseEur J Clin Invest2018489e1298829947103
- HuangSSunCHouYA comprehensive bioinformatics analysis on multiple Gene Expression Omnibus datasets of nonalcoholic fatty liver disease and nonalcoholic steatohepatitisSci Rep201881763029769552
- ChenSYangZWilkinsonAWThe PZP domain of AF10 senses unmodified H3K27 to regulate DOT1L-mediated methylation of H3K79Mol Cell201560231932726439302
- KleinBJMuthurajanUMLalondeMEBivalent interaction of the PZP domain of BRPF1 with the nucleosome impacts chromatin dynamics and acetylationNucleic Acids Res201644147248426626149