
Abstract
Background
Glioblastoma multiforme (GBM) remains to be one of the top lethal cancer types for adult to date. Current GBM therapies suffer greatly from the highly heterogeneous and adaptable nature of GBM cells, indicating an urgent need of alternative therapeutic options. In this study, we focused on identifying novel epigenetic targeted strategy against GBM.
Methods
A collection of epigenetic modulating small molecules were subjected to anti-GBM screening and the inhibitory effect of identified agent was validated both in vitro and in vivo. Genetic targeting approaches were also used to verify the on-target inhibitory effect of identified agent. Furthermore, the inhibitory mechanism of identified agent was investigated by integrative analyses of drug-treated GBM cells and GBM tumor databases.
Results
The covalent CDK7 inhibitor THZ1 was one of the top hits in our screening and its anti-GBM activity was confirmed both in vitro and in vivo. CDK7 inhibition through CRISPR-Cas9 or RNA interference also markedly disrupted GBM cell growth. Furthermore, analyses of multiple GBM tumor databases consistently revealed that CDK7 expression was significantly elevated in GBM compared with normal brain tissues and lower grade gliomas. Higher CDK7 expression was correlated with worse prognosis for both glioma and GBM. Mechanistically, THZ1 treatment led to considerable disruption of global gene transcription in GBM cells, preferentially targeting those associated with super-enhancers (SEs). We also showed that THZ1 sensitive and SE-related genes had important roles for GBM growth.
Conclusion
Our study shows that targeting SE-associated transcription addiction by CDK7 inhibition could be an effective therapeutic strategy against GBM.
Introduction
Glioblastoma multiforme (GBM) is the most common and malignant primary brain cancer in adults.Citation1 Despite multimodality treatment consisting of surgical debulking, radiotherapy, and temozolomide chemotherapy, the median survival is still 12–15 months.Citation2 Based on successful preclinical studies, many clinical trials have tested the efficacy of novel therapies, but improved survival for patients with GBM has been limitedly achieved over the past few decades.Citation2 Therefore, further work is urgently required to discover novel therapeutic strategies for GBM treatment.
Transcriptional dysregulation is increasingly recognized as a major factor contributing to pathogenesis of various cancers, including glioblastoma.Citation3 GBM cells harboring IDH1 mutation display G-CIMP signature due to accumulation of (R)– 2-hydroxyglutarate, resulting in global modulation of epigenome and transcriptome.Citation4–Citation6 Tumor-specific EGFR splicing variant EGFRvIII could modulate GBM epigenome and transcriptome through induction of two critical transcription factors SOX9 and FOXG1, thereby contributing to tumor growth and drug resistance.Citation7 Transcription inhibition has already been explored in GBM therapy. Bromodomain and extra-terminal protein inhibitors, targeting family member BRD4, a key activator of RNA polymerase II (RNAPII) transcription at active chromatin marks, have been shown to effectively treat genetically diverse GBM alone or in combination with conventional therapies, especially exhibiting higher sensitivity to EGFRvIII containing GBM cells.Citation8,Citation9 A small molecule targeting facilitates chromatin transcription complex, a histone chaperone complex that supports RNA polymerase-II mediated transcriptional elongation by remodeling nucleosomes, has been shown to preferentially eliminate glioblastoma stem cells and effectively overcome temozolomide resistance.Citation10
CDK7 phosphorylates RNA Pol II to initiate transcription and plays an active role in promoter proximal pausing.Citation11 THZ1 is a highly specific CDK7 inhibitor effective in preclinical models for malignancies with transcription factor dysregulation, such as T cell acute lymphoblastic leukemia,Citation12 small cell lung carcinoma,Citation13 neuroblastoma,Citation14 and triple-negative breast cancer.Citation15 THZ1 has also been shown to be able to cross blood–brain-barrier in our previous study and inhibit growth of diffuse intrinsic pontine glioma, which is a fatal pediatric cancer with limited therapeutic options.Citation16 Recently, a study has found that THZ1 inhibits growth of high-grade glioma (HGG) in vitro.Citation17 However, the therapeutic efficacy of THZ1 against GBM in vivo, the mechanisms of action, and the clinical significance of THZ1 in GBM still need to be further elucidated.
Here, THZ1 was also identified as one of the top potent agents in our anti-GBM screening with a collection of epigenetic modulating small molecules. We further demonstrated that CDK7 inhibition through either THZ1 or genetic approaches (CRISPR-Cas9 and RNA interference) effectively disrupted GBM growth both in vitro and in vivo. Furthermore, analyses of multiple GBM tumor databases consistently revealed that CDK7 expression was significantly elevated in GBM compared with normal brain tissues and lower grade gliomas. Higher CDK7 expression was correlated with worse prognosis for both glioma and GBM. Mechanistically, THZ1 treatment led to considerable disruption of global gene transcription in GBM cells, preferentially targeting those associated with super-enhancers (SEs). We also showed that THZ1 sensitive and SE-related genes had important roles for GBM growth. Taken together, our study showed that targeting SE-associated transcription addiction by CDK7 inhibition could be an effective therapeutic strategy against GBM.
Materials and methods
For detailed experimental procedures, please see the Supplementary materials.
Cell culture
U87 and U251 cell lines were obtained from Cell Bank of Chinese Academy of Science (Shanghai, China). SHSMU_ GBM05 and SHSMU_GBM06 primary cell lines were established from tumor tissues of GBM patients as described previously.Citation18 Human fetal neural stem cell (hfNSC) was a gift from Prof Michelle Monje (Stanford University School of Medicine). Human cells used were approved by ethnics committee of Ren Ji Hospital affiliated to Shanghai Jiao Tong University School of Medicine. The patients provided written informed consent and experiments were conducted in accordance with the Declaration of Helsinki. A172 was a gift from Dr Qingwei Zhu (Shanghai Jiao Tong University, Shanghai, China). SHSMU_GBM05, SHSMU_GBM06, and A172 GBM cell lines were verified with short tandem repeat profiling (Table S1). SHSMU_GBM05, SHSMU_GBM06, U87_serum_free, and hfNSC were cultured using NeuroCult NS-A Proliferation Kit supplemented with human EGF-basic, human fibroblast growth factor-basic, and 0.2% heparin solution.Citation19 U87_serum-free cells were passaged for 2 months before used for experiments. Other GBM cell lines were cultured in DMEM/high glucose supplemented with 10% FBS, penicillin (100 U/mL) and streptomycin (100 mg/mL). SHSMU_GBM06_FBS were passaged for 2 months before used for experiments. Mouse neural stem cells (mNSCs), mouse astrocytes (mAstro), and mouse granule cells (mGCs) were established and cultured as described previously.Citation20–Citation22
Tumor xenograft models
All experimental procedures were approved by the Animal Care and Use Committee of Shanghai Jiao Tong University School of Medicine and performed according to the guidelines. For subcutaneous xenograft studies, U87 cells were subcutaneously implanted into both flanks of nude mice. Mice were treated with vehicle control or THZ1 at 10 mg/ kg twice daily by intravenous injection. Tumor volumes were calculated as length×widthCitation2×0.5. Tumor sections were stained for H&E, Ki67, and cleaved caspase 3. Intracranial xenograft experiments were performed by injection of U87 cells into the right corpus striatum of nude mice.Citation23 Treatment continued for 2 weeks and mice survival status was recorded.
Lentivirus preparation and infection
To generate lentiviral sgRNA or shRNA plasmids, oligonucleotides were annealed and cloned into LentiCRISPR v2 plasmid or pLKO.1 plasmid, respectively. Lentiviral shRNA plasmids targeting CDK7 were from GE Healthcare Life Sciences (Marlborough, MA, USA). Lentivirus was generated by transfection of HEK293T cells with transducing vector and packaging vectors pMD2.G and psPAX. After 48 hours, virus particles were harvested, filtered, and concentrated by PEG6000. The oligonucleotides used are listed in Table S2.
Cell cycle, proliferation and apoptosis assays
Cell cycle analysis was performed using cell cycle staining kit. Cell proliferation was measured by using the Click-iT EdU Alexa Fluor 647 Flow Cytometry Assay Kit. Cell apoptosis was measured by using Annexin V-FITC Apoptosis Detection Kit I with some minor modifications. DAPI was used instead of propidium iodide. Fluorescence-activated cell sorting analyses were performed by using BD Fortessa FACS machine. The data were analyzed using Flowjo software.
RNA sequencing
RNA sequencing service was provided by OE Biotech (Shanghai, China). The fragments per kilobase million (FPKM) values for each gene were calculated by cufflinks (version 2.2.1).Citation24 We defined the active genes as the genes whose FPKM value is >1. The read count and FPKM per gene were normalized so that the ERCC spike-in read counts are the same in all samples. The gene ontology (GO) term enrichment analysis for the differentially expressed genes was performed by using hypermetric distribution to compute P-values with C2-canonical pathways and C5-GO gene sets from Molecular Signature Database.Citation25
Chromatin immunoprecipitation sequencing (ChIP-seq) data processing
Anti-H3K27Ac or anti-MED1 ChIP-Seq data as well as corresponding RNA-Seq data for U87 cell line were obtained from two previously published studies.Citation7,Citation26 ChIP-seq data were processed to define enhancer and SE by ROSE.Citation26 RNA-Seq data from the same sample were processed and the lowly expressed genes whose FPKM was <1 were not considered in the enhancer to gene mapping analysis by ROSE.
Clinical data analyses
Tumor gene expression profile and clinical information of glioma or GBM patients were obtained from publicly available databases, including Chinese Glioma Genome Atlas (CGGA), The Cancer Genome Atlas (TCGA), and Rembrandt.Citation27–Citation29 Kaplan–Meier survival and gene expression boxplot analyses were performed using Graphpad Prism 6.
Statistical analyses
Two-tailed Student’s t-test was used for comparing two groups in most statistical analyses. Log-rank test was used for analyzing survival data. *P<0.05, ** P<0.01, and *** P<0.001.
Results
Identification of THZ1 as a potent inhibiter of GBM cells in vitro
To identify epigenetic small molecules that suppress growth of GBM cells, we subjected U87 and serum-free cultured U87 cells (to mimic stem cell culture environmentCitation19,Citation30 to an unbiased high-throughput screen with a library of 96 annotated epigenetic small-molecule inhibitors, including experimental compounds or early-stage clinical candidates (Figure S1A and Table S3). Cells were plated into 384-well plates in duplicates and exposed to drugs at two concentrations (1 µM and 10 µM) for 72 hours, then analyzed for inhibition of proliferation using an imaging-based viability assay (Figure S1B). Six agents were identified to exhibit an IC50 of <1 µM in both conditions, including three HDAC inhibitors (HC toxin, panobinostat, and Trichostatin A), two CDK inhibitors (flavopiridol and THZ1) and one HMT inhibitor (chaetocin) (). THZ1 is a recently developed covalent CDK7 inhibitor that has been shown to effectively treat multiple malignancies with transcriptional dysregulation,Citation12–Citation15 but its anti-GBM efficacy in vivo and the underlying mechanisms have not been fully investigated yet. Therefore, we chose to focus on THZ1 for further investigation.
Figure 1 THZ1 inhibits growth of GBM in vitro and in vivo.
Notes: (A) Top ranked six agents with IC50<1 µM on our drug screen are presented. (B) Dose–response curves of long-established GBM cell lines (indicated in blue color), patient-derived GBM cell lines (indicated in red color) and control cell lines (indicated in green color). Data are shown as mean ± SD (C) U87 or U251 cells were treated with DMSO or THZ1 at indicated concentrations. Cell viabilities (mean ± SD) were assessed at day 0, 1, 2, and 3 after treatment. (D) Colony formation assay was performed on U87 or U251 cells as indicated. Crystal violet staining images are shown. (E) Tumor growth and body weight curves of subcutaneous tumor model. Data were presented as mean ± SEM (*P<0.05, ** P<0.01, *** P<0.001). Two-tailed Student’s t-test. (F) Images of subcutaneous tumors from vehicle and THZ1 treatment groups (n=12 each). (G H&E and immunohistochemistry staining of Ki67 and CC3 of tissue sections from vehicle or THZ1 treated subcutaneous tumor. Original magnification, ×400. (H) Kaplan– Meier survival curves and median survival length of orthotopic tumor models are shown (log-rank test).
Abbreviations: CC3, cleaved caspase-3; GBM, glioblastoma multiforme.
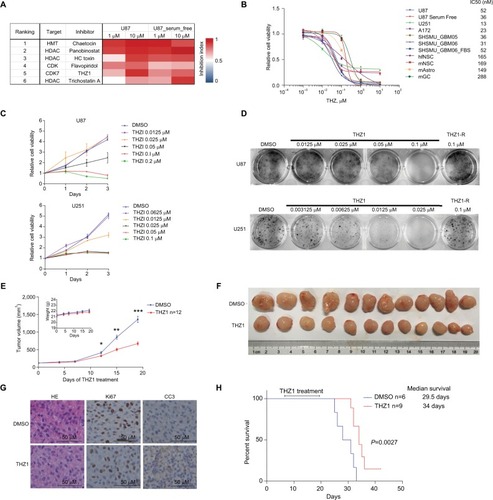
To validate our results, we treated five GBM cell lines (including two primary GBM cell lines) and four control cell lines with dimethyl sulfoxide, THZ1 0.001 µM, 0.01 µM, 0.1 µM, 1 µM, or 10 µM for 72 hours. We found that GBM cells were highly sensitive to CDK7 inhibition, with IC50 values ranging from 13 nM to 84 nM (). On the contrary, all control normal brain cells, such as hfNSCs, mNSCs, mAstro, and mGCs, were significantly less sensitive to THZ1 treatment, with IC50 values ranging from 149 nM to 288 nM (). We also treated U87 cells cultured in serum-free medium (to mimic stem cell culture environment) or SHSMU_GBM06 cells cultured in FBS contained medium (to mimic non-stem cell culture environment) with THZ1.Citation19,Citation30,Citation31 We found that both cell lines were still sensitive to THZ1 with IC50 of 36 nM or 52 nM, respectively, suggesting THZ1 could be at least equally effective against glioma stem cells if not more (). The same results were achieved using another cell viability assay (Figure S1C). Time-course tracking of THZ1-treated U87 and U251 cells showed that THZ1 treatment caused a dose- and time-dependent growth disruption of GBM cells (), resulting in significant inhibition of colony formation in vitro (). The noncovalent CDK7 inhibitor THZ1-R exhibited much less potency against GBM cells in vitro, suggesting that the unique characteristic of THZ1 in covalently binding to its target determines its antineoplastic potency (, Figure S1D).
THZ1 inhibits growth of GBM cells in vivo
We subsequently went on to test the in vivo anti-GBM effects of THZ1 in subcutaneous xenograft model of U87. Our results showed that intravenous injection of THZ1 at 10 mg/kg twice daily could markedly disrupt subcutaneous tumor growth without significantly affecting mouse body weight (). Compared with vehicle-treated tumors, tumor tissues isolated from THZ1-treated mice had reduced proliferation and increased apoptosis, as indicated by immunostaining against Ki67 and cleaved caspase 3 ().
THZ1 has been shown to be able to cross blood–brain-barrier in our previous study,Citation16 therefore, we proceeded to test THZ1 treatment in orthotopic xenograft model with stereotactic intracranial injection of U87 cells. THZ1 treatment lasted for 2 weeks at 10 mg/kg twice daily via tail vein and our results showed that THZ1-treated mice survived significantly longer compared with control mice (P=0.0027), resulting in an increase of median survival from 29.5 days to 34 days ().
CDK7 is a prognostic marker for glioma and GBM patients
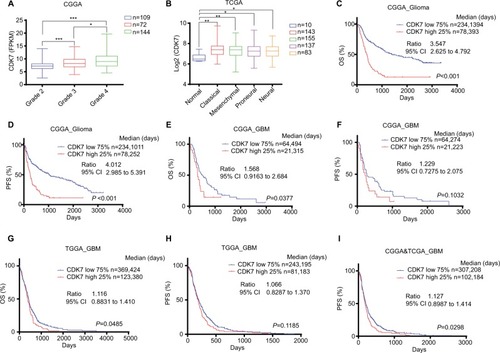
To explore the clinical significance of CDK7 inhibition in GBM, we analyzed two well-known publicly available databases: CGGA and TCGA.Citation27,Citation29 Our analysis revealed that CDK7 was significantly upregulated in GBM compared with non-neoplastic brain tissues or low-grade gliomas (). Our analysis also found that higher CDK7 expression was consistently linked to worse prognosis in glioma patients as shown by Kaplan–Meier curves of overall survival (OS) and progression-free survival (PFS) in CGGA database (). For GBM patients, CDK7 expression was also significantly related to OS in both databases (). The trend that CDK7 expression was related to PFS in each GBM database could reach significance when combined together ().
Figure 2 CDK7 is a prognostic marker of glioma and GBM.
Notes: (A,B) Box plots of CDK7 expression levels in glioma or GBM samples from CGGA (A) or TCGA (B) databases. P-values were determined by Two-tailed Student’s t-test. *P<0.05, **P<0.01***P<0.001. (C–I) Kaplan–Meier plots showing OS or PFS rate in CGGA_Glioma, CGGA_GBM, TCGA_GBM or CGGA and TCGA combined cohorts comparing CDK7-high (red) vs CDK7-low (blue) patients. Median survival days, ratio, and 95% CI were shown.
Abbreviations: CGGA, Chinese Glioma Genome Atlas; GBM, glioblastoma multiforme; OS, overall survival; PFS, progression-free survival; TCGA, The Cancer Genome Atlas.
Targeting CDK7 by CRISPR-Cas9 or RNA interference inhibits growth of GBM cells
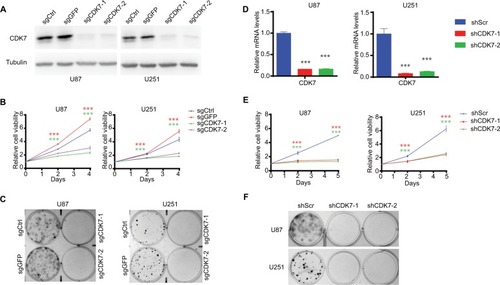
To validate the on-target inhibitory effects of THZ1, we employed CRISPR-Cas9 and RNA interference approaches to genetically target CDK7 and measured their effects on growth of GBM cells. Two individual sets of sgRNAs and shRNAs were designed and their efficiency of targeting CDK7 expression in U87 and U251 cells were confirmed, respectively (). Like THZ1 treatment, genetically targeting CDK7 by either CRISPR-Cas9 or RNA interference markedly suppressed cell proliferation () and colony formation in both GBM cell lines (), confirming that CDK7 represents a valid therapeutic target for GBM.
Figure 3 Targeting CDK7 by CRISPR-Cas9 or RNA interference inhibits growth of GBM cells.
Notes: (A) Knockout efficiencies of sgCDK7s are shown by Western blot. (B) Cell growth of GBM cells infected with CRISPR-Cas9 expressing lentivirus as indicated. Green and red asterisks indicate P-values of sgCDK7-1 and sgCDK7-2 group compared with control (sgCtrl plus sgGFP), respectively. (C) Colony formation assay was performed on GBM cells infected with CRISPR-Cas9 expressing lentivirus as indicated and crystal violet staining images are shown. (D) Knockdown efficiencies of shCDK7s were determined by RT-qPCR (n=3). (E) Cell growth curve of GBM cells infected with shRNA expressing lentivirus as indicated. Red and green asterisks indicate P-values of shCDK7-1 and shCDK7-2 group compared with shScr, respectively. (F) Colony formation assay was performed on GBM cells infected with shRNA expressing lentivirus as indicated and crystal violet staining images are shown. P-values were determined by Two-tailed Student’s t-test. ***P<0.001.
Abbreviations: GBM, glioblastoma multiforme; RT, real-time.
THZ1 causes cell cycle arrest, shuts off proliferation and induces apoptosis of GBM cells
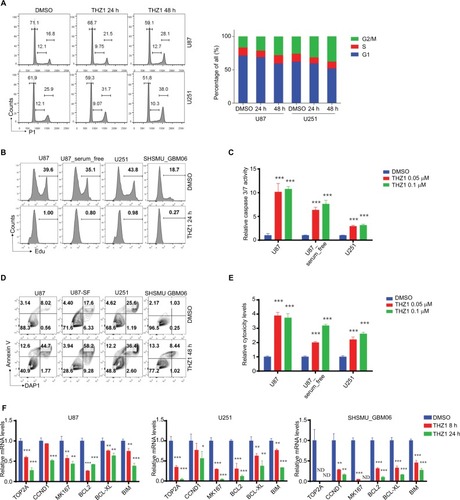
Next, we aimed to comprehensively dissect the inhibitory mechanism of THZ1 against GBM cells. CDK7 has been implicated in cell cycle regulation by controlling phosphorylation of CDK1 and CDK2.Citation11 Our cell cycle analysis found that THZ1 caused cumulative G2/M arrest (). We also found that THZ1 treatment of GBM cells resulted in almost complete shut-off of cell proliferation (). Moreover, THZ1 could induce a significant activation of caspase 3/7 () and remarkable apoptosis (), eventually leading to robust cell death (). Consistent with aforementioned findings, our real-time (RT)-qPCR results revealed THZ1 induced significant downregulation of proliferative genes (TOP2A, CCND1, and MKI67) and anti-apoptosis genes (BCL2, BCL-XL, and BIM) ().
Figure 4 THZ1 causes cell cycle arrest, shuts off proliferation, and induces apoptosis in GBM cells.
Notes: (A) FACS Cell cycle analyses of GBM cells exposed to DMSO or 0.1 µM THZ1 for 24 or 48 hours. The percentages of each cell cycle phase are presented in bar chart on the right. (B) Cell proliferation analyses of GBM cells treated with DMSO or 0.1 µM THZ1 for 24 hours with EdU incorporation FACS assay. Percentages of EdU+ cells are presented. (C) Caspase 3/7 activity of GBM cells treated with DMSO or THZ1 at indicated concentrations for 48 hours with Caspase-Glo assay. (D) Apoptosis analyses of GBM cells treated with DMSO or 0.1 µM THZ1 for 48 hours by Annexin-V staining FACS assay. Percentages of each quadrant are presented. (E) Cytotoxicity of GBM cells treated with DMSO or THZ1 at indicated concentrations for 48 hours with Cytotox-Glo assay. (F) RT-qPCR analyses of mRNA levels of proliferation and anti-apoptosis-related genes in GBM cells treated with DMSO or 0.1 µM THZ1 for 8 or 24 hours. P-values were determined by Two-tailed Student’s t-test. *P<0.05, **P<0.01***P<0.001. Abbreviations: FACS, fluorescence-activated cell sorting; GBM, glioblastoma multiforme: ND, not detected; RT, real-time.
THZ1 inhibits global gene transcription and preferentially targets SE-associated genes in GBM cells
CDK7 also plays a critical role in transcription through directly or indirectly affecting phosphorylation of the initiation-associated serine 5 (S5) and serine 7 (S7) and the elongation-associated serine 2 (S2) at the carboxyl-terminal domain (CTD) of RNAPII,Citation32,Citation33 so we went on to determine how THZ1 affects transcription and gene expression in GBM cells. As expected, THZ1 but not THZ1R caused a remarkable decrease of phosphorylated S2, S5, and S7 of RNAPII CTD in GBM cells (), resulting in significant global downregulation of steady-state mRNA levels only after 8 hours of treatment as measured by RNA sequencing (). GO analyses of significantly downregulated transcripts (log2FC≤−1.5, FDR ≤0.05) showed that the top THZ1-sensitive biological processes and functions were related to transcription, gene expression, DNA repair, cell cycle and apoptosis (, Table S4).
Figure 5 THZ1 inhibits global gene transcription and preferentially targets super-enhancer-associated genes in GBM cells.
Notes: (A) Immunoblotting analyses of RNAPII CTD phosphorylation in GBM cells treated with DMSO, THZ1 (0.1 µM) or THZ1-R (0.1 µM). (B) Heatmap of relative gene expression levels of all active transcripts in U87 cells treated with THZ1 (0.1 µM for 8 hours) vs DMSO. (C) Histogram of active transcript counts grouped by fold change of gene expression in response to THZ1 treatment. Red and blue bars indicated FDR ≤0.05 or FDR >0.05, respectively. (D) Top five enriched GO categories of THZ1-sensitive transcripts (log2FC≤−1.5, FDR ≤0.05). (E) Box plots of log2 fold changes for all active transcripts (All) or those associated with TE or SE in U87 cells treated with 0.1 µM THZ1 for 8 hours. *P<0.05, Two-tailed Student’s t-test. (F) Gene set enrichment analysis plot showing significant enrichment of SE-associated genes in DMSO-treated cells relative to THZ1-treated cells. (G) Top 10 enriched GO biological process and molecular function categories of THZ1-sensitive SE-associated transcripts (log2FC≤−1, FDR ≤0.05).
Abbreviations: CTD, C-terminal domain; FDR, false discovery rate; GBM, glioblastoma multiforme; GO, gene ontology; NES: normalized enrichment score; SE, super enhancer; TE, typical enhancer.
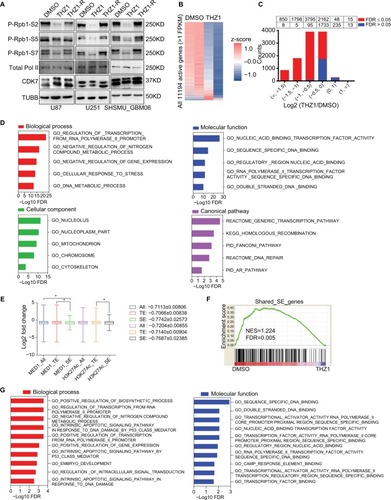
SE-associated genes, which play key roles in determining tumor cell identity and malignant phenotypes, have been shown to be more sensitive to THZ1 inhibition and thereby serve as its primary target genes in other cancer types.Citation12–Citation15 To further investigate how THZ1 affected SE-associated genes in GBM, published anti-MED1 and anti-H3K27Ac ChIP-seq data of U87 cells were obtained and analyzed to characterize its enhancer landscape. A total of 462 and 575 SE-associated genes were identified, with an overlap of 251 genes, including four known GBM-associated genes: STAT6, PKM2, CD44, and BCL2L1 (Figure S2A-C). Notably, GO_POSITIVE_ REGULATION_OF_GENE_EXPRESSION was identified as the top enriched biological process from GO analyses of the shared SE-associated genes, suggesting a crucial role of gene expression regulation in GBM (Figure S2D and Table S5). Our data found that the mean abundance of SE-associated genes was significantly more reduced by THZ1 compared with that of typical enhancer-associated genes (). Moreover, the shared SE-associated transcripts were enriched of THZ1-sensitive genes (), and these THZ1-sensitive SE associated genes (log2FC≤−1, FDR ≤0.05) were significantly associated with molecular processes and functions related to biosynthesis, transcription, apoptosis, embryo development and signal transduction (, Table S6).
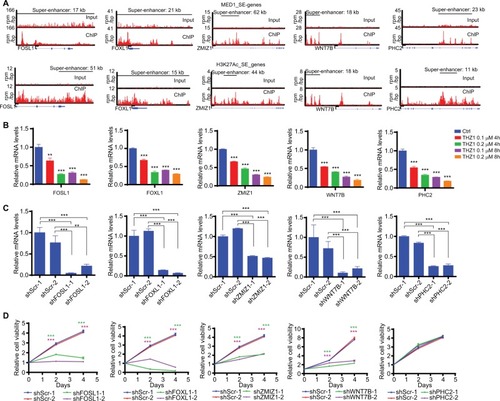
Functional validation of THZ1-sensitive SE-associated genes in GBM cells
THZ1-sensitive SE-associated genes have been shown to be enriched of tumor “Achilles gene”,Citation15 therefore, we selected the top five highly expressed THZ1-sensitive SE-associated genes of U87 cells (WNT7B, FOSL1, FOXL1, ZMIZ1, and PHC2 as shown in ) for functional validation. Our RT-qPCR results confirmed that these five selected genes were highly sensitive to THZ1 inhibition (). Moreover, we employed shRNA-mediated knockdown to silence each one of them individually in U87 cells () and monitored their effects on cell proliferation. As shown in , knockdown of four such genes, WNT7B, FOSL1, FOXL1, and ZMIZ1, markedly disrupted U87 cell proliferation.
Figure 6 Functional validation of THZ1-sensitive SE-associated genes in GBM cells.
Notes: (A) Gene tracks of MED1 (top) or H3K27Ac (bottom) ChIP-seq occupancy at indicated SE-associated gene loci. The x-axis shows genomic position and the y-axis shows the signal of binding in units of reads per million bin (rpm/bp). (B) RT-qPCR analyses of mRNA levels of 5 selected THZ1-sensitive SE-associated genes in response to THZ1 treatment as indicated. (C) RT-qPCR analyses of knockdown efficiency of shRNAs targeting five selected THZ1-sensitive SE-associated genes. (D) Cell growth curve of U87 cells infected with shRNA expressing lentivirus as indicated. Green and purple asterisks indicate P-values of two shRNA groups compared with control (shScr-1 plus shScr-2), respectively. **P<0.01, ***P<0.001, Two-tailed Student’s t-test.
Abbreviations: CHIP-seq, chromatin immunoprecipitation sequencing; GBM, glioblastoma multiforme; RT, real-time; SE, super enhancer.
Discussion
GBM remains to be one of the top lethal cancer types for adults to date. Current clinical therapies of GBM suffer greatly from the highly heterogeneous and adaptable genome and transcriptome of GBM cells.Citation34,Citation35 Therefore, further work is urgently required to discover novel therapeutic strategies for GBM treatment. We focused on identifying novel epigenetic therapy against GBM because most oncogenic driver genes or signalling pathways converge to affect gene expression, which is universally under control of epigenetic regulation. In this study, the covalent CDK7 inhibitor THZ1 was one of the top hits in our anti-GBM epigenetic drug screening. Therapeutic efficacy of CDK7 inhibition against GBM by THZ1 or genetic targeting approaches (shRNA and sgRNA) were confirmed both in vitro and in vivo. Notably, multiple long-established GBM cell lines and recent patient-derived primary GBM cell lines tested in our study all exhibited high sensitivity to THZ1. Our study was further strengthened by analyses of GBM patient tumor database, such as CGGA and TCGA, which revealed the clinical significance of CDK7 as a prognostic marker of GBM. These results strongly support the therapeutic efficacy of THZ1 in antagonizing CDK7-mediated transcriptional addiction in GBM.
Like previous studies,Citation12–Citation15 we found that THZ1 treatment of GBM cells resulted in broad inhibition of RNAPII-mediated gene transcription but preferentially target SE-associated genes compared with regular enhancer-associated genes. SEs have been shown to be associated with key oncogenic genes in several cancer types,Citation26 therefore, the hypersensitivity of these genes to THZ1 could make CDK7 inhibition a promising therapeutic strategy against GBM. Moreover, our functional validation of the top five highly expressed THZ1-sensitive SE-associated genes showed knockdown of four such genes individually remarkedly inhibited GBM cell growth, underscoring SE-associated genes as critical downstream functional targets of THZ1 in treating GBM and supporting the idea that THZ1-sensitive SE-associated genes are enriched with tumor “Achilles genes”.
Notably, another group has recently published a study showing that CDK7 could be a potential therapeutic target in HGG,Citation17 our current study adds values on theirs, including 1) our study successfully demonstrates in vivo therapeutic efficacy of THZ1 against GBM, 2) our study uses genetic targeting approaches (CRISPR-Cas9 and RNAi) to directly confirm CDK7 as valid therapeutic target of GBM, 3) our study revealed SE-associated genes as top sensitive and critical functional targets of THZ1-induced global transcription inhibition in GBM cells and 4) our integrative analyses of GBM tumor databases provide further clinical-relevant support for CDK7 inhibition therapy of GBM.
In summary, our study demonstrates that targeting CDK7-associated dysregulated transcriptional program could be an effective therapeutic strategy of treating GBM. Together with a couple of other recent studies,Citation10,Citation17,Citation36,Citation37 we contribute to uncover the importance of transcription process in GBM oncogenesis and therapy and provide rational for further exploiting transcriptional addiction as valid therapeutic target of GBM. Finally, given that a recent study reported transcription inhibition by THZ1 could also suppress adaptive responses to targeted cancer therapy,Citation38 combination of transcription inhibition therapy with canonical chemotherapy or targeted therapy in GBM shall be further tested in future.
Acknowledgments
We thank Zheng Zhao (Beijing Tian Tan Hospital) for help with CGGA database analyses. Helpful discussions and advice regarding this work from all other members of Tang Laboratory and Ma Laboratory are greatly appreciated as well. Shanghai Jiao Tong University (YG2016MS74 to Q.L.), Shanghai Xin Hua Hospital (JZPI201701 to J.M.), Shanghai Shen Kang Hospital Development Center (16CR2031B to J.M.), Shanghai Science and Technology Committee (17411951800 to J.M., 17411965700 to Y.Z.), Shanghai Municipal Natural Science Foundation (14ZR1413800 to C.Z.), The Recruitment Program of Global Experts of China (National 1000-Youth Talents Program to Y.T.), The Program for Professor of Special Appointment (Eastern Scholar) at Shanghai Institutions of Higher Learning (Y.T.), National Natural Science Foundation of China (81572761 and 81772655 to YT, 81500601 to CZ, 81572501 to JC, 81702453 to YZ) and Shanghai Rising-Star Program (YT). The abstract of this paper was presented at the 18th International Symposium on Pediatric Neuro-Oncology (ISPNO 2018) as a poster presentation with interim findings. The poster’s abstract was published in “Poster Abstracts” in Neuro-Oncology: https://doi.org/10.1093/neuonc/noy059.690.
Author contributions
JM and YT designed the project and experiments. WM, JW, BW, QL, FL, ML, and YZ conducted experiments. WM and LZ analyzed RNA-seq and ChIP-seq data. WM, BW, CZ, and JC analyzed the clinical data. YT and WM made the figures and wrote the manuscript. JM and YT supervised all aspects of the work. All authors contributed to data analysis, drafting and revising the article, gave final approval of the version to be published, and agree to be accountable for all aspects of the work.
Disclosure
The authors report no conflicts of interest in this work.
References
- OstromQTGittlemanHLiaoPCBTRUS Statistical Report: Primary brain and other central nervous system tumors diagnosed in the United States in 2010-2014Neuro Oncol201719suppl_5v1v8829117289
- PolivkaJJrPolivkaJHolubecLAdvances in experimental targeted therapy and immunotherapy for patients with glioblastoma multiformeAnticancer Res2017371213328011470
- SenguptaSGeorgeRESuper-enhancer-driven transcriptional dependencies in cancerTrends Cancer20173426928128718439
- TurcanSRohleDGoenkaAIDH1 mutation is sufficient to establish the glioma hypermethylator phenotypeNature2012483739047948322343889
- DangLWhiteDWGrossSCancer-associated IDH1 mutations produce 2-hydroxyglutarateNature2010465730096620559394
- NoushmehrHWeisenbergerDJDiefesKCancer Genome Atlas Research NetworkIdentification of a CpG island methylator phenotype that defines a distinct subgroup of gliomaCancer Cell201017551052220399149
- LiuFHonGCVillaGREGFR mutation promotes glioblastoma through epigenome and transcription factor network remodelingMol Cell201560230731826455392
- Berenguer-DaizéCAstorgues-XerriLOdoreEOTX015 (MK-8628), a novel BET inhibitor, displays in vitro and in vivo antitumor effects alone and in combination with conventional therapies in glioblastoma modelsInt J Cancer201613992047205527388964
- ChengZGongYMaYInhibition of BET bromodomain targets genetically diverse glioblastomaClin Cancer Res20131971748175923403638
- BaroneTABurkhartCASafinaAAnticancer drug candidate CBL0137, which inhibits histone chaperone FACT, is efficacious in preclinical orthotopic models of temozolomide-responsive and -resistant glioblastomaNeuro Oncol201719218619627370399
- FisherRPSecrets of a double agent: CDK7 in cell-cycle control and transcriptionJ Cell Sci2005118Pt 225171518016280550
- KwiatkowskiNZhangTRahlPBTargeting transcription regulation in cancer with a covalent CDK7 inhibitorNature2014511751161662025043025
- ChristensenCLKwiatkowskiNAbrahamBJTargeting transcriptional addictions in small cell lung cancer with a covalent CDK7 inhibitorCancer Cell201426690992225490451
- ChipumuroEMarcoEChristensenCLCDK7 inhibition suppresses super-enhancer-linked oncogenic transcription in MYCN-driven cancerCell201415951126113925416950
- WangYZhangTKwiatkowskiNCDK7-dependent transcriptional addiction in triple-negative breast cancerCell2015163117418626406377
- NagarajaSVitanzaNAWooPJTranscriptional dependencies in diffuse intrinsic pontine gliomaCancer Cell2017315635652.e628434841
- GreenallSALimYCMitchellCBCyclin-dependent kinase 7 is a therapeutic target in high-grade gliomaOncogenesis201765e33628504693
- PollardSMYoshikawaKClarkeIDGlioma stem cell lines expanded in adherent culture have tumor-specific phenotypes and are suitable for chemical and genetic screensCell Stem Cell20094656858019497285
- LeeJKotliarovaSKotliarovYTumor stem cells derived from glioblastomas cultured in bFGF and EGF more closely mirror the phenotype and genotype of primary tumors than do serum-cultured cell linesCancer Cell20069539140316697959
- LeeAKesslerJDReadTAIsolation of neural stem cells from the postnatal cerebellumNat Neurosci20058672372915908947
- RadkeJBortolussiGPagenstecherAAkt and c-Myc induce stem-cell markers in mature primary p53−/− astrocytes and render these cells gliomagenic in the brain of immunocompetent micePLoS One201382e5669123424671
- Wechsler-ReyaRJScottMPControl of neuronal precursor proliferation in the cerebellum by Sonic HedgehogNeuron199922110311410027293
- DonoghueJFBoglerOJohnsTGA simple guide screw method for intracranial xenograft studies in miceJ Vis Exp2011553157
- RobertsATrapnellCDonagheyJRinnJLPachterLImproving RNA-Seq expression estimates by correcting for fragment biasGenome Biol2011123R2221410973
- LiberzonASubramanianAPinchbackRThorvaldsdóttirHTamayoPMesirovJPMolecular signatures database (MSigDB) 3.0Bioinformatics201127121739174021546393
- LovénJHokeHALinCYSelective inhibition of tumor oncogenes by disruption of super-enhancersCell2013153232033423582323
- BaoZSChenHMYangMYRNA-seq of 272 gliomas revealed a novel, recurrent PTPRZ1-MET fusion transcript in secondary glioblastomasGenome Res201424111765177325135958
- MadhavanSZenklusenJCKotliarovYSahniHFineHABuetowKRembrandt: helping personalized medicine become a reality through integrative translational researchMol Cancer Res20097215716719208739
- BrennanCWVerhaakRGMcKennaATCGA Research NetworkThe somatic genomic landscape of glioblastomaCell2013155246247724120142
- YuSCPingYFYiLIsolation and characterization of cancer stem cells from a human glioblastoma cell line U87Cancer Lett2008265112413418343028
- HanYPEnomotoAShirakiYSignificance of low mTORC1 activity in defining the characteristics of brain tumor stem cellsNeuro Oncol201719563664728453744
- AkhtarMSHeidemannMTietjenJRTFIIH kinase places bivalent marks on the carboxy-terminal domain of RNA polymerase IIMol Cell200934338739319450536
- LarochelleSAmatRGlover-CutterKCyclin-dependent kinase control of the initiation-to-elongation switch of RNA polymerase IINat Struct Mol Biol201219111108111523064645
- KimJLeeIHChoHJSpatiotemporal evolution of the primary glioblastoma genomeCancer Cell201528331832826373279
- PatelAPTiroshITrombettaJJSingle-cell RNA-seq highlights intratumoral heterogeneity in primary glioblastomaScience201434461901396140124925914
- MillerTELiauBBWallaceLCTranscription elongation factors represent in vivo cancer dependencies in glioblastomaNature2017547766335535928678782
- DermawanJKHitomiMSilverDJPharmacological targeting of the histone chaperone complex FACT preferentially eliminates glioblastoma stem cells and prolongs survival in preclinical modelsCancer Res20167682432244226921329
- RusanMLiKLiYSuppression of adaptive responses to targeted cancer therapy by transcriptional repressionCancer Discov201881597329054992