
Abstract
Background/aim
Gastric cancer (GC) is one of a most threatening cancer globally. Rhotekin (RTKN), a Rho effector, has been reported to be upregulated in GC tissues. This study aimed to investigate the underlying regulatory roles of RTKN in the biological behavior of GC.
Methods
Real-time PCR and Western blotting were carried out to detect the mRNA and protein expression, respectively. Cell Counting Kit-8 and xenograft nude mice model were used to evaluate cell proliferation. Flow cytometry analysis was performed to assess cell cycle distribution and cell apoptosis.
Results
RTKN had high expression level in GC compared with normal tissues. RTKN expression strongly associated with tumor size, TNM stage, lymphnode metastasis and the poor prognosis of patients with GC. Downregulation of RTKN significantly repressed GC cell proliferation, but increased cell population in G1/S phase and induced cell apoptosis. Moreover, the RTKN expression level was related to the p53 signaling pathway and histone deacetylase (HDAC) Class I pathway. RTKN knockdown caused a notable increment in the acetylation level of p53 (Lys382), and the expression of p53-target genes (p21, Bax, and PUMA), as well as a reduction in the expression of a potential deacetylase for p53, HDAC1. Notably, downregulation of HDAC1 had similar effects as RTKN knockdown, and RTKN overexpression could hardly abrogate the effects of HDAC1 knockdown on GC cells.
Conclusion
RTKN could work as an oncogene via regulating HDAC1/p53 and may become a promising treatment strategy for GC.
Introduction
Gastric cancer (GC) ranks among the top four cancer diagnoses and is the second most common cause of cancer-related death in the world.Citation1–Citation3 In spite of advances made in the early detection and treatment of GC,Citation4,Citation5 it is frequently not diagnosed until an advanced stage, and has a low survival rate.Citation6–Citation8 The main risk factors for gastric cancer include Helicobacter pylori (H pylori) infection and dietary factors.Citation9,Citation10 Beside environmental factors, GC is a complicated multistep process involving various oncogenic signaling pathways.Citation11,Citation12 Until now, due to its high incidence rate, poor prognosis, and limited treatment options, GC remains a major clinical challenge to clinicians.
Rhotekin (RTKN) has been identified as a Rho effector protein. Rho is one of the best-characterized members of Rho GTPases, which play a critical role in multiple biological processes, including cytoskeleton reorganization, cell differentiation, cell cycle progression, and cell migration.Citation13 RTKN was initially found complexing with active form of Rho,Citation14 and subsequent studies identified several interaction partners of RTKN, including septin9b,Citation15 LIN7B,Citation16 PISTCitation17 and tax-interacting protein 1,Citation18,Citation19 vinexinCitation20 and S100A4,Citation21 and suggested possible functions of RTKN in the formation and/or maintenance of septin filament, focal adhesions, stress fiber, and cell polarity. Evidence has suggested that RTKN is overexpressed in human cancer tissues, including GCCitation22 and bladder cancer,Citation23 when compared with corresponding normal tissues. RTKN overexpression in GC cells inhibited apoptosis, which was dependent on Rho activity and NF-κB activation.Citation22,Citation24 p53, an important tumor suppressor located at 17pl3.1, has multiple biological functions in regulating cell cycle, inhibiting cell apoptosis, and maintaining genome stability via regulating the transcription of >150 target genes.Citation25,Citation26 It has been known that loss of function of the p53 gene plays a central role in the development of cancers. Mutations in the p53 gene are the most common genetic alterations and have been reported in various human cancers including GC.Citation27–Citation29 The acetylation levels of p53 correlate with the activation and stabilization of p53.Citation30
In the current study, we confirmed the upregulation of RTKN in GC tissues, explored the association of RTKN expression with the aggressive characteristics and survival properties of GC patients, and investigated the functions of RTKN in GC cell proliferation, cell cycle arrest, and apopto-sis. Besides, we explored that the p53 signaling pathway may be involved in the biological functions of RTKN in GC cells. Our data suggest that RTKN may be an effective oncogene and a therapeutic target for GC.
Materials and methods
GC tissue microarray
A tissue microarray (Cat#: HStm-A180Su-09, Shanghai Outdo Biotech, Shanghai, China) with 90 matched pairs of primary GC samples and adjacent gastric tissues was applied to evaluate the expression and clinical relevance of RTKN. Among these samples, one paired tumor and adjacent normal tissues were excluded due to incomplete information of the tissues. The core diameter on this tissue microarray was 1.5 mm.
Immunohistochemical staining
The sections were deparaffinized in xylene and rehydrated in ethanol, and then heated in 0.01 M citrate buffer (pH 6.0) by autoclave for 20 minutes. Subsequently, to inactivate endogenous peroxidases, the sections were incubated with 0.3% hydrogen peroxide for 30 minutes. After incubation with 10% normal goat serum to block nonspecific binding sites, the sections were probed with anti-RTKN (Abcam, Cambridge, MA, USA) overnight at 4°C, and then incubated with horseradish peroxidase (HRP)-conjugated secondary antibody for 1 hour at room temperature. Finally, the sections were stained with the 3,3′-diaminobenzidine solution (Vector Laboratories, Burlingame, CA, USA) and counterstained with hematoxylin. The specimens were divided into RTKN high-expression group (≥25% of tumor cells were positively stained) and low-expression group (<25% of tumor cells were positively stained).
Cell culture
Human GC cell lines MKN-45, SGC-7901, MGC-803, and AGS were purchased from Cell Bank of Chinese Academy of Science (Shanghai, China). Cells were cultured and maintained in RPMI 1640 containing 10% (v/v) fetal bovine serum, 100 IU/mL penicillin, and 100 µg/mL streptomycin in a humidified atmosphere of 5% CO2 in air at 37°C.
Reverse transcription and real-time PCR
Total RNA was extracted from specimens or culture cells with Trizol reagent (Invitrogen, Carlsbad, CA, USA) and reverse transcribed to complementary DNA with oligo (dT) primers. Real-time PCR was then performed with the gene-specific primers and SYBR Green Master Mixes (Thermo Fisher Scientific, Waltham, MA, USA) on real-time PCR system (Thermo Fisher Scientific). The relative expression mRNA levels were normalized to GADPH expression. All primers were designed with Primer Premier 6 Software and are listed in .
Table 1 Primer pairs used for real-time PCR
Western blot analysis
Cell treated as indicated were harvested. The protein concentration was analyzed by BCA protein Assay Reagent (Sangon Biotech, Shanghai, China). Equivalent amounts of whole protein (35 µg) were separated with 10% or 12% SDS-PAGE and then transferred onto nitrocellulose membranes. The membranes were blocked with 5% skimmed milk in Tris-buffered saline supplementing with 0.05% Tween-20 (TBST) at room temperature for 1 hour. Then, the membranes were incubated with primary antibodies according to the manufacturers’ instructions. Following washing with TBST, the membranes were incubated with the HRP-conjugated secondary antibodies at room temperature for 1 hour. The membrane signals were detected using an enhanced chemiluminescence kit (BioRad, Richmond, CA, USA). Antibodies against RTKN, histone deacetylase (HDAC)1, acetylated p53 (Ace-p53), and p21 were from Abcam. Antibodies against p53 and GAPDH were purchased from Cell Signaling Technology (Danvers, MA, USA). Antibodies against Bax and Puma were from Santa Cruz (Santa Cruz, CA, USA).
Manipulation of RTKN expression by lentivirus
shRNA oligos targeting RTKN (shRTKN#1, CCGGGA-AC T G C G G T TAG AG C T G TAT C T C G AG ATAC -AGCTCTAACCGCAGTTCTTTTTC; shRTKN #2, CCGGGAAGCAGTGCTGTGATGAAATCTCGAGA-TTTCATCACAGCACTGCTTCTTTTTC; and shRTKN#3, CCGGAAGAACCCTTGGAGCAAACATCTCGAGAT-GTTTGCTCCAAGGGTTCTTTTTTTC) were annealed and cloned into AgeI- and EcoRI-digested pLKO.1 (Addgene, Cambridge, MA, USA). The full-length human RTKN was cloned into pLVX-puro (Clontech, Palo Alto, CA, USA). The lentivirus of shRTKN, control shRNA (shNC), pLVX-RTKN (OE), or pLVX-puro (Vector) was produced in 293 T cells along with packaging plasmids, psPAX2 and pMD2.G.
siRNA
HDAC1 siRNA duplex (siHDAC1, 5′-GGAAGAGUUCUC-CGAUUCU-3′) and control scrambled siRNA duplex (siNC, 5′-CCAUUCCGAUCCUGAUCCG-3′) were synthesized by Genepharma (Shanghai, China). siRNAs were transfected into cells following the manufacturer’s instructions of Lipofectamine 2000 (Invitrogen).
Cell proliferation assay
After transduced with indicated lentivirus, the proliferation of MKN-45 and SGC-7901 cells was assessed by Cell Counting Kit (CCK)-8 kit (Beyotime, Shanghai, China). Briefly, cells were seeded in 96-well plates (4×10³ per well), and further incubated for 12, 24, 48, or 72 hours. At 1 hour before the end point of incubation, cells were incubated with CCK-8 reagent. The OD values at a wavelength of 450 nm were determined by a microplate reader. Experiments were performed in triplicate and repeated at least three times.
Cell cycle and apoptosis assays
MKN-45 and SGC-7901 cells were treated as indicated. At 48 hours after treatment, the cells were harvested, washed with PBS, and proceeded to cell cycle and apoptosis assays. For cell cycle analysis, the cells were fixed in ethanol at −20°C overnight, washed with PBS, and stained with propidium iodide (PI, Sigma, St. Louis, MO, USA) at 37°C for 30 minutes. The cell cycle distribution was analyzed by using flow cytometry (BD Biosciences, Franklin Lakes, NJ, USA). For cell apoptosis analysis, cells were stained with Annexin V-fluorescein isothiocyanate (FITC) apoptosis detection kit (Beyotime), and apoptotic rates were also analyzed by using flow cytometry (BD Biosciences).
Growth of cells in athymic nude mice and tumor size determination
SGC-7901 cells stably transduced with shNC or shRTKN were established by puromycin selection. Twelve male athymic nude mice (4–6 weeks old) were randomly divided into two groups (six mice/group), and shNC and shRTKN cells were subcutaneously injected to the two groups of mice, respectively (2×10⁶ cells per mouse). The tumor size was measured every 3 days after tumor formation (around 7–14 days). And 46 days later, the mice were sacrificed, and the tumors were collected and weighted on a digital balance.
Bioinformatics analysis
The microarray data were downloaded from The Cancer Genome Atlas website (TCGA, https://cancergenome.nih. gov/) for the GC project (Access id: TCGA-STAD-exp-HiSeq). RTKN expression was compared between GC tissues (n=249) and normal gastric mucosa (n=33). Gene set enrichment analysis (GSEA) was conducted as previously described based on TCGA dataset with the GSEA Software version 2.0 from the Broad Institute at MIT.Citation31
Statistical analysis
Experimental data are presented as mean ± SD of three independent replicates. Statistical analysis was performed with GraphPad Prism Software 6.0 (SanDiego, CA, USA). The association between RTKN expression and clinicopatho- logical features were assessed using the Fisher’s exact test. Kaplan–Meier survival and log-rank analysis were done to determine the association between RTKN expression and overall survival of GC patients. Two-tailed Student’s t-test was used to compare results between two groups, while one-way ANOVA followed by Dunnett’s multiple comparison was used to compare among three or more groups. P<0.05 was considered significantly different.
Ethics approval and consent to participate
The use of human tissue microarray was approved by Ethics Committee of Putuo Hospital (Shanghai, China) in accordance with the Declaration of Helsinki. The animal experiments were approved by the Animal Research Committee in Putuo Hospital, Shanghai University of Traditional Chinese Medicine, and performed following the guidelines for the Care and Use of Experimental Animals of Shanghai University of Traditional Chinese Medicine.
Results
Upregulated RTKN expression correlated with poor prognosis of GC patients
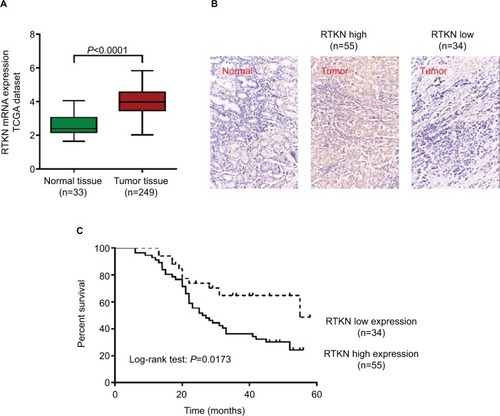
We first analyzed RTKN expression using TGGA GC dataset, microarray data from ArrayExpress (Access id: TCGA-STAD-exp-HiSeq). As a result, RTKN mRNA expression was significantly higher in GC tissues than in normal gastric mucosa (P<0.0001, ). Immunohistochemistry analysis in a GC tissue microarray that contains 89 pairs of GC tissues and adjacent normal tissues also indicated the upregulated RTKN expression in GC tissues. Further, the 89 GC patients were divided into two groups: RTKN high group (n=55) and RTKN low group (n=34; ), and the association between RTKN expression levels and clinical characteristics was assessed. Notably, RTKN overexpression was strongly associated with tumor size (P=0.0265), TNM stage (P=0.0162), and lymph-node metastasis (P=0.0010; ). Kaplan–Meier analysis showed that upregulated RTKN expression was correlated with the poor prognosis of GC patients within 5 years ().
Table 2 The relationship between expression level of RTKN and clinical characteristics in gastric cancer (n=89)
Figure 1 Upregulated RTKN expression correlated with poor prognosis of GC patients.
Notes: (A) RTKN expression was significantly increased in GC tissues when compared with the normal tissues based on TCGA-STAD-exp-HiSeq. (B) IHC analysis of RTKN protein expression in GC tissues and adjacent normal tissues. Magnification: 200×. (C) The overall survival analysis of 89 patients with GC.
Abbreviations: GC, gastric cancer; IHC, immunohistochemistry; TCGA, The Cancer Genome Atlas.
Downregulation of RTKN inhibited GC cell proliferation
Then, we assessed the mRNA and protein expression levels of RTKN in four GC cells – AGS, MKN-45, SGC-7901, and MGC-803 – by real-time PCR and Western blot (). Two cell lines, MKN-45 and SGC-7901, showed higher expression. Then, MKN-45 and SGC-7901 cells were transduced with RTKN shRNAs (shRTKN#1, #2, or #3) or control shRNA (shNC). As shown in , shNC had no effects on RTKN protein expression when compared with cells without any treatment (Control). RTKN shRNAs obviously reduced RTKN protein expression in both cells, among which shRTKN#1 had the best knockdown efficiency and was selected for the subsequent assays. Real-time PCR results showed a similar trend of RTKN mRNA expression ().
Figure 2 RTKN knockdown inhibited GC cell proliferation in vitro and in vivo.
Notes: (A–D) MKN-45 and SGC-7901 cells were transduced with RTKN shRNAs (shRTKN#1, #2, or #3) or control shRNA (shNC) lentivirus. RTKN protein (A, B) and mRNA (C, D) levels were evaluated at 48 hours post transduction. Cells without any treatment served as negative control. (E, F) CCK-8 assay of MKN-45 and SGC-7901 cells transduced with shRTKN#1 (shRTKN) or shNC. In vitro experiments were performed three times independently. Data are presented as mean ± SD. Representative images for Western blotting are shown. (G–I) SGC-7901 cells stably transduced with shNC or shRTKN were subcutaneously injected into athymic nude mice (n=6 per group). Tumor diameter and volume (G) were evaluated for 46 days. At day 46, mice were sacrificed, and tumors were photographed (H) and weighted (I). **P<0.01, ***P<0.001 vs shNC.
Abbreviations: CCK-8, Cell Counting Kit-8; GC, gastric cancer.
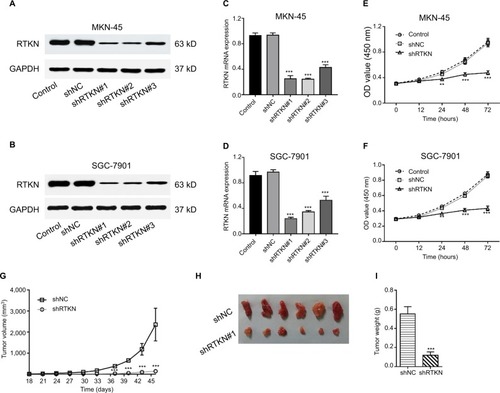
The effects of RTKN knockdown on cell growth at 12, 24, 48, and 72 hours were assessed by CCK-8 assay. Results showed that RTKN shRNA had proliferation-inhibiting property in MKN-45 and SGC-7901 cells compared with shNC at 24, 48, and72 hours post transduction ().
RTKN shRNA inhibited GC growth in nude mice xenograft model
Next, we determined whether RTKN shRNA could reduce tumor growth in vivo. SGC-7901 cells stably expressing shNC or shRTKN were injected into athymic nude mice respectively, and tumor volumes were measured for 46 days. The xenografts of shRTKN group grew slower than the shNC tumors in mice (). At 46 days after inoculation, the size and the weight of shRTKN group were less than half of the shNC tumors (). These data indicated that downregulation of RTKN inhibited tumor growth in nude mice.
RTKN shRNA arrested G0/G1 cell cycle transition and induced apoptosis in GC cells
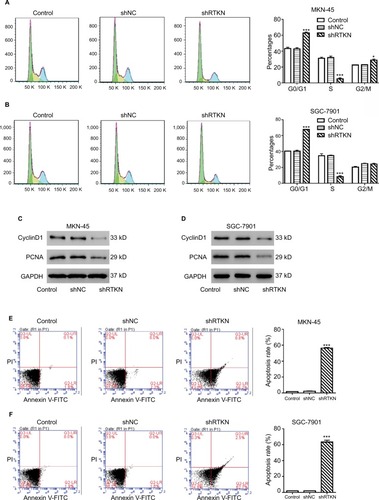
To explore how RTKN shRNA inhibited proliferation, we investigated the effects of RTKN on cell cycle and cell apoptosis. The increment of G0/G1-phase cells and the reduction of S-phase cells were observed in MKN-45 and SGC-7901 cells transduced with shRTKN when compared with those transduced with shNC (). The protein levels of cell cycle-related proteins, CyclinD1 and PCNA, were also reduced by RTKN shRNA (). As indicated by Annexin V-FITC/PI staining assay, knockdown of RTKN significantly induced cell apoptosis compared with shNC (). On the contrary, the levels of ATP and lactate dehydrogenase were reduced when RTKN expression was knocked down ().
Figure 3 RTKN shRNA arrested G1/S cell cycle transition and induced apoptosis in GC cells.
Notes: MKN-45 and SGC-7901 cells were transduced with shRTKN#1 (shRTKN) or shNC. Cells without any treatment served as negative control. (A, B) Cells were stained with PI and cell cycle distribution was analyzed by using flow cytometry. (C, D) Protein levels of CyclinD1 and PCNA were evaluated by Western blotting. (E, F) Cells were stained with Annexin V-FITC/PI, and apoptotic rates were analyzed by using flow cytometry. Experiments were performed three times independently. Representative images are shown. Data are presented as mean ± SD. *P<0.05, ***P<0.001 vs shNC.
Abbreviations: FITC, fluorescein isothiocyanate; GC, gastric cancer; PI, propidium iodide.
Effects of RTKN shRNA on the p53 pathway
We then performed GSEA to identify RTKN-associated pathways based on TCGA GC dataset. The results showed that KEGG p53 pathway was strongly associated with RTKN expression ().
Figure 4 Effects of RTKN shRNA on the p53 pathway.
Notes: (A) GSEA was performed using TCGA GC dataset. The p53 pathway was identified with the strongest association with RTKN. (B, C) mRNA expressions of p53 and three p53 target genes were evaluated by real-time PCR in MKN-45 and SGC-7901 cells transduced with shRTKN#1 (shRTKN) or shNC. ***P<0.001 vs shNC. (D, E) Protein levels of p53, acetylated p53 (Ace-p53), and three p53 target genes were detected by Western blotting. (F, G) SGC-7901 cells were treated with pLVX-RTKN (OE)/ pLVX-puro (Vector) and 50 µM PDTC (Selleck Chemicals, Houston, TX, USA)/DMSO. mRNA and protein expression of three p53 target genes were detected. ***P<0.001 vs Vector + DMSO; ###P<0.001 vs OE + DMSO. Experiments were performed three times independently. Data are presented as mean ± SD. Representative images for Western blotting are shown.
Abbreviations: GC, gastric cancer; GSEA, gene set enrichment analysis; PDTC, pyrrolidine dithiocarbamate; TCGA, The Cancer Genome Atlas.
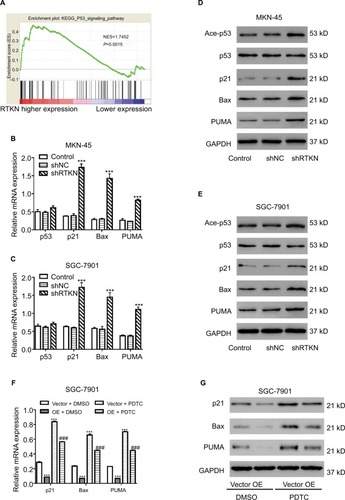
We further detected the mRNA and protein levels of p53 and several p53 target genes. As illustrated in , RTKN shRNA enhanced the transcription and translation of p21, Bax, and PUMA in both GC cell lines, while the total protein and mRNA levels of p53 were not affected by RTKN knockdown. Meanwhile, the p53 acetylation (Lys382 and Ace-p53) was also increased by RTKN shRNA in both GC cell lines ().
A previous study has reported that the anti-apoptosis role of RTKN in GC cells is dependent on the activation of NF-κB.Citation24 The NF-κB activation may be associated with p53 pathway.Citation32,Citation33 We then overexpressed RTKN and inhibited NF-κB with PDTC in SGC-7901 cells. Results showed that PDTC enhanced the transcription and translation of p21, Bax, and PUMA in cells overexpressing RTKN, suggesting that these genes were also correlated with NF-κB activation ().
HDAC1 mediated the effect of RTKN in p53 acetylation, cell cycle arrest, and cell apoptosis
It has been reported that HDAC Class I members (HDAC1, 2, 3, and 8) are able to deacetylate p53 and downregulate the function of p53.Citation34 GSEA on TCGA dataset showed a positive correlation between the HDAC Class I pathway and RTKN expression in GC tissues (). The mRNA levels of HDAC Class I members were analyzed in MKN- 45 and SGC-7901 cells with RTKN knockdown. We found that HDAC1 was decreased the most (), and we speculated that HDAC1 was involved in the effects of RTKN on p53 acetylation in GC cells. To test this speculation, we overexpressed RTKN and knocked down HDAC1 in SGC-7901 cells. Results showed that RTKN overexpression enhanced HDAC1 expression, but suppressed the p53 acetylation, while HDAC1 knockdown had reverse effects. RTKN overexpression could not affect the p53 acetylation in HDAC1 knockdown cells (). The alteration of the three p53 target genes was consistent with the changes of the p53 acetylation ().
Figure 5 Effects of RTKN shRNA on HDAC1 expression.
Notes: (A) GSEA plot showed that the HDAC Class I pathway was strongly associated with RTKN expression on TCGA GC dataset. (B, C) The mRNA levels of HDAC Class I members in MKN-45 and SGC-7901 cells transduced with shRTKN#1 (shRTKN) or shNC. *P<0.05, **P<0.01, ***P<0.001 vs shNC.
Abbreviations: GC, gastric cancer; GSEA, gene set enrichment analysis; HDAC, histone deacetylase; TCGA, The Cancer Genome Atlas.
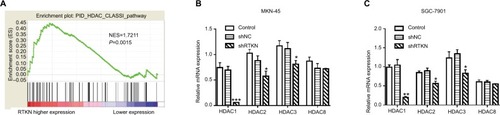
Figure 6 HDAC1 mediated the effect of RTKN in p53 acetylation, cell cycle arrest, and cell apoptosis.
Notes: SGC-7901 cells were treated with pLVX-RTKN (OE)/pLVX-puro (Vector) and HDAC1 siRNA (siHDAC1)/control siRNA (siNC). (A) Western blotting analysis was performed and representative images are shown. (B) Real-time PCR was conducted to detect the mRNA expression of interested genes. (C) Cells were stained with PI and cell cycle distribution was analyzed by using flow cytometry. (D) Cells were stained with Annexin V-FITC/PI and apoptotic rates were analyzed by using flow cytometry. Experiments were performed three times independently. **P<0.01, ***P<0.001 vs Vector + siNC; ###P<0.001 vs OE + siNC; $P<0.05 vs Vector + siHDAC1.
Abbreviations: FITC, fluorescein isothiocyanate; HDAC, histone deacetylase; PI, propidium iodide.
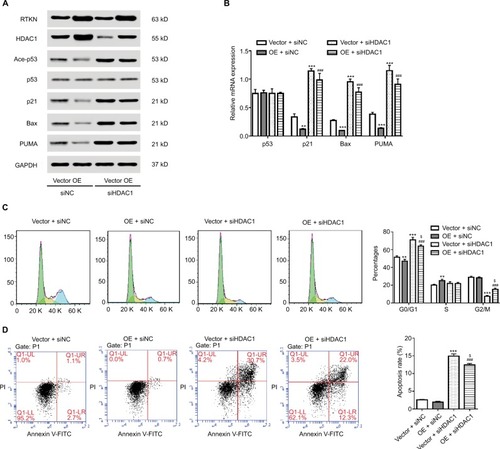
Results of flow cytometry analyses showed that HDAC1 knockdown arrested G1/S cell cycle transition and induced apoptosis, which was slightly affected when RTKN was simultaneously overexpressed (). These data indicated that HDAC1 was involved in the functions of RTKN on p53 acetylation, cell cycle arrest, and cell apoptosis in GC cells.
Discussion
RTKN was initially identified as a putative target for Rho.Citation14 RTKN is overexpressed in GCCitation22 and bladder cancer.Citation23 In the present study, consistent with the previous report,Citation22 clinical data showed that RTKN was highly expressed in GC tissues based on our own cohort and TCGA dataset. More importantly, we firstly revealed the association between RTKN expression levels and tumor size, TNM stage, lymph-node metastasis, and overall survival. Our findings further supported that RTKN may serve as a useful prognosis marker for GC.
The possible functions of RTKN in cancer cells have been studied. RTKN interacts with S100A4 and contributes to invasive growth of MDA-MB-231 breast cancer cells.Citation21 RTKN overexpression inhibits GC cell apoptosis, which is dependent on Rho activity and NF-κB activation.Citation22,Citation24 Here, we found that knockdown of RTKN in GC cells significantly decreased cell proliferation and arrested cells at G0/G1 stage. Further in vivo tumor formation assay suggested that knockdown of RTKN in GC cells hindered the growth of xenografts. In line with the previous studies,Citation22,Citation24 downregulation of RTKN stimulated cell apoptosis and impaired mitochondrial function targeting cell cycle-related protein, and NF-κB pathway may be applied for cancer therapy.Citation35–Citation38 Thus, RTKN may serve as a potential therapeutic target for GC.
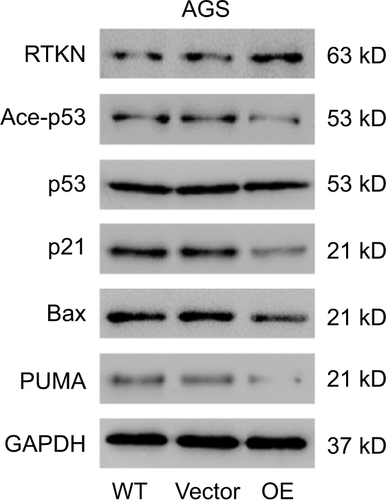
p53 is a key mediator of cell cycle progression, cell apoptosis, and DNA repair.Citation25,Citation26 Altered expression and mutation of p53 gene have been reported in various human cancers, such as bladder cancer, hepatocellular carcinoma, and GC.Citation27–Citation29 Here, GSEA with TCGA dataset identified that RTKN expression was correlated with the p53 signaling pathway. The acetylation levels of p53 correlate with the activation and stabilization of p53.Citation30 We, therefore, evaluated the effects of RTKN knockdown on the p53 acetylation, and the expression of p53 target genes, p21, Bax, and PUMA. p21, a cyclin-dependent kinase inhibitor, is known to inhibit G1/S transition.Citation39 Bax and PUMA, two proapoptotic proteins, promote the apoptosis of GC cells.Citation40 The results showed that the p53 acetylation, and the mRNA and protein levels of all three p53 target genes were obviously increased by RTKN knockdown. On the contrary, RTKN overexpression in AGS cells, which had a relatively lower level of RTKN, showed opposite effect on the protein levels of p53 acetylation, p21, Bax, and PUMA (). Thus, it seems that RTKN performs its biological function through the p53 pathway. The antiapoptosis role of RTKN in GC cells has been suggested to be mediated by NF-κB activation.Citation24 The association between NF-κB activation and p53 pathway has been studied.Citation32,Citation33 Here, we found that the NF-κB inhibitor pyrrolidine dithiocarbamate (PDTC) enhanced the transcription and translation of p21, Bax, and PUMA in cells overexpressing RTKN, suggesting that the p53 pathway was also correlated with NF-κB activation. Our findings further enhance the understanding of the roles and mechanisms of RTKN in gastric tumorigenesis.
Then, we tried to investigate how RTKN regulated the acetylation of p53. HDAC Class I members (HDAC1, 2, 3, and 8) are able to deacetylate p53 and downregulate the function of p53.Citation34 Here, we revealed a positive correlation between the HDAC Class I pathway and RTKN expression in GC tissues by GSEA. Among the four HDAC Class I members, the most obvious inhibitory effect was found in HDAC1 mRNA expression. We found that RTKN overexpression can hardly rescue the inhibitory influence on cell proliferation, migration, and invasion caused by HDAC1 knockdown. These data suggest that RTKN may serve as a tumor suppressor for GC through regulating HDAC1 expression.
Conclusion
In summary, we demonstrated that RTKN promoted the proliferation through inducing cell cycle progression and inhibiting cell apoptosis in GC cells, and RTKN might exert its biological functions through the HDAC1/p53 pathway. RTKN may serve as an oncogene during gastric tumorigenesis and as a novel target for developing therapeutic approaches to GC treatment, although an in-depth study is required to further validate its therapeutic function.
Acknowledgments
We dedicate our sincere gratitude to Dr Guang-Bo Ge who gave us so much useful advice on writing and improving the manuscript. This work was supported by the Health System Independent Innovation Science Foundation of Shanghai Putuo District (ptkwws201704); Shanghai Youth Training Program for Clinical Medical Technician [(2018)02]; and academic leader candidate of Health and Family Planning Commission System Project in Putuo District, Shanghai (18Q-RC-07).
Supplementary materials
Figure S1 RTKN protein (A) and mRNA (B) levels were evaluated in four GC cell lines.
Abbreviation: GC, gastric cancer.
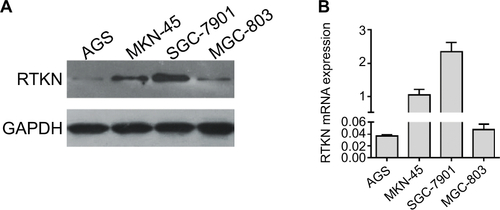
Figure S2 RTKN shRNA decreased ATP content and LDH level in GC cells.
Notes: MKN-45 and SGC-7901 cells were transduced with shRTKN#1 (shRTKN) or shNC. Cells without any treatment served as negative Control. Also, 48 hours later, cell lysate was processed for the measurement of ATP content (A, B) and LDH (C, D) by using commercial kits (Nanjing Jiancheng Bioengineering Institute, Nanjing, China) following the manufacturer’s protocols. Experiments were performed three times independently. Data are presented as mean ± SD. ***P<0.001 vs shNC.
Abbreviations: GC, gastric cancer; LDH, lactate dehydrogenase.
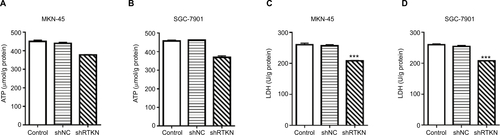
Figure S3 Effects of RTKN overexpression on the p53 pathway.
Notes: AGS cells were treated with pLVX-RTKN (OE) or pLVX-puro (Vector). Protein levels of RTKN, p53, acetylated p53 (Ace-p53), and three p53 target genes were detected by Western blotting. Experiments were performed three times independently. Representative images for Western blotting are shown.
Disclosure
The authors report no conflicts of interest in this work.
References
- CompareDRoccoANardoneGRisk factors in gastric cancerEur Rev Med Pharmacol Sci201014430230820496539
- BertuccioPChatenoudLLeviFRecent patterns in gastric cancer: a global overviewInt J Cancer2009125366667319382179
- JemalABrayFCenterMMFerlayJWardEFormanDGlobal cancer statisticsCA Cancer J Clin2011612699021296855
- InoueMTsuganeSEpidemiology of gastric cancer in JapanPostgrad Med J20058195741942415998815
- KimHSLeeHJeungHCAdvanced detection of recent changing trends in gastric cancer survival: up-to-date comparison by period analysisJpn J Clin Oncol201141121344135022128316
- ZouXMLiYLWangHGastric cancer cell lines induced by trichostatin AWorld J Gastroenterol200814304810481518720545
- SiegelRMaJZouZJemalACancer statistics, 2014CA Cancer J Clin201464192924399786
- De AngelisRSantMColemanMPCancer survival in Europe 1999–2007 by country and age: results of EUROCARE--5-a population-based studyLancet Oncol2014151233424314615
- UemuraNOkamotoSYamamotoSHelicobacter pylori infection and the development of gastric cancerN Engl J Med20013451178478911556297
- KatoMAsakaMRecent development of gastric cancer preventionJpn J Clin Oncol2012421198799423018579
- ZabaletaJMultifactorial etiology of gastric cancerMethods Mol Biol201286341143522359309
- FigueiredoCGarcia-GonzalezMAMachadoJCMolecular pathogenesis of gastric cancerHelicobacter201318Suppl 1283324011242
- HeasmanSJRidleyAJMammalian Rho GTPases: new insights into their functions from in vivo studiesNat Rev Mol Cell Biol20089969070118719708
- ReidTFuruyashikiTIshizakiTRhotekin, a new putative target for Rho bearing homology to a serine/threonine kinase, PKN, and rhophilin in the rho-binding domainJ Biol Chem19962712313556135608662891
- ItoHIwamotoIMorishitaRPossible role of Rho/Rhotekin signaling in mammalian septin organizationOncogene200524477064707216007136
- SudoKItoHIwamotoIMorishitaRAsanoTNagataKIdentification of a cell polarity-related protein, Lin-7B, as a binding partner for a Rho effector, Rhotekin, and their possible interaction in neuronsNeurosci Res200656434735516979770
- ItoHIwamotoIMorishitaRNozawaYAsanoTNagataKIdentification of a PDZ protein, PIST, as a binding partner for Rho effector Rhotekin: biochemical and cell-biological characterization of Rhotekin-PIST interactionBiochem J2006397338939816646955
- WangHHanMWhetsellWJrTax-interacting protein 1 coordinates the spatiotemporal activation of Rho GTPases and regulates the infiltrative growth of human glioblastomaOncogene201433121558156923563176
- ReynaudCFabreSJalinotPThe PDZ protein TIP-1 interacts with the Rho effector rhotekin and is involved in Rho signaling to the serum response elementJ Biol Chem200027543339623396810940294
- NagataKItoHIwamotoIMorishitaRAsanoTInteraction of a multi-domain adaptor protein, vinexin, with a Rho-effector, RhotekinMed Mol Morphol200942191519294487
- ChenMBresnickARO’ConnorKLCoupling S100A4 to Rhotekin alters Rho signaling output in breast cancer cellsOncogene201332323754376422964635
- LiuCAWangMJChiCWWuCWChenJYOverexpression of rho effector rhotekin confers increased survival in gastric adenocarcinomaJ Biomed Sci200411566167015316142
- FanJMaLJXiaSJAssociation between clinical characteristics and expression abundance of RTKN gene in human bladder carcinoma tissues from Chinese patientsJ Cancer Res Clin Oncol2005131315716215599595
- LiuCAWangMJChiCWWuCWChenJYRho/Rhotekin-mediated NF-kappaB activation confers resistance to apoptosisOncogene200423548731874215480428
- FarneboMBykovVJWimanKGThe p53 tumor suppressor: a master regulator of diverse cellular processes and therapeutic target in cancerBiochem Biophys Res Commun20103961858920494116
- SoussiTThe p53 pathway and human cancerBr J Surg200592111331133216240283
- MullerPAVousdenKHp53 mutations in cancerNat Cell Biol20131512823263379
- WadeMLiYCWahlGMMDM2, MDMX and p53 in oncogenesis and cancer therapyNat Rev Cancer2013132839623303139
- MullerPAVousdenKHp53 mutations in cancerNat Cell Biol20131512823263379
- TangYZhaoWChenYZhaoYGuWAcetylation is indispensable for p53 activationCell2008133461262618485870
- ZhangLJLuRSongYNKnockdown of anion exchanger 2 suppressed the growth of ovarian cancer cells via mTOR/p70S6K1 signalingSci Rep201771636228743911
- RyanKMErnstMKRiceNRVousdenKHRole of NF-kappaB in p53-mediated programmed cell deathNature2000404678089289710786798
- PuszynskiKBertolussoRLipniackiTCrosstalk between p53 and nuclear factor-B systems: pro- and anti-apoptotic functions of NF-BIET Syst Biol20093535636721028926
- JuanLJShiaWJChenMHHistone deacetylases specifically down-regulate p53-dependent gene activationJ Biol Chem200027527204362044310777477
- YangGJZhongHJKoCNIdentification of a rhodium(iii) complex as a Wee1 inhibitor against TP53-mutated triple-negative breast cancer cellsChem Commun2018542024632466
- KjWZhongHJYangGSmall molecule Pin1 inhibitor blocking NF-κB signaling in prostate cancer cellsChem Asian J201813327527929288531
- KimSJLeeHWBaekJHActivation of nuclear PTEN by inhibition of Notch signaling induces G2/M cell cycle arrest in gastric cancerOncogene201635225126025823029
- WuKJZhongHJLiGStructure-based identification of a NEDD8-activating enzyme inhibitor via drug repurposingEur J Med Chem20181431021102729232579
- GartelALRadhakrishnanSKLost in transcription: p21 repression, mechanisms, and consequencesCancer Res200565103980398515899785
- LuoCZhuYJiangTMatrine induced gastric cancer MKN45 cells apoptosis via increasing pro-apoptotic molecules of Bcl-2 familyToxicology2007229324525217134813