
Abstract
Background
More than 500,000 people suffered from hepatocelluar carcinoma (HCC) annually and the relative incidence to mortality rate indicates its unfavorable prognosis. Several studies have proved that heme-oxygenase-1 (HO-1) is indirectly engaged in the invasion and the metastasis of some types of malignancies, including breast cancer, prostate cancer, and lung cancer. The role of HO-1 in hepatitis B virus (HBV)-related HCC is still not clarified.
Materials and methods
The Western blot, doubling time, cell cycle analysis, migration assay, invasion assay, gene transfection, xenograft animal model, immunohistochemistry staining, and clinical validation study were applied in this study.
Results
HO-1 overexpression not only decreased the growth but also inhibited the migration and invasion in human HBV-HCC cells (Hep-3B vs PLC/PRF/5). The inhibitory effect on growth, migration, and invasion is further demonstrated by the overexpression of HO-1 in Hep-3B cell by transfection study. Furthermore, HO-1 decreasing the growth of HBV-HCC was confirmed in animal study. The clinical validation illustrated that higher HO1 expression was also associated with favorable disease-free survival of HBV-HCC patients who underwent hepatectomy.
Conclusions
We identified HO-1 as a favorable prognostic factor for HBV-HCC patients who underwent hepatectomy.
Keywords:
Introduction
Hepatocelluar carcinoma (HCC), comprising 80% of primary hepatic cancers, affects more than 500,000 people annually and ranked number four of tumor-related deaths globally.Citation1 The relative incidence to HCC’s mortality rate indicates its unfavorable prognosis.Citation1 Chronic hepatitis B virus (HBV) infection is the most important etiologic agent of HCC accounting for nearly 55%–60% causes of HCC worldwide.Citation2
Currently, partial hepatecotmy still remains the treatment of choice for patients with resectable HCC in noncirrhotic liver. Growing evidences have suggested that liver transplantation and radiofrequency ablation (RFA) of tumor could provide comparable survival benefits when compared with partial hepatectomy, especially when the size of tumors are smaller than 3 cm.Citation3 Unfortunately, most patients with HCC (70%–80%) are diagnosed at intermediate to advanced stageCitation4 and there is no available and effective treatment currently.Citation5,Citation6 For all these advanced HCC patients, who are not fit for radical therapies and have poor response to traditional chemotherapy and radiotherapy, the general survival time is usually <6 months. Under these dismal conditions, it is always a priority to develop a new ammunition in battling HCC.
Heme-oxygenase (HO), the rate-limiting enzyme in the metabolism of heme, works as the catabolism to degrade the heme group into carbon monoxide (CO), free iron, and biliverdin.Citation7 Several research studies also showed that HO-1 overexpression is involved in the pathogenesis and progression of some types of malignancies.Citation8 In tumor-bearing animal model, overexpression of HO-1 induces increased proliferation, viability, and angiogenic potential of melanoma cells as well as augmented metastasis.Citation9 Recent studies have indicated that HO-1 is indirectly implicated in invasion and metastasis of some types of malignancies, such as breast cancer,Citation10,Citation11 prostate cancer,Citation12,Citation13 and lung cancer.Citation14
The role of HO-1 in HCC is still not well clarified, although HO-1 has been shown to repress invasive ability of Hep G2 cell and tumor growth in vivo.Citation15 This study demonstrated the role of HO-1 in HCC in vitro, in vivo, and its clinical impact, especially for hepatitis B-related HCC patients.
Materials and method
Cell culture
Hep3B and PLC/PRF/5 cells (human HCC cells that express HBV) were purchased from Bioresource Collection and Research Center (60434 and 60223, Hsinchu, Taiwan) and maintained a previously described.Citation16
The assay of cell proliferation by WST-1 kit
Hep3B, PLC/PRF/5 cells, HO-1 transfected Hep3B, and the mock-transfected Hep3B cells were placed at proximate 1,000 cells per cm2 in a Costar® 48 Well Clear TC-Treated Multiple Well Plates (#3548; Corning Incorporated, Corning, NY, USA). The viable cells were evaluated by Cell Proliferation Reagent WST-1 (#11 644 807 001; Hoffman-La Roche Ltd., Basel, Switzerland).
Transwell filter migration assay
The migration assay was conducted as described previously.Citation17 After 24 hours, the migrating cells were stained and counted under four random high-power microscopic fields (100×) per filter. The experiments were performed in triplicates.
Matrigel invasion assay
The matrigel invasion assay was performed as previously described.Citation17 Briefly, 600 µL of RPMI 1640 medium with 10% FBS was added to the lower chamber of the 24 well-plate. Next, 100 µL of cells suspension at a density of 2×10⁵ cells/mL were cultured in serum-free RPMI 1640 medium in the upper well. The plates were incubated in 5% CO2 atmosphere at 37℃ for 24 hours. The cells that migrated to the opposite side of the matrigel-coated membrane were fixed in 4% paraformaldehyde (0.4% NaOH, 4% paraformaldehyde, and 3.8% hydrated sodium borate, pH 9.5). The number of invading cells were digitally photographed and counted under the microscope (IX71; Olympus Corporation, Tokyo, Japan). Experiments were performed in triplicates and repeated at least three times.
HO-1 expression vector and stable transfection
The full-length of the human HO-1cDNA clone (MGC: 45655) were purchased from Thermo Fisher Scientific (Waltham, MA, USA). The human HO-1 expression vector was constructed by cloning the HO-1 cDNA into the pcDNA3.1/Zeo expression vector (Thermo Fisher Scientific), with Hind III and Eco R1 sites. Proper ligation was confirmed by extensive restriction mapping and sequencing. Electroporation was conducted using an ECM 830 Square Wave Electroporation System (BTX, San Diego, CA, USA), set at 180 V, 70-ms pulse length, and one pulse setting. Transfected Hep3B cells were selected by 100 µg/mL of Zeocin (Thermo Fisher Scientific). For the construction of the mock-transfected HCC cells, the cells were transfected with a controlled pcDNA3.1/Zeo expression vector (Thermo Fisher Scientific) and were clonally selected in the same manner as described above.
Cell cycle analysis
Cells were first serum starved for 24 hours before analysis as previously described.Citation17 Cell cycle analysis was performed using FACS-Calibur cytometer and Cell Quest Pro software (BD Biosciences, San Jose, CA, USA).
Western blot
The procedures for protein extraction, blocking, and immunodetection were described previously.Citation18 The primary antibodies used in this study were monoclonal antibodies against HO-1 (1:1,000, GENETEX #GTX101147; Gene-Tex Inc., Irvine, CA, USA), CDK4 (#2906; Cell Signaling Technology, Irvine, CA, USA), CDK6 (#3136; Cell Signaling Technology), cyclin D3 (#2936; Cell Signaling Technology), E-cadherin (1:1,000, #3195; Cell Signaling Technology), N-cadherin (1:1,000, #13116; Cell Signaling Technology), Snail (1:1,000, #3879; Cell Signaling Technology), and Vimentin (1:400, #V6630; Sigma-Aldrich Co., St. Louis, MO USA). The secondary antibodies were anti-rabbit (111-035-003; Jackson ImmunoResearch Laboratories, Inc., West Grove, PA, USA) or anti-mouse secondary antibodies (Zymed 81–6520; 1:5,000). The blots were detected using ECL reagents (WBKLS0500; EMD Millipore, Billerica, MA, USA). Membranes were detected by VersaDoc™ Imaging System (Bio-Rad Laboratories Inc., Hercules, CA, USA) for analysis.
F-actin staining
The cells were seeded onto glass bottom culture dishes (MatTek, Ashland, MD, USA) precoated with 50 mL fibronectin and allowed to attach overnight. Then the cells were fixed with 3.7% formaldehyde, permeabilized with 0.1% Triton X-100, and blocked in 1% BSA at room temperature. F-actin protein expression was detected by incubation with Texas Red X-Phalloidin, and immunofluorescence was examined using confocal microscopy (LSM510 Meta; Zeiss, Oberkochen, Germany) as previously described.Citation19
Xenograft animal model
The animal use protocol had been reviewed and approved by the Institutional Animal Care and Use Committee (IACUC) of Chang Gung Memorial Hospital (CGMH) (IACUC 2014032605), and the Committee recognized that the proposed animal experiment follows the Animal Protection Law by the Council of Agriculture. Executive Yuan, R.O.C. and the guidelines as shown in the Guide for the Care and Use of Laboratory Animals as promulgated by the Institute of Laboratory Animal Resources, National Research Council, USA. In all the procedures, every effort was made to minimize the suffering of the laboratory animals and the number of animals used as described previously. We obtained male nude mice (BALB/cAnN-Foxn1) from the National Laboratory Animal Center, Taiwan, at age 4 weeks. One week later, the mice were anesthetized by intraperitoneal ketamine (100 µg/mL)-xylazine (10 µg/mL) at a dose of 50 µL/Kg body weight. The cells were detached from cell flask by treatment with 0.5 µM EDTA in PBS solution and washed with RPMI1640 medium with 10% FCS. Then, the cells were resuspended in a PBS solution at the concentration indicated. About 1×10⁷ cells/100 µL were injected subcutaneously on the right and left lateral back wall in close proximity to the shoulder of each mouse. We then measured the growth of the xenografts by Vernier caliper measurements, taken every 2–3 days. The tumor volume will be determined by the formula: volume=π/6×larger diameter × (smaller diameter)Citation2.Citation17 The pathological examination will be performed by two investigators at the Department of Pathology, CGMH.
Immunohistochemical staining of 70 human HCC tissues for HO-1
A total of 70 HBV-HCC specimens were obtained from patients admitted to the Chang Gung Memorial Hospital for curative hepatectomy. Curative hepatectomy is defined as patient with HCC undergoing hepatic resection with negative microscopic margin. The protocol was approved by the IRB of the Chang Gung Memorial Hospital (Approval: IRB 103-1827B; this study was conducted in accordance with the Declaration of Helsinki). All the 70 HBV-HCC patients provided written informed consent. HO-1 expression levels in the aforementioned 70 HCC patients were examined by immunohistochemical staining. Tissue sections (4 µm) prepared from the formalin-fixed, paraffin-embedded hepatectomy specimens were incubated with the primary antibody against HO-1 (#ab52947, 1:250 dilution; Abcam, Cambridge, UK) at 4°C overnight. After washing three times with TBST (5 minutes each), the signals were visualized with the Dako Labelled Streptavidin-Biotin2 (LSAB2) System-HRP (No. K0675; Dako Denmark A/S, Glostrup, Denmark). Control slides were incubated with the secondary antibody only. For the assessment of immunohistochemical staining, the percentage of stained target cells was evaluated in ten random microscopic fields per tissue section (400× magnification), and their averages were subsequently calculated. Staining intensities were scored as 1 (mild), 2 (moderate), or 3 (strong). H scores were calculated as the percentage of positive staining (0–100) × the corresponding staining intensity (0–3). Specimens with H-scores of <60 or ≥60 were classified as having low or high expression, respectively (range: 5–295; median 100).
Statistical analysis
All data were presented as percentage of patients or mean with SD. Numerical data were compared by independent two-sample t tests. Nominal data were compared by Pear-son chi-squared test, Fisher’s exact test, or multiple forward stepwise logistic regression test when appropriate. Survival was calculated and plots constructed according to the Kaplan–Meier method. Furthermore, the log-rank test was performed for a statistical univariate analysis of prognostic variables. All aforementioned factors were input for Cox proportional hazard model once statistical significance proved by univariate analysis. An “enter-selection” procedure to select the most relevant prognostic factors and only factors that remained significant (P<0.05) were included in the final model. We performed all statistical analyses using IBM SPSS Statistics for Windows (ver. 20.0; IBM Corporation, Armonk, NY, USA). Furthermore, P<0.05 was considered statistically significant.
Results
Increasing intracellular HO-1 protein levels decreased cell growth, invasion, and migration between Hep3B and PLC/PRF/5 cells
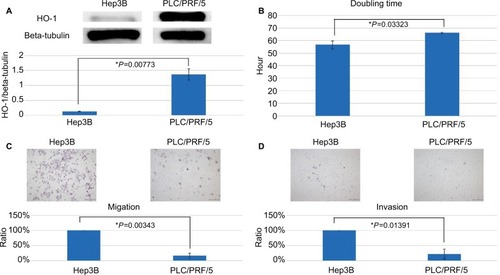
Significantly decreased intracellular HO-1 protein level was shown in Hep3B cells compared with PLC/PRF/5 cells (). As shown in , the double time of Hep3B cells or PLC/PFR/5 cells is 56.6±3.3 or 66.2±0.5 hours, respectively. To evaluate if HO-1 could affect cell metastatic ability of Hep3B or PLC/PFR/5 cells, migration and invasion assays were thus conducted. shows that PLC/PFR/5 cells had only 17%±8.4% migration ability when compared with Hep3B cells (100%). HO-1 overexpression also reduced cell invasion ability to 22%±16.1% in PLC/PFR/5 cells when compared with Hep3B cells (100%) ().
Figure 1 Influence of intracellular HO-1 protein levels on cell growth, invasion, and migration between Hep3B and PLC/PRF/5 cells.
Notes: (A) Significantly decreased intracellular HO-1 protein level was shown in Hep3B cells compared with PLC/PRF/5 cells. (B) The double time of Hep3B cells or PLC/PFR/5 cells is 56.6±3.3 or 66.2±0.5 hours, respectively. (C) To evaluate if HO-1 could affect cell metastatic ability of Hep3B or PLC/PFR/5 cells, migration and invasion assays were thus conducted. PLC/PFR/5 cells had only 17%±8.4% migration ability when compared with Hep3B cells (100%). (D) HO-1 overexpression also reduced cell invasion ability to 22%±16.1% in PLC/PFR/5 cells when compared with Hep3B cells (100%).
Abbreviation: HO-I, heme-oxygenase-1.
Raising levels of intracellular HO-1 protein by transfecting cells with the HO-1 expression vector significantly decreased cell growth and induces cell cycle arrest at G1 phase in Hep3B cells
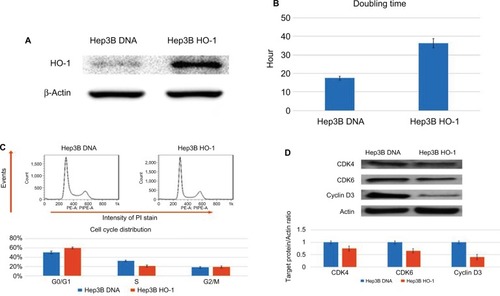
To evaluate the effect of HO-1 overexpression on Hep3B cell growth, HO-1 was overexpressed in Hep3B cells represented by Hep3B HO-1 cells (Hep3B cell with HO-1 overexpression) and mock overexpression of HO-1 in Hep3B cells represented by Hep3B DNA cells (Hep3B cell with mock overexpression of HO-1) (). As shown in , the double time of Hep3B DNA cells or Hep3B HO-1 cells is 17±0.8 or 36±2 hours, respectively. To further investigate how HO-1 influenced Hep3B cell growth, the distribution of cell cycle of Hep3B DNA cells and Hep3B HO-1 cells was then monitored by flow cytometry. demonstrates that Hep3B HO-1 cells had higher percentage of G1 phase cells than Hep3B DNA cells (60%±2% vs 48%±1.2%). The result of Western blot showed that HO-1 overexpression repressed CDK4, CDK6, and Cyclin D3 expression in Hep3B cells ().
Figure 2 Increasing intracellular HO-1 protein levels by transfecting cells with the HO-1 expression vector significantly decreased cell growth and induced cell cycle arrest at G1 phase in Hep3B cells.
Notes: (A) HO-1 was overexpressed in Hep3B cells represented by Hep3B HO-1 cells (Hep3B cell with HO-1 overexpression) and mock overexpression of HO-1 in Hep3B cells represented by Hep3B DNA cells (Hep3B cell with mock overexpression of HO-1). (B) The double time of Hep3B DNA cells or Hep3B HO-1 cells is 17±0.8 or 36±2 hours, respectively. (C) The cell cycle distribution of Hep3B DNA cells and Hep3B HO-1 cells were then analyzed by flow cytometry. Hep3B HO-1 cells had higher percentage of G1 phase cells than Hep3B DNA cells (60%±2% vs 48%±1.2%). (D) The Western blot showed that HO-1 overexpression repressed CDK4, CDK6, and Cyclin D3 expression in Hep3B cells.
Abbreviations: HO-I, heme-oxygenase-1.
HO-1 overexpression decreased the metastatic potential of Hep3B cells
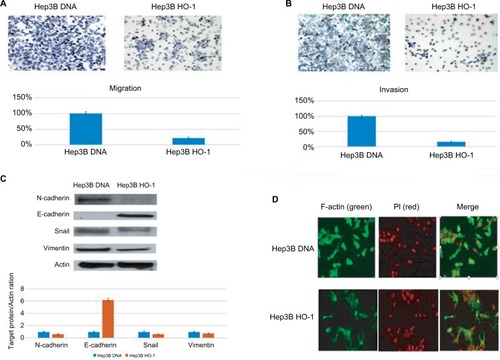
To evaluate if HO-1 could affect cell metastatic ability of Hep3B cells, migration and invasion assays were thus conducted. shows that Hep3B HO-1 cells had only 22%±3% migration ability when compared with Hep3B DNA cells (100%). HO-1 overexpression also reduced cell invasion ability to 17%±3% in Hep3B HO-1 when compared with Hep3B DNA cells (100%) ().
Figure 3 HO-1 overexpression decreased metastatic potential of Hep3B cells.
Notes: (A) Hep3B HO-1 cells had only 22%±3% migration ability when compared with Hep3B DNA cells (100%). (B) HO-1 overexpression also reduced cell invasion ability to 17%±3% in Hep3B HO-1 when compared with Hep3B DNA cells (100%) (). (C) N-cadherin expression was inhibited to 0.6±0.08 fold as HO-1 overexpression, whereas E-cadherin expression was increased to 6.2±0.18 fold by HO-1 overexpression in Hep3B cells. EMT-inducing transcriptional factor, Snail, was downregulated by HO-1 in Hep3B cells with the mesenchymal cell marker, Vimentin, also being inhibited. (D) Hep3B HO-1 cells had lower F-actin expression than Hep3B DNA cells.
Abbreviations: EMT, epithelial–mesenchymal transition; HO-I, heme-oxygenase-1.
Evaluation of the effects of HO-1 on E-cadherin, N-cadherin, Snail, Vimentin, and F-actin expressions in Hep3B cells
Since E- and N-cadherin play vital roles during cell migration and invasion, we investigated whether HO-1 would influence E- and N-cadherin expression in Hep3B cells. shows that N-cadherin expression was inhibited to 0.6±0.08 fold by HO-1 overexpression while E-cadherin expression was increased to 6.2±0.18 fold by HO-1 overexpression in Hep3B cells. Epithelial–mesenchymal transition (EMT) is a process which could make cells more invasive. As shown in , EMT-inducing transcriptional factor, Snail, was downregulated by HO-1 in Hep3B cells with the mesenchymal cell marker, Vimentin, also being inhibited. The HO-1 effect on F-actin synthesis in Hep3B cells was further studied by immunofluorescent stain. shows that Hep3B HO-1 cells had lower F-actin expression than Hep3B DNA cells.
Evaluation of HO-1 effect on tumor growth and tumorigenesis of Hep3B cells in vivo
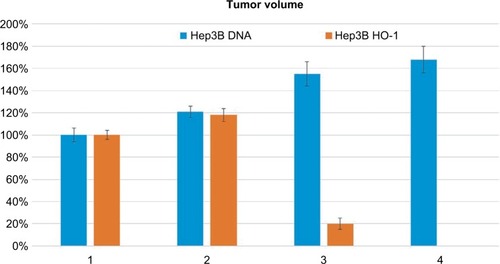
As we conducted xenograft to Hep3B DNA cells and Hep3B HO-1 cells into nude mice, 4 weeks later, the tumor volume increased to 176%±12% in Hep3B DNA cell group (). As for Hep3B HO-1 cells, all the xenografted tumors disappeared after 3 weeks of implantation.
Figure 4 Evaluation of HO-1 effect on tumor growth and tumorigenesis of Hep3B cells in vivo.
Notes: As we xenografted Hep3B DNA cells and Hep3B HO-1 cells into the nude mice, 4 weeks later, the tumor volume increased to 176%±12% in Hep3B DNA cells group. As for Hep3B HO-1 cells, all the xenografted tumors disappeared after 3 weeks of implantation.
Abbreviation: HO-I, heme-oxygenase-1.
Correlations between the expression of HO-1 and clinicopathological characteristics in patients with HBV-HCC undergoing hepatectomy
summarizes the clinicopathological characteristics of 70 HBV-HCC patients, and we continued to analyze the correlations between HO-1 expression efficacy and clinicopathological characteristics in 70 HBV-HCC patients. Among specimens from 70 HBV-HCC patients undergoing hepatectomy, 37 (52.9%) revealed strong HO-1 staining intensity (H-scores ≥50). The interesting finding is that HO-1 upregulation significantly correlated with smaller tumor size, less vascular invasion, and less tumor recurrence; however, no parameter was independently associated with HO-1 over-expression ().
Table 1 Demographic data of 70 HBV-HCC patients
Table 2 Association analysis of HO-1 expression among clinicopathological features of 70 HCC patients with hepatitis B infection
HO-1 overexpression has potential to be a favorable prognostic indicator for HBV-HCC patients undergoing hepatectomy
Univariate log-rank analysis was then conducted to identify the factors that adversely influenced the disease-free survival (DFS) rate in the HCC patients mentioned above. We found that both the presence of symptoms of the disease (vascular invasion and satellite lesion) and the weak staining intensity of HO-1 correlated with inferior DFS (). However, vascular invasion and the weak staining intensity of HO-1 were identified as individualized predictors for an inferior DFS rate in the patients after multivariate Cox proportional hazard analysis (; ).
Table 3 Univariate and multivariate analyses of factors influencing disease-free survival of 70 HCC patients with hepatitis B infection who underwent hepatectomy
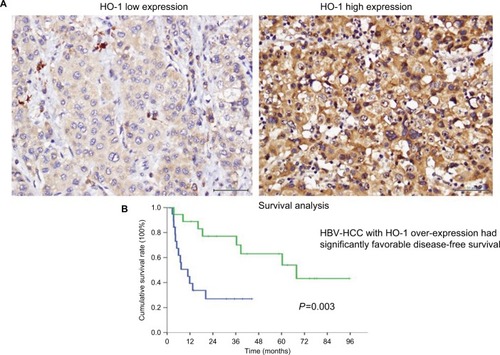
Figure 5 Correlations between HO-1 expression and clinicopathological features in patients with HBV-HCC who underwent hepatectomy.
Notes: (A) Immunohistochemical staining of human HBV-HCC specimen with different intensity scores for HO-1 expression (low and high, respectively; ×400, scale bar =50 µm). (B) Kaplan–Meier plot of disease-free survival in HBV-HCC patients based on HO-1 expression levels. The high HO-1 expression group had favorable disease-free survival (P=0.003). HO-1 high expression is indicated by the green line. HO-1 low expression is indicated by the blue line.
Abbreviations: HBV, hepatitis B virus; HCC, hepatocelluar carcinoma; HO-1, heme-oxygenase-1.
Discussion
Zou et al ever used in vitro and in vivo studies to show that HO-1 inhibits the migration and tumor growth of human HCC cells by suppressing IL-6 expression, irrespective of hepatitis infection.Citation15 However, the function of HO-1 in human HBV-HCC has not been well determined.
HO, the rate-limiting enzyme in the metabolism of heme, works as the catabolism to degrade the heme group into CO, free iron, and biliverdin.Citation7 Isoforms of three mammalian HO have been identified, including HO-1, HO-2, and HO-3, with patterns of distinct tissue-specific expression. For example, HO-1 is inducible, highly expressed in the spleen and liver,Citation8,Citation20 and HO-2 expression is constitutively seen in most tissues except testes and the brain.Citation21 The HO-1 upregulation has been regarded as cyto-protection and reactive response to oxidative stress and other stimuli,Citation22,Citation23 including reactive oxygen species (ROS).Citation24 Chronic virus infection such as HBV may enhance ROS production and cause oxidative stress in host cells.Citation25 Yuan et al ever illustrated that the production of HBV-induced mitochondrial ROS represses the SOCS3 expression through the silencing of Snail-mediated epigenetic, leading to the sustained activation of IL-6/STAT3 pathway and extremely affecting hepato-carcinogenesis.Citation26 This may explain HO-1 expression in most HBV-HCC patients (almost 60% in our clinical cohort).
Our current results strongly suggest that HO-1 may be a suppressor gene in human HBV-HCC. As shown in , human HCC cell (PLC/PRF/5) expressed higher levels of HO1 and has shorter cell doubling time than Hep3B cell. This result together with our finding that higher HO-1 expression attenuated the migration and invasion growth of Hep3B ().
The above observation is further supported by our finding that Hep3B HO-1 cell has longer cell doubling times (). During the progression of cell cycle, the regulative interaction of cyclins and cyclin-dependent kinases plays a vital role during cell cycle phase transition. Cyclins and cyclin-dependent kinase complexes are suppressed by CKIs, resulting in cell cycle arrest. In , two main CDKs are shown to be responsible for the G1/S transition; CDK4 and CDK6 were inhibited by HO-1, resulting in decreasing cell cycle progression into S phase with increasing G1 phase cell population (). D-type cyclins (D3) bind CDK4 and CDK6, and the activity of cyclin D/CDK complexes promote the entry into cell cycle.Citation27,Citation28 Cyclin D/CDK complexes are shown to promote cell cycle progression. Based on these collective results, we concluded that HO-1 decreases the proliferation of Hep3B cell partially through the downregulation of cyclin D/CDK complexes.
The major cause of HCC-related death resulted from intra- or extra-hepatic metastasis of HCC. HCC cell migration and invasion are indispensable before the metastasis. Our studies illustrated that overexpression of HO-1 in Hep3B cells decreases tumor migration and invasion (). E-cadherin, which is an adhesion protein that regulates cell-cell adhesion, is inversely associated with cancer prognosis.Citation29 Its loss may result in cytoskeleton degradation, which increases the motility and invasion of tumor cell. On the contrary, aberrant expression of N-cadherin contributes to tumor migration and invasion.Citation30 In , ectopic expression of HO-1 is shown to increase E-cadherin expression and decrease N-cadherin expression, causing less invasiveness of Hep3B HO-1 cells. EMT, which is also a key factor during tumor metastasis, potentiates cancer cell mobility to metastasis, strengthens resistance to immune system and chemotherapy, and stimulates other stem cell-like characteristics of the cancer.Citation31–Citation33 EMT is also strongly associated with HCC metastasis.Citation34
So far, at least three families of transcription factors are known to promote EMT, including the Snail/Slug, ZEB1/2, and Twist families.Citation35 As shown in , Hep3B HO-1 cells has higher expression of Snail than Hep3B DNA cells. Since the synthesis and polarization of F-actin play a vital role in cell migration,Citation36 we investigated the expression and distribution of F-actin in Hep3B HO-1 and Hep3B DNA cells by applying immunofluorescent staining. In , HO-1 overexpression suppressed the synthesis and polarization of F-actin in Hep3B cells, causing decreased tumor migration. Generally, our results suggested that HO-1 decreased the potential of Hep3B metastasis through E-cadherin upregulation, N-cadherin downregulation, suppression of EMT, and the synthesis and polarization of F-actin. HO-1 suppressing EMT via TGFβ1-dependent ROS productionCitation37 or via inhibiting Numb, a phosphotyrosine-binding domain protein, has been reported in various experimental scenarios.Citation38 However, the real mechanism responsible for the above associations regarding EMT between HBV-HCC and HO-1 needs further investigation.
To further verify the HO-1 functioning in vivo, we conducted xenograft of Hep3B-DNA cells and Hep 3B-HO-1 cells to the nude mice. In , Hep 3B-HO-1 cells induced less tumorigenesis (as for Hep3B HO-1 cells, all the xenografted tumors even disappeared after 3 weeks of implantation) and cancer progression than Hep-3B-DNA cells in vivo. Combining the in vitro outcomes, these data strongly indicate that HO-1 plays as a suppressor gene for HBV-HCC.
All the preclinical results are further validated by clinical cohort, HO-1 upregulation strongly correlated with smaller tumor size, less vascular invasion, and less tumor recurrence, although no parameter was independently associated with HO-1 overexpression. Furthermore and more importantly, vascular invasion and weak HO-1 staining intensity independently associated with unfavorable DFS for HBV-HCC patients who underwent hepatectomy.
Conclusion
Based on our data, HO-1 may play an important role in HBV-HCC progression and tumor metastasis. The in vitro, in-vivo, and clinical correlation demonstrated that HO-1 overexpression decreased proliferation, migration, and invasion in HBV-HCC cells and predicted favorable prognosis for HBV patients who underwent hepatectomy.
Acknowledgments
This work was supported by the Chang Gung Memorial Hospital (CMRPG3B0532, CMRPG3E0702, and CMRPG3E0703 to CN Yeh).
Disclosure
The authors report no conflicts of interest in this work.
References
- ParkinDMBrayFFerlayJPisaniPEstimating the world cancer burden: Globocan 2000Int J Cancer200194215315611668491
- FattovichGBortolottiFDonatoFNatural history of chronic hepatitis B: special emphasis on disease progression and prognostic factorsJ Hepatol200848233535218096267
- LauWYLaiECThe current role of radiofrequency ablation in the management of hepatocellular carcinoma: a systematic reviewAnn Surg20092491202519106671
- TsuzukiTSugiokaAUedaMHepatic resection for hepatocellular carcinomaSurgery199010755115202159190
- LlovetJMBurroughsABruixJHepatocellular carcinomaLancet200336293991907191714667750
- SangiovanniADel NinnoEFasaniPIncreased survival of cirrhotic patients with a hepatocellular carcinoma detected during surveillanceGastroenterology200412641005101415057740
- MainesMDThe heme oxygenase system: past, present, and futureAntioxid Redox Signal20046579780115345138
- JozkowiczAWasHDulakJHeme oxygenase-1 in tumors: is it a false friend?Antioxid Redox Signal20079122099211817822372
- WasHCichonTSmolarczykROverexpression of heme oxygenase-1 in murine melanoma: increased proliferation and viability of tumor cells, decreased survival of miceAm J Pathol200616962181219817148680
- LinCWShenSCHouWCYangLYChenYCHeme oxygenase-1 inhibits breast cancer invasion via suppressing the expression of matrix metalloproteinase-9Mol Cancer Ther2008751195120618483307
- KimDHKimJHKimEH15-Deoxy-Delta12,14-prostaglandin J2 upregulates the expression of heme oxygenase-1 and subsequently matrix metalloproteinase-1 in human breast cancer cells: possible roles of iron and ROSCarcinogenesis200930464565419136476
- GueronGDe SierviAFerrandoMCritical role of endogenous heme oxygenase 1 as a tuner of the invasive potential of prostate cancer cellsMol Cancer Res20097111745175519903769
- Alaoui-JamaliMABismarTAGuptaAA novel experimental heme oxygenase-1-targeted therapy for hormone-refractory prostate cancerCancer Res200969208017802419808972
- LiuPLTsaiJRCharlesALResveratrol inhibits human lung adenocarcinoma cell metastasis by suppressing heme oxygenase 1-mediated nuclear factor-kappaB pathway and subsequently down-regulating expression of matrix metalloproteinasesMol Nutr Food Res201054Suppl 2S196S20420461740
- ZouCZhangHLiQHeme oxygenase-1: a molecular brake on hepatocellular carcinoma cell migrationCarcinogenesis201132121840184822016469
- YehCNPangSTChenTWExpression of ezrin is associated with invasion and dedifferentiation of hepatitis B related hepatocellular carcinomaBMC Cancer20099923319604375
- ChiangKCYehCNChungLCWNT-1 inducible signaling pathway protein-1 enhances growth and tumorigenesis in human breast cancerSci Rep201555868625732125
- ChiangKCChenSCYehCNMART-10, a less calcemic vitamin D analog, is more potent than 1α,25-dihydroxyvitamin D3 in inhibiting the metastatic potential of MCF-7 breast cancer cells in vitroJ Steroid Biochem Mol Biol2014139546024125734
- JuangHHChungLCSungHCMetallothionein 3: an androgen-upregulated gene enhances cell invasion and tumorigenesis of prostate carcinoma cellsProstate201373141495150623794209
- SaccaPCaballeroFBatlleAVazquezECell cycle arrest and modulation of HO-1 expression induced by acetyl salicylic acid in hepatocarcinogenesisInt J Biochem Cell Biol200436101945195315203109
- LiuNWangXMcCoubreyWKMainesMDDevelopmentally regulated expression of two transcripts for heme oxygenase-2 with a first exon unique to rat testis: control by corticosterone of the oxygenase protein expressionGene2000241117518310607912
- TakahashiTMoritaKAkagiRSassaSHeme oxygenase-1: a novel therapeutic target in oxidative tissue injuriesCurr Med Chem200411121545156115180563
- GozzelinoRJeneyVSoaresMPMechanisms of cell protection by heme oxygenase-1Annu Rev Pharmacol Toxicol20105032335420055707
- FinkelTOxidant signals and oxidative stressCurr Opin Cell Biol200315224725412648682
- WarisGAhsanHReactive oxygen species: role in the development of cancer and various chronic conditionsJ Carcinog200651416689993
- YuanKLeiYChenHNHBV-induced ROS accumulation promotes hepatocarcinogenesis through Snail-mediated epigenetic silencing of SOCS3Cell Death Differ201623461662726794444
- SherrCJD-type cyclinsTrends Biochem Sci19952051871907610482
- SherrCJRobertsJMLiving with or without cyclins and cyclin-dependent kinasesGenes Dev200418222699271115545627
- BirchmeierWHülskenJBehrensJAdherens junction proteins in tumour progressionCancer Surv1995241291407553658
- DeryckeLDBrackeMEN-cadherin in the spotlight of cell-cell adhesion, differentiation, embryogenesis, invasion and signallingInt J Dev Biol2004485–646347615349821
- ThieryJPAcloqueHHuangRYNietoMAEpithelial-mesenchymal transitions in development and diseaseCell2009139587189019945376
- ScheelCEatonENLiSHParacrine and autocrine signals induce and maintain mesenchymal and stem cell states in the breastCell2011145692694021663795
- ManiSAGuoWLiaoMJThe epithelial-mesenchymal transition generates cells with properties of stem cellsCell200813347043271534
- ChenLGuoPHeYHCC-derived exosomes elicit HCC progression and recurrence by epithelial-mesenchymal transition through MAPK/ERK signalling pathwayCell Death Dis20189551329725020
- PeinadoHOlmedaDCanoASnail, Zeb and bHLH factors in tumour progression: an alliance against the epithelial phenotype?Nat Rev Cancer20077641542817508028
- StrickerJFalzoneTGardelMLMechanics of the F-actin cytoskeletonJ Biomech201043191419913792
- ClarkJSCarterAJDixitMAranyISimvastatin inhibits epithelialto-mesenchymal transition through Induction of HO-1 in cultured renal proximal tubule cellsIn Vivo201630440741127381601
- ZhangZQuJZhengCNrf2 antioxidant pathway suppresses Numb-mediated epithelial-mesenchymal transition during pulmonary fibrosisCell Death Dis2018928329362432