
Abstract
Purpose
There are significant differences in the biological behavior between triple-negative breast cancer (TNBC) and non-triple-negative breast cancer (non-TNBC). In the present study, we identify key differential genes and clinical outcomes between TNBC and non-TNBC.
Materials and methods
Transcriptomic analyses used GEO datasets (GSE76275), gene ontology, KEGG pathway analysis and cBioPortal. Quantitative RT-PCR analysis (qRT-PCR) was used to validate the differentially expressed genes. We used the KM Plotter Online Tool and 240 patients with TNBC tissue microarray to assay the prognostic value of HORMAD1.
Results
The upregulated differentially expressed genes were enriched in transcription factor activity, sequence-specific DNA binding and nucleic acid binding transcription factor activity. Only 16 genes were upregulated when further screened for fold change >4-fold change. HORMAD1 and SOX8 exhibited high frequencies of change of greater than 10% (HORMAD1 was close to 20%). qRT-PCR results indicated that HORMAD1 and SOX8 mRNA levels were significantly upregulated in TNBC samples. In KM Plotter Online Tool, high HORMAD1 was associated with worse outcome. In our tissue microarray (including 240 TNBC tissues), IHC analysis revealed that 29.7% (55/240) of the tumor samples exhibited high HORMAD1 expression and 70.3% (185/240) of the tumor samples exhibited low HORMAD1 expression levels. Meanwhile, high HORMAD1 group has a bad prognosis.
Conclusion
The status of transcriptional activation is an important difference between TNBC and non-TNBC. HORMAD1 is a key differential gene associated with poor outcome in TNBC. Epigenetic therapy and agents targeting cancer/testis antigens might potentially help to customize therapies of TNBC.
Introduction
Breast cancer, the most common malignancy in women, exhibits significant heterogeneity.Citation1 Its molecular type is very important to guide clinical treatments and to judge the prognosis.Citation2 Triple-negative breast cancer (TNBC) accounts for approximately 15%–20% of breast cancer cases and is defined as the absence of estrogen receptor (ER), progesterone receptor (PR) and human epidermal receptor 2 (HER2) amplification.Citation3,Citation4 Due to the absence of druggable molecular targets, the treatment of TNBC is very limited compared with the treatment of luminal or HER2+ subtypes.Citation5
In the past, relevant studies emphasized the difference of clinicopathological features and prognosis of patients between TNBC and non-triple-negative breast cancer (non-TNBC). TNBC patients often exhibit younger age, increased tumor size, and more recurrence and metastasis.Citation6 Compared with non-TNBC patients, TNBC patients exhibit a higher rate of family history of breast cancer.Citation7,Citation8 Blood vessels play a vital role in TNBC, leading to distant metastasis.Citation9 The development of distant metastasis in TNBC is also associated with the presence of central fibrosis and lymphocytic infiltration.Citation10 Moreover, the lack of effective treatment after surgery, chemotherapy and radiotherapy is also an important reason for the poor prognosis of TNBC.Citation11
In the coming post-genomic era, attention will no longer be confined to these clinicopathological features. High-throughput technology is increasingly advanced and widespread.Citation12 Researchers are revealing the mechanism of the disease through high-throughput technology. In the field of cancer research, transcriptional information and gene regulatory networks of malignant tumors have become hot topics. Simultaneously, numerous public databases, such as the Gene Expression Omnibus (GEO), have been developed that serve as repositories of high-throughput gene expression data and hybridization arrays, chips and microarrays.Citation12 These public databases provide great convenience for transcriptomic research. Therefore, based on these public platforms, we explored the transcriptional differences between TNBC and non-TNBC to better understand breast cancer and provide new clues for therapy.
In this study, we compared transcriptomic differences between TNBC and non-TNBC using a GEO database that contained 265 samples. We identified differentially expressed genes, relevant pathways and upregulated genes associated with clinical outcome and used tissue microarray to confirm the prognostic value.
Materials and methods
Microarray data
We extracted gene expression profiles of TNBC and non-TNBC from a GEO database (GSE76275) that contained 265 samples, including 198 TNBC samples and 67 non-TNBC samples. The database was submitted by Burstein et alCitation13 and based on the Agilent GPL570 platform (Affymetrix Human Genome U133 Plus 2.0 Array). Differentially expressed genes were analyzed by GEO2R (https://www.ncbi.nlm.nih.gov/geo/geo2r/).
Gene ontology (GO) and pathway enrichment analysis of differentially expressed genes
Gene set enrichment analyses focused on genes with minimum twofold differential expression values between both groups. GO and KEGG pathway analysis were performed using DAVID Bioinformatics Resources 6.7 (https://david.ncifcrf.gov/), which used the one-tailed Fisher’s exact probability test to determine overrepresentation of genes with altered expression within specific GO categories.Citation14,Citation15 A P-value <0.05 was considered to be statistically significant.
Database search
As an open-access resource, the cBio Cancer Genomics Portal (http://cbioportal.org) data from more than 5,000 tumor samples from 147 cancer studies provides interactive exploration of multidimensional cancer genomics data sets.Citation16,Citation17 The data set contained 9 sets of breast invasive carcinoma samples. Further details on the samples and processing of the database are provided in the cBio Cancer Genomics Portal. We selected four of these sets that contain both mutation and DNA copy number alteration (CNA) information for our study.
Cell lines and clinical samples
A normal mammary epithelial cell line (MCF-10A) and human breast cancer cell lines (MDA-MB-231, BT-549, MDA-MB-468, HCC38, MCF-7, T47D, BT-474 and Skbr3) were obtained from the American Type Culture Collection (Manassas, VA, USA). All of the cell lines were used for only up to 30 passages from authentication and were maintained according to the supplier’s instructions. All cell lines were authenticated by short tandem repeat DNA profiling before use and found to be free of mycoplasma infection. Tissue specimens (26 TNBC and the corresponding paired normal adjacent tissues [Normal 1] and from 22 non-TNBC and the corresponding paired normal adjacent tissues [Normal 2]) were diagnosed by histopathological diagnosis from November 2015 to May 2016. All clinical samples were stored in the Department of Specimens and Resources of Sun Yat-sen University Cancer Center (SYSUCC). Resected breast cancer tissues and paired matched normal mammary tissues were immediately cut and stored in RNAlater (Ambion). Sun Yat-Sen University Cancer Center Institute Research Ethics Committee approved this study (RDDB2018000454), and the collection and use of tissues followed procedures that are in accordance with the ethical standards formulated in the Declaration of Helsinki. All participants provided written informed consent prior to treatment.
Quantitative RT-PCR analysis (qRT-PCR)
Total RNA from the cells or tissues was extracted with TRIzol reagent (Thermo Fisher Scientific, Waltham, MA, USA) according to the manufacturer’s instructions. Reverse transcription and qRT-PCR reactions were performed by means of a SYBR green-containing PCR kit (Qiagen NV, Venlo, the Netherlands). Each reaction mixture consisted of 2.0 ng of cDNA template, 0.3 µL each of forward and reverse primers, and 10 µL of SYBR green mix adjusted with nuclease-free water to a final volume of 20 µL. The primer sequences used are as follows: HORMAD1 forward, 5′-GCCCAGTTGCAGAGGACTC-3′ and reverse, 5′-TCTTGTTCCATAAGCGCATTCT-3′; SOX8 forward, 5′-CCACGAGTTCGACCAGTACC-3′ and reverse, 5′-CTGCAGGAACCGTAGTCGG-3′. β-Actin served as an internal reference in the mRNA quantitative measurement. All of the real-time PCR assays were performed using a Bio-Rad IQTM5 Multi-color Real-Time PCR Detection System (Bio-Rad, Hercules, CA, USA) with three biological replicates and two technical replicates.
Tissue microarray and immunohistochemistry
For the TMA, a series of 240 patients with TNBC diagnosed between 2005 and 2011 at the Sun Yat-sen University Cancer Center, China, was selected. To quantify the level of HOR-MAD1 (Thermo Fisher Scientific, 1:500), all sections were photographed and scored by two independent pathologists. The staining intensity was scored as follows: 0–1 (no staining), 1–2 (weak staining), 2–3 (medium staining) and 3–4 (strong staining). The semi-quantification was performed according to the staining intensity (0%–25%; 26%–50%; 51%–75% and 76%–100%) and the ratio of positively stained cells (0, low staining; 1, moderate staining; 2, high staining and 3, extremely high staining). The overall score was calculated by multiplying the intensity score and percentage score. Expression scores greater than or equal to 2 were defined as high expression, and scores less than 2 were defined as low expression.
Outcome analyses
The KM Plotter Online Tool (http://www.kmplot.com) is a public database that contains information from 3,500 patients and combined survival analysis across multiple microarray datasets, including GEO, caArray and TCGA.Citation18 The tool was utilized to evaluate the relationship between the presence of different genes and patient clinical outcome. Definitions of breast cancer subgroups reported in the online tool are as follows: triple negative: ER-/PR-/HER2-; luminal A/B: ER+/PR±/HER2±; HER2+: ER-/PR-/HER2+ (information for ER/PR and HER2 using immunohistochemical data). The Kaplan–Meier method was used to plot overall survival (OS) curves and relapse-free survival (RFS) curves, and the log-rank test was used for comparison in Sun Yat-sen University Cancer Center cohort (SYSUCC cohort).
Results
Identification of differentially expressed genes
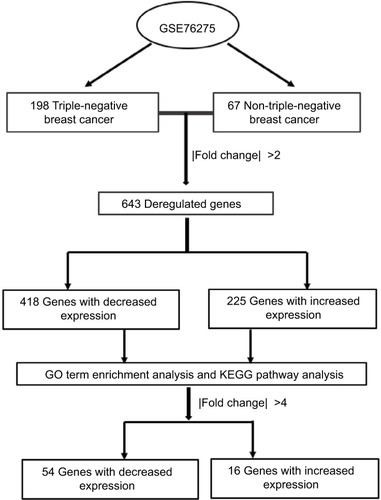
To analyze the differentially expressed genes between TNBC and non-TNBC, we used a GEO dataset of mRNA level data (GSE76275) that contained 198 TNBC samples and 67 non-triple-negative tumor samples (). Based on the GEO2R analysis and using P<0.05 and fold change (FC) >2.0 criteria, a total of 643 differentially expressed genes were identified (225 upregulated and 418 downregulated).
Figure 1 Overview of the study.
Abbreviation: GO, gene ontology.
GO term enrichment analysis and KEGG pathway analysis
Next, we used DAVID Bioinformatics Resources 6.7 to identify overrepresented GO categories and KEGG pathways of the list of differentially expressed genes. As noted in , GO biological processes (BP) analysis results revealed that upregulated differentially expressed genes were significantly enriched in the regulation of gene expression, cell proliferation and cell cycle. The downregulated differentially expressed genes were significantly enriched in regulation of signaling, regulation of cell communication and cellular response to chemical stimulus. For molecular function (MF), the upregulated differentially expressed genes were enriched in transcription factor activity, sequence-specific DNA binding and nucleic acid binding transcription factor activity. The downregulated differentially expressed genes were enriched in receptor binding and identical protein binding. In addition, GO cell component (CC) analysis is also provided in . In the KEGG analysis, the most significantly enriched pathways of the upregulated differentially expressed genes were cell cycle, microRNAs in cancer and the Wnt signaling pathway, whereas the downregulated differentially expressed genes were enriched in the cGMP–PKG signaling pathway, AMPK signaling pathway and pancreatic secretion ().
Table 1 Gene ontology analysis and KEGG pathway analysis of differentially expressed genes
HORMAD1 and SOX8 are key differential genes that are upregulated in TNBC
To narrow the scope to identify more important differentially expressed genes, we further screened |FC|>4.0. Among these genes, only 16 were upregulated whereas 54 were downregulated (Table S1). Then, we focused on the 16 upregulated genes () rather than the 54 downregulated genes because we sought to identify potential therapeutic targets and not tumor suppressor genes. Four databases containing CAV and mutation information in the cBio Cancer Genomics Portal (http://Cbioportal.org) were used to determine the expression of these 16 genes in breast cancer patients (). As shown in , most of these 16 genes exhibited a frequency of alteration between 1% and 3%. Only HORMAD1 and SOX8 exhibited a frequency change of greater than 10% (HORMAD1 was close to 20%). We selected the METABRIC database to further analyze HORMAD1 and SOX8 in different molecular types of breast cancer. The results showed that the amplification ratio of HORMAD1 and SOX8 in TNBC was lower or closer to Luminal A/B, whereas the ratio of mRNA upregulation in TNBC was significantly increased compared with the Luminal A/B and HER2+ subtypes (). Similar results were obtained using the PAM50 classification method (Figure S1).
Figure 2 The 16 upregulation identified genes.
Notes: (A) Details of the frequency alteration of the 16 identified upregulated genes in the cBio Cancer Genomics Portal. (B) The frequency of alteration. (C) HORMAD1 and SOX8 status in different subtypes of breast cancer.
Abbreviations: HER2, human epidermal receptor 2; TNBC, triple-negative breast cancer.
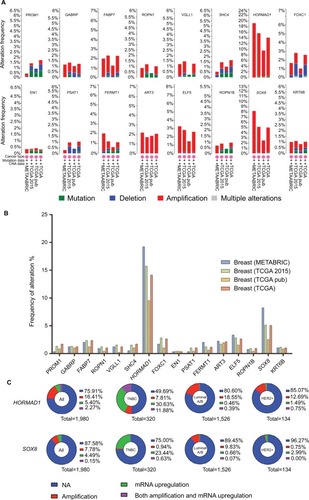
Table 2 The 16 upregulation identified genes
qRT-PCR validation of HORMAD1 and SOX8 in breast cancer cell lines and clinical samples
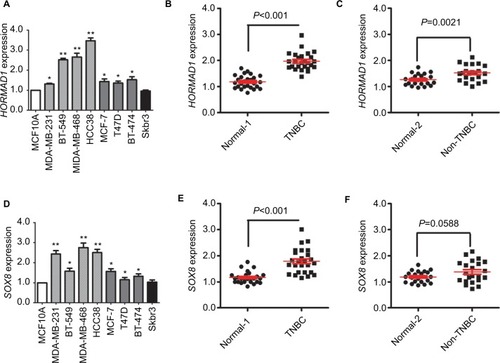
To verify the expression of HORMAD1 and SOX8 in breast cancer, we measured HORMAD1 and SOX8 mRNA levels in 1 normal mammary epithelial cell line and 8 human breast cancer cell lines using a qRT-PCR method. As shown in , compared with the normal mammary epithelial cell line, both HORMAD1 and SOX8 mRNA levels are upregulated in 7 human breast cancer cell lines, especially in TNBC cell lines (including MDA-MB-231, BT549, MDA-MB-468 and HCC38). To confirm these results, we tested HORMAD1 and SOX8 mRNA levels in tissue samples from 26 TNBC patients and 22 non-TNBC patients. qRT-PCR results revealed that HORMAD1 () and SOX8 () mRNA levels were significantly upregulated in TNBC samples.
Figure 3 qRT-PCR validation of HORMAD1 and SOX8 expression in breast cancer.
Notes: HORMAD1 (A) and SOX8 (D) mRNA levels determined by qRT-PCR in a normal mammary cell line and in breast cancer cell lines. β-actin serves as the internal reference. The error bars represent the standard deviations from triplicates of one representative experiment. *P<0.05 and **P<0.01. (B) HORMAD1 mRNA levels in TNBC and the corresponding paired normal adjacent tissues (Normal 1). (C) HORMAD1 mRNA levels in non-TNBC and the corresponding paired normal adjacent tissues (Normal 2). (E) SOX8 mRNA levels in TNBC and the corresponding paired normal adjacent tissues (Normal 1). (F) SOX8 mRNA levels in non-TNBC and the corresponding paired normal adjacent tissues (Normal 2).
Abbreviations: qRT-PCR, quantitative RT-PCR analysis; TNBC, triple-negative breast cancer.
HORMAD1 predicts prognosis in TNBC
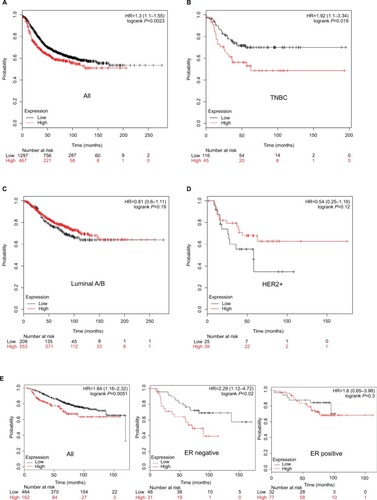
Next, we explored whether HORMAD1 and SOX8 were associated with worse RFS and OS in different subtypes of breast cancer. As described in the “Materials and methods” section, we used the KM Plotter Tool to perform survival analysis. Only HORMAD1 was associated with worse outcome (P=0.0023 for RFS, ), and SOX8 was not useful to assess breast cancer patient prognosis (Figure S2). Based on the molecular subtype of breast cancer, only HORMAD1 was associated with worse RFS in TNBC (P=0.019, ), but not in luminal A/B (P=0.19, ) or HER2+ (P=0.12, ). As shown in , HORMAD1 was also associated with worse OS in breast cancer ( left). Given the limited data for OS, we only compared ER-positive and ER-negative breast cancer patients in the hierarchical analysis of OS. As expected, HORMAD1 was associated with worse OS in ER-negative breast cancer ( middle) but not ER-positive breast cancer ( right).
Figure 4 Association of HORMAD1 with RFS and OS in breast cancer (KM Plotter Tool cohort).
Notes: Kaplan–Meier survival curves of (A) RFS for breast cancer, (B) RFS for TNBC, (C) RFS for Luminal A/B, (D) RFS for HER2+ and (E) OS for breast cancer (left), ER-negative breast cancer (middle) and ER-positive breast cancer (right). Red line = high HORMAD1 group, black line = low HORMAD1 group. The cutoff value between high and low is computed by KM Plotter Tool, and the best performing threshold is used as a cutoff. Number at risk table below graph shows the number of cases that reached the endpoint (number of events), the number of cases that did not reach the endpoint (number censored) and the total number of cases.
Abbreviations: HER2, human epidermal receptor 2; OS, overall survival; RFS, relapse-free survival; TNBC, triple-negative breast cancer.
Moreover, we analyzed the significance of HORMAD1 by IHC and in terms of clinical prognosis, and a Kaplan–Meier survival analysis was conducted using patient disease-free survival (DFS) and OS in 240 TNBC patients’ tumor tissue samples. IHC analysis revealed that 29.7% (55/240) of the tumor samples exhibited high HORMAD1 expression and 70.3% (185/240) of the tumor samples exhibited low HOR-MAD1 expression levels. As shown in , HORMAD1 expression was positively correlated with the tumor size (P<0.001), infiltrated lymph nodes (P=0.002) and TNM stage (I–II vs III–IV; P<0.001) of TNBC. In addition, the survival analysis showed that patients with high HORMAD1 expression presented shorter mean months of DFS and OS than patients with low HORMAD1 expression (P<0.001 for both DFS and OS; ).
Figure 5 Association of HORMAD1 with prognosis in 240 TNBC patients from SYSUCC (SYSUCC cohort).
Notes: (A) DFS curves for 240 TNBC patients with high or low HORMAD1 levels. (B) OS curves for 240 TNBC patients with high or low HORMAD1 levels. Red line = high HORMAD1 group, black line = low HORMAD1 group.
Abbreviations: DFS, disease-free survival; OS, overall survival; SYSUCC, Sun Yat-sen University Cancer Center; TNBC, triple-negative breast cancer.
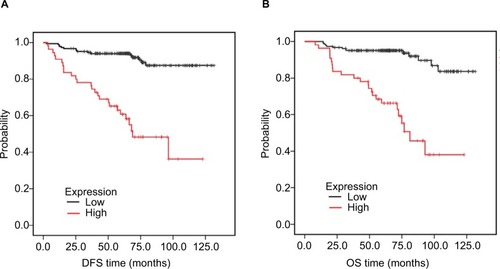
Table 3 Association between HORMAD1 and clinicopathological characteristics in triple-negative breast cancer
Discussion
The subtypes of breast cancer have not only distinct clinical presentations but also distinct prognostic implications.Citation19 Due to high-risk biological characteristics and the lack of the benefit of a specific therapy, TNBC has attracted more attention both clinically and experimentally.Citation6 It is likely that the improvements in survival have currently plateaued for TNBC patients. By contrast, other subtypes of breast cancer patients seem to exhibit better survival. In the present study, we used a GEO database to compare the differences in transcriptomic expression between TNBC and non-TNBC, and these results were validated in METABRIC and TCGA.Citation20 We found that HORMAD1 was a key differentially expressed gene in which mRNA levels might specifically reflect the prognosis of TNBC.
Using GO analysis, we found that the difference between TNBC and non-TNBC is at least partially due to the status of transcriptional activation. The upregulated differentially expressed genes were significantly enriched in the regulation of gene expression and for MF. The upregulated differentially expressed genes were enriched in transcription factor activity, sequence-specific DNA binding and nucleic acid binding transcription factor activity. Analyzing two significant differentially expressed genes, HORMAD1 and SOX8, we observed no significant difference in gene copy number, but the proportion of the mRNA upregulation in TNBC was significantly increased compared with non-TNBC. This phenomenon might suggest that the transcription of TNBC is more active than non-TNBC due to epigenetic regulation. We hypothesize that TNBC and non-TNBC are like identical twins; the main source of the difference is epigenetic rather than genetic sequence differences. If this assumption is correct, it may not be difficult to explain why the tumor molecular subtype of some patients changes after treatment.Citation21 As a result of external intervention, such as chemotherapy and endocrine therapy, the tumor microenvironment and a number of epigenetic genetic changes cause the tumor to change to another phenotype.Citation22–Citation24 Although this point of view should be confirmed by more experimental evidence, epigenetic therapy is a promising therapy in TNBC.Citation25 In KEGG analysis, we found that cell cycle, microRNAs in cancer and the Wnt signaling pathway were upregulated in TNBC, whereas the cGMP–PKG and AMPK signaling pathways were downregulated. Therefore, focusing on these signaling pathways will help us to discover new therapeutic approaches for TNBC.
After we identified key upregulated genes, we validated HORMAD1 and SOX8 mRNA levels in both breast cancer cell lines and clinical samples using qRT-PCR. The results revealed that these two genes were increased in TNBC compared with non-TNBC and normal tissues. HORMA domains are involved in chromatin binding and participate in cell-cycle regulation.Citation26,Citation27 In previous studies, HORMAD1 was identified in developing mouse and mammalian gonads, and expression was restricted to germ cells.Citation28 In mitosis and meiosis, HORMAD proteins act as adaptor proteins to recruit other proteins for DNA repair and checkpoint regulation.Citation29,Citation30 Through the analysis of gene expression, some studies revealed that HORMAD1 might function as an oncogene in several cancers, such as gastric cancer.Citation31,Citation32 However, the clinical significance of HORMAD1 in TNBC has not been fully explored. Our findings suggested that HORMAD1 is one of the most important differently expressed genes between TNBC and non-TNBC. HORMAD1 expression was positively correlated with the tumor size (P<0.001), infiltrated lymph nodes (P=0.002) and TNM stage (I–II vs III–IV; P<0.001) of TNBC. Furthermore, HORMAD1 was a prognostic marker of TNBC in subsequent survival analyses (KM Plotter Tool cohort and SYSUCC cohort). Recently, a study demonstrated that HORMAD1 contributed to homologous recombination deficiency in TNBC, which supports our findings.Citation33 HOR-MAD1 is also known as cancer/testis antigen 46 (CT46) and belongs to a group of germ cell genes that are expressed in cancer.Citation34 Cancer/testis antigens are exclusively expressed in germ cells and exhibit restricted expression in normal tissues.Citation35,Citation36 This characteristic may allow cancer/testis antigens, including HORMAD1, to be used for tumor-specific therapies with minimal side effects. Therefore, further research on the HORMAD1 gene and agents involved in cancer/testis antigens might offer hope for TNBC patients. Our work has some limitations. The GSE76275 dataset is mainly derived from Caucasian and Asian individuals; thus, we do not know whether the results are applicable to other races. Meanwhile, the sample size of KM Plotter Tool cohort is small and the log-rank test for comparing subclasses of tumors according to gene expression might not have enough power to detect differences. The results should be confirmed in large sample size of homogeneous prospective and retrospective studies.
Conclusion
We showed that the status of transcriptional activation is an important difference between TNBC and non-TNBC. In addition, HORMAD1 is a key differentially expressed gene that is associated with poor outcome in TNBC. Epigenetic therapy and agents involved in cancer/testis antigens might have potential utility when customizing therapies for TNBC.
Acknowledgments
This work was supported by funds from the National Natural Science Foundation of China (81472575, 81672598, Xiaoming Xie; 81472469, Hailin Tang) and the Science and Technology Planning Project of Guangzhou and Guang-dong (2015B090901050, 2015B020211002, Xiaoming Xie; 2014A020212079, 2016A020214009, Hailin Tang).
Disclosure
The authors report no conflicts of interest in this work.
References
- ZardavasDIrrthumASwantonCPiccartMClinical management of breast cancer heterogeneityNat Rev Clin Oncol201512738139425895611
- Vaz-LuisIOttesenRAHughesMEOutcomes by tumor subtype and treatment pattern in women with small, node-negative breast cancer: a multi-institutional studyJ Clin Oncol201432202142215024888816
- CareyLWinerEVialeGCameronDGianniLTriple-negative breast cancer: disease entity or title of convenience?Nat Rev Clin Oncol201071268369220877296
- BauerKRBrownMCressRDPariseCACaggianoVDescriptive analysis of estrogen receptor (ER)-negative, progesterone receptor (PR)-negative, and HER2-negative invasive breast cancer, the so-called triple-negative phenotype: a population-based study from the California cancer RegistryCancer200710991721172817387718
- De LaurentiisMCiannielloDCaputoRTreatment of triple negative breast cancer (TNBC): current options and future perspectivesCancer Treat Rev201036Suppl 3S80S8621129616
- QiuJXueXHuCComparison of Clinicopathological Features and Prognosis in Triple-Negative and Non-Triple Negative Breast CancerJ Cancer20167216717326819640
- LiCYZhangSZhangXBWangPHouGFZhangJClinicopathological and prognostic characteristics of triple- negative breast cancer (TNBC) in Chinese patients: a retrospective studyAsian Pac J Cancer Prev20131463779378423886182
- ZhouTYangLMaGMClinicopathologic features and prognosis of triple negative breast cancerZhonghua Yi Xue Za Zhi200989322261226420095338
- PerentesJYKirkpatrickNDNaganoSCancer cell-associated MT1-MMP promotes blood vessel invasion and distant metastasis in triple-negative mammary tumorsCancer Res201171134527453821571860
- LinnSCVan ‘t VeerLJClinical relevance of the triple-negative breast cancer concept: genetic basis and clinical utility of the conceptEur J Cancer200945Suppl 1112619775601
- BianchiniGBalkoJMMayerIASandersMEGianniLTriple-negative breast cancer: challenges and opportunities of a heterogeneous diseaseNat Rev Clin Oncol2016131167469027184417
- LeekJTScharpfRBBravoHCTackling the widespread and critical impact of batch effects in high-throughput dataNat Rev Genet2010111073373920838408
- BursteinMDTsimelzonAPoageGMComprehensive genomic analysis identifies novel subtypes and targets of triple-negative breast cancerClin Cancer Res20152171688169825208879
- Huang daWShermanBTLempickiRASystematic and integrative analysis of large gene lists using DAVID bioinformatics resourcesNat Protoc200941445719131956
- HuangDWShermanBTTanQDAVID Bioinformatics Resources: expanded annotation database and novel algorithms to better extract biology from large gene listsNucleic Acids Res200735Web Server issueW169W17517576678
- GaoJAksoyBADogrusozUIntegrative analysis of complex cancer genomics and clinical profiles using the cBioPortalSci Signal20136269pl123550210
- CeramiEGaoJDogrusozUThe cBio cancer genomics portal: an open platform for exploring multidimensional cancer genomics dataCancer Discov20122540140422588877
- GyörffyBLanczkyAEklundACAn online survival analysis tool to rapidly assess the effect of 22,277 genes on breast cancer prognosis using microarray data of 1,809 patientsBreast Cancer Res Treat2010123372573120020197
- WeigeltBReis-FilhoJSHistological and molecular types of breast cancer: is there a unifying taxonomy?Nat Rev Clin Oncol200961271873019942925
- PereiraBChinSFRuedaOMThe somatic mutation profiles of 2,433 breast cancers refines their genomic and transcriptomic landscapesNat Commun201671147927161491
- BeitschPWhitworthPBaronPGenomic impact of neoadjuvant therapy on breast cancer: incomplete response is associated with altered diagnostic gene signaturesAnn Surg Oncol201623103317332327384749
- MarksDLOlsonRLFernandez-ZapicoMEEpigenetic control of the tumor microenvironmentEpigenomics20168121671168727700179
- DeyPEpigenetic changes in tumor microenvironmentIndian J Cancer201148450751222293269
- SeftorEAMeltzerPSKirschmannDAMargaryanNVSeftorREHendrixMJThe epigenetic reprogramming of poorly aggressive melanoma cells by a metastatic microenvironmentJ Cell Mol Med200610117419616563230
- TreppendahlMBKristensenLSGrønbækKPredicting response to epigenetic therapyJ Clin Invest20141241475524382389
- WojtaszLDanielKRoigIMouse HORMAD1 and HORMAD2, two conserved meiotic chromosomal proteins, are depleted from synapsed chromosome axes with the help of TRIP13 AAA-ATPasePLoS Genet2009510e100070219851446
- FukudaTDanielKWojtaszLTothAHöögCA novel mammalian HORMA domain-containing protein, HORMAD1, preferentially associates with unsynapsed meiotic chromosomesExp Cell Res2010316215817119686734
- PangasSAYanWMatzukMMRajkovicARestricted germ cell expression of a gene encoding a novel mammalian HORMA domain-containing proteinGene Expr Patterns20045225726315567723
- KogoHTsutsumiMOhyeTInagakiHAbeTKurahashiHHORMAD1-dependent checkpoint/surveillance mechanism eliminates asynaptic oocytesGenes Cells201217643945422530760
- ShinYHMcGuireMMRajkovicAMouse HORMAD1 is a meiosis I checkpoint protein that modulates DNA double- strand break repair during female meiosisBiol Reprod20138922923759310
- AungPPOueNMitaniYSystematic search for gastric cancer-specific genes based on SAGE data: melanoma inhibitory activity and matrix metalloproteinase-10 are novel prognostic factors in patients with gastric cancerOncogene200625172546255716331256
- ShahzadMMShinYHMatsuoKBiological significance of HORMA domain containing protein 1 (HORMAD1) in epithelial ovarian carcinomaCancer Lett2013330212312922776561
- WatkinsJWeekesDShahVGenomic complexity profiling reveals that HORMAD1 overexpression contributes to homologous recombination deficiency in triple-negative breast cancersCancer Discov20155548850525770156
- ChenYTVendittiCATheilerGIdentification of CT46/HOR-MAD1, an immunogenic cancer/testis antigen encoding a putative meiosis-related proteinCancer Immun20055915999985
- CostaFFLe BlancKBrodinBConcise review: cancer/testis antigens, stem cells, and cancerStem Cells200725370771117138959
- ChenYTRossDSChiuRMultiple cancer/testis antigens are preferentially expressed in hormone-receptor negative and high-grade breast cancersPLoS One201163e1787621437249