 ?Mathematical formulae have been encoded as MathML and are displayed in this HTML version using MathJax in order to improve their display. Uncheck the box to turn MathJax off. This feature requires Javascript. Click on a formula to zoom.
Abstract
Purpose
Large-scale studies have revealed that appropriate antiangiogenic treatment enables the recovery of the normal structure and function of solid tumor vessels. Epigallocatechin-3-gallate (EGCG), a natural extract of green tea, has multiple effects on angiogenesis. However, normalization of blood vessels due to natural ingredients has not yet been reported. Therefore, we examined the microvasculature, microenvironment, and efficacy of EGCG combined with chemotherapy in a xenograft model.
Methods
We treated A549 cell (human lung adenocarcinoma cell line) xenograft-bearing nude mice with EGCG in vivo. CD31, αSMA, and collagen IV were labeled and detected using quantum-dot double-labeled immunofluorescence to measure microvessel density, microvessel pericyte-coverage index, and collagen IV expression. Vessel-perfusion function was determined by lectin injection, permeability by Evans blue extravasation, interstitial fluid pressure using the wick-in-needle technique, and hypoxia levels using a polarographic electrode and immunohistochemical pimonidazole labeling. Cisplatin concentration in tumor tissue was detected using graphite-furnace atomic absorption spectrophotometry. Xenograft mice were randomized into five groups: treated with saline, cisplatin, EGCG, EGCG + cisplatin on day 1, or EGCG + cisplatin during the vascular normalization window. Tumor-growth delay and tumor-suppression rate were measured to evaluate tumor growth.
Results
EGCG treatment in vivo caused temporary changes, including transient depression of microvessel density, microvessel pericyte-coverage index, and collagen IV expression, transient elevation of vessel perfusion and permeability, and decreased interstitial fluid pressure and hypoxia. During vascular normalization, pretreatment with EGCG increased cisplatin concentration in tumor tissue compared with treatment with cisplatin only. Tumor-growth delay after treatment in the five groups during the vascular normalization window was 6.3±1.51, 7.5±1.57, 8.3±1.79, 12.1±1.35, and 15.4±1.99 days, indicating synergistic EGCG–cisplatin effects, especially during the vascular normalization window (P<0.01).
Conclusion
EGCG-induced vascular normalization in human lung adenocarcinoma may be a novel modality for enhancing chemotherapy effects.
Introduction
The incidence of lung cancer is increasing continuously and gravely endangering human health. As a solid tumor, lung cancer is characterized by structural and functional disorders in its microvasculature, leading to changes in the tumor microenvironment, including the development of hypoxia and increased interstitial fluid pressure (IFP). Tumor microvasculature and microenvironment are crucial for proliferation, invasion, metastasis, and disease progression, and can affect the efficacy of anticancer drugs.
Jain et alCitation1,Citation2 demonstrated that using bevacizumab (a recombinant, humanized, monoclonal IgG1 antibody binding to and inhibiting human VEGF activity) for inhibiting tumor neovas-cularization resulted in the reduction of blood-vessel number in tumors, transient changes in microvascular structure and function and tumor microenvironment, which were referred to as “vascular normalization”. Animal experiments and clinical applications suggested that the appropriate combination of bevacizumab and chemotherapy increased chemotherapy efficacy. Follow-up studies demonstrated that this phenomenon was due to the use of a variety of antiangiogenic drugs, including combinations of antiangiogenic DC101,Citation3 bevacizumab,Citation2 herceptin,Citation4 semaxanib,Citation5 thalidomide,Citation6 anginex,Citation7 Aspergillus fumigatus derivative,Citation1 ima-tinib mesylate,Citation1 cetuximab,Citation1 and cetuximab,Citation8 which directly or indirectly regulate the tumor-angiogenesis pathway.
Epigallocatechin-3-gallate (EGCG) is the main active component of tea and reportedly has antitumor effects.Citation9–Citation12 It also regulates tumor angiogenesis through VEGF and VEGFR2Citation13–Citation15 and the Ang–Tie signalingCitation15,Citation16 pathway. We previously determined that EGCG improves the hypoxia and IFP elevation of tumor tissues by regulating Ang1/2 balance, suggesting that EGCG may cause normalization of the tumor microenvironment through its effect on regulating tumor angiogenesis.Citation17 However, to date, no natural ingredient has been proven to nor-malize the microvessels of tumors. Therefore, this study aimed to determine whether EGCG could normalize the microvascular structure and function and the tumor microenvironment, along with determining the vascular normalization window and observing whether it can increase chemosensitivity.
Methods
Non-small-cell lung cancer animal model
Adult (6–8 weeks) female BALB/c nude mice weighing 18–20 g were used as host animals for subcutaneous xeno-graft tumors. Tumors were grown from cultures of A549 human lung adenocarcinoma cells (ATCC, Manassas, VA, USA). Specifically, 106–2×10⁶ A549 cells were injected into the right hind limb of each mouse to facilitate xenograft formation. Palpable tumors were generally observed 7–10 days after injection. Tumor growth was monitored once every 2 days. Tumor volume was determined:
Observing vascular normalization window
When tumors had reached an average volume of 300–600 mm3, we randomized 120 mice into three groups (day 0, n=40 each): treatment group (intraperitoneal [IP] EGCG 1.5 mg/mouse/day, dissolved in 0.2 mL saline, equivalent to concentration of 7.5 mg/mL; E4143, Sigma-Aldrich, St Louis, MO, USA),Citation13,Citation17 positive-control group (bevacizumab 20 mg/kg intravenously; Avastin, Genentech, San Francisco, CA, USA),Citation2 and blank-control group (IP saline 0.2 mL/ mouse/day). Mice were euthanized on day 0, 2, 4, 6, 9, or 12 (5–6 mice/day/group), and xenografts were removed for further analysis.
Inducing vascular normalization window through intermittent EGCG administration
We used the same method to construct a xenograft-bearing mouse model (n=30). All mice were administered IP EGCG (1.5 mg/mouse/day) on days 0–4 and day 12–17. Mice were euthanized on day 0, 5, 8, 12, or 17 (five to six mice/day/ group), and xenografts were removed for further analysis. Animals were housed in a barrier-housing facility meeting national standards (Laboratory Animals: Requirements of Environment and Housing Facilities [GB 14925–2001]). Animal experimental procedures and care of laboratory animals conformed with Beijing municipal guidelines for laboratory animals. This study was approved by the Institutional Review Board of Central South University and was conducted in line with a protocol approved by the ethics committee.
Vessel-structure-change index
Double-labeling immunofluorescence assessment
Quantum dots (QDs) are novel fluorescent molecular probes (Jiayuan Quantum Dots, Wuhan, China) and compared with conventional fluorescence modalities, they exhibit high sensitivity, high specificity, clear background, short operation time, high fluorescence intensity, and resistance to quenching. In this study, we used red QDs (wavelength 605 nm) to label CD31 and green QDs (wavelength 545 nm) to label αSMA, as described previously.Citation17,Citation18 Endothelial cells and pericytes were labeled using two antigens (CD31 and αSMA; Abcam, Cambridge, UK) with QD probes as secondary antibodies (CD31, IgG–QDs, 605 nm; SA–QDs, 525 nm). Additionally, endothelial cells and the basement membrane were labeled using two antigens (CD31 and collagen IV; Abcam), with QD probes used as secondary antibodies (CD31, IgG–QDs, 605 nm; collagen IV, SA–QDs, 525 nm).
Quantification of microvessel density, microvessel pericyte-coverage index, and collagen IV expression
Sections were assessed for staining uniformity at low power (40×). Individual microvessel counts were examined at high power (200×) using the Nuance multispectral imaging system (MISystem; PerkinElmer, Waltham, MA, USA). Density counts of red CD31+ microvessels and green αSMA+ microvessels were assessed as previously described.Citation19 In each mouse, five images showing abundant vascular staining were obtained from sections cut through the midpoint of A549 tumors (upper- and lower-left quadrants, upper- and lower-right quadrants, and middle quadrant). Areas with excessive staining, tissue fragmentation and fibrosis, inflammation, or necrosis were excluded. Image assessment and density determination were done by two investigators, and average values were recorded (strips/high-power lens). The microvessel pericyte-coverage index (MPI) was correspondingly established using the MISystem by quantifying the percentage of microvessels that colocalized with CD31 and αSMA staining. For MPICitation20 quantification, five independent microscopic fields per section per mouse were independently analyzed by two investigators based on the aforementioned method. Collagen IV expression was analyzed similarly to the MPI. Thickness and integrity variation were noted, along with an association of vascular endothelium with vascular basement membrane.
Vessel-function changes
Double-labeling immunofluorescence assessment of CD31 and lectin
Tumor xenograft-bearing mice were treated with EGCG, bevacizumab, or PBS. On days 0, 6, and 12, four mice per group randomly received intravenous biotinylated lectin (0.2 mL 250 µg/mouse; Vector Laboratories, Bur-lingame, CA, USA) to label perfused vessels.Citation21 After 30 minutes, tumors were excised, fixed, embedded, and used for QD staining (CD31 — IgG–QDs, 605 nm; lectin — SA–QDs, 525 nm), after which CD31+lectin+ microvessels (CD31+lectin+–microvessel density [MVD]) were used to calculate the ratio between CD31+lectin+-MVD and CD31-MVD (CD31+lectin+-MVD%).
Evans blue dye assay
The Evans blue dye assay was used to assess vessel permeability.Citation22,Citation23 Five mice per group were selected from each group on days 0, 5, and 12. Tumor-bearing mice received 100 µL 2% Evans blue dye (MP Biomedicals, Santa Ana, CA, USA) via the tail vein. The dye was allowed to circulate for 20 minutes. The remaining intravascular dye was removed. Tumor tissue was excised and placed in 1 mL formamide (Thermo Fisher Scientific, Waltham, MA, USA) for 72 hours for dye extraction. Dye levels were quantified using spectrophotometry (620 nm). All samples were examined in duplicate. Data obtained were compared with those of the standards. Dye concentration in a tumor (µg/g tumor tissue) was calculated by averaging the extraction values for each section of the tumor.
Microenvironmental changes
IFP and tumor partial pressure of O2
IFP was assessed using the wick-in-needle technique, as previously described.Citation17,Citation24 Partial pressure of O2 (PO2) in A549 tumors was measured using a polarographic electrode (POG-203; Unique Medical, Tokyo, Japan), as previously described.Citation17
Immunohistochemical assessment of tumor hypoxia
Pimonidazole (Pimo; 1-[(2-hydroxy-3-piperidinyl)-propyl]-2-nitroimidazole), which can selectively accumulate in hypoxic tissues and can be recognized by antibodies,Citation25 was used as a marker of tumor hypoxia. Mice received Pimo (0.2 mL, 60 mg/kg, IP) (Hypoxyprobe-1, Hypoxyprobe, Burlington, MA, USA) 1.5 hours before tumor excision. After the mice had been killed, tumors were removed, fixed, embedded, and cut using an avidin–biotin–peroxidase-based staining method with anti-Pimo rabbit polyclonal antibody (Hypoxyprobe) serving as the primary antibody.
Image acquisition and analysis
A BX51 fluorescence microscope equipped with a DP72 camera (Olympus, Tokyo, Japan) was used to examine the slides. QDs-525 and QDs-625 were excited and analyzed using the MISystem, and conventional immunohistochemistry slides were excited using natural light.Citation17 Quantitative studies of hypoxia were performed by calculating the ratio of positive immunohistochemical areas of Pimo to total area for semi-quantitative analysis.Citation25 To assess MVD, the number of vessels, determined using positive CD31 staining, was determined.Citation26
Assessing cisplatin in tissue samples
Tumor-bearing mice were randomly divided into three groups (n=6): group A, which received full-dose cisplatin (4 mg/kg IP; Amresco, Solon, OH, USA) on day 5; group B, which received EGCG (1.5 mg/mouse/day IP) for 5 days and half-dose cisplatin (2 mg/kg IP) on day 5; and group C, which received EGCG (1.5 mg/mouse/day IP) for 5 days and full-dose cisplatin (4 mg/kg IP) on day 5. Tumors were then removed after killing the mice. Tissue samples were prepared using an acid-digestion method (dispersion in dilute hydrogen chloride), and cisplatin concentration in tumor tissue was detected using graphite-furnace atomic absorption spectrophotometry (PerkinElmer).Citation27
Assessing tumor-growth delay and relationship between vascular normalization and synergistic antitumor effects of cisplatin and EGCG
Tumor-bearing mice were divided into five groups (n=6) with IP administration: group A (control; saline 0.2 mL/ mouse/day), group B (single-dose cisplatin 2 mg/mouse on day 0), group C (EGCG 1.5 mg/mouse/day), group D1 (EGCG 1.5 mg/mouse/day and single-dose cisplatin 2 mg/ mouse on day 0), and group D2 (EGCG 1.5 mg/mouse/day and single-dose cisplatin 2 mg/mouse on day 5). Mice were examined twice weekly to evaluate tumor growth using cali-pers in two mutually perpendicular diameters, as mentioned previously. Then, the time taken by each tumor to reach an approximate volume of 1,250 mm3 was recorded. The average value for each group was recorded as the tumor-growth delay (TGD). Mice were killed on day 21, after which the tumors were excised and weighed. The tumor-inhibition rate was calculated:
Statistical analysis
SPSS 19.0 was used to perform all statistical analyses. Student’s t-test was used for comparisons between groups, whereas paired t-tests were used for comparisons between before and after treatment for individual tumors. Data are presented as mean ± SE. The time required to reach the target tumor volume is presented as mean ± SD, and these data were compared using ANOVA. Simple linear regression was used to examine the relationship between outcome measures within each treatment arm. P≤0.05 was considered statistically significant. As previously described,Citation28 a regression model was used to fit the time-to-tumor-volume data that included terms to estimate the individual (main) effects of each treatment and the interaction of these two treatments on tumor regrowth. For the cisplatin/EGCG experiments, the linear model took the following form:
Ethics statement
This study was approved by the Institutional Review Board of Central South University and was conducted in accordance with guidelines approved by the ethics committee.
Results
Animal modeling
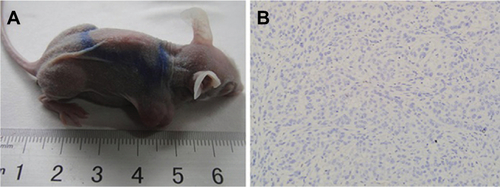
A murine xenograft model mimicking human lung adeno-carcinoma was established (). The overall tumori-genesis rate in A549 cell-line xenograft-bearing nude mice was 90% (135 of 150). H&E staining revealed a solid-like structure of xenograft tumors. Most tumor cells were large, with spindle-shaped and heterotypical morphology along with large nuclei and obvious nucleoli in a chaotic pattern. Mitotic figures and necrosis were microscopically observed.
Assessing CD31-MVD, αSMA-MVD, and MPI
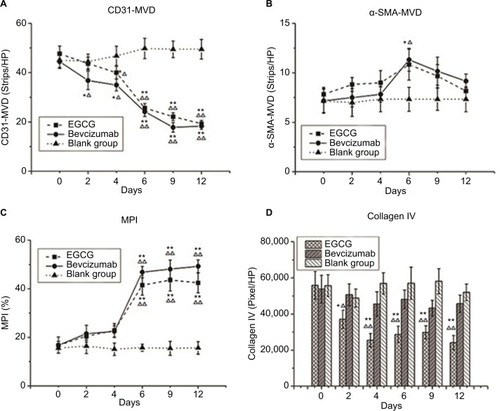
Anti-CD31 antibodies can specifically label endothelial vessels, including mature and immature vessels, distinguishing the vessels from peripheral cancer cells and connective tissues as countable microvessels (CD31-MVD). Meanwhile, αSMA can specifically label perivascular cells, which cover mature vessels. Therefore, green-stained vessels are mature microvessels (). Prior to treatment, CD31 (red) was overexpressed in the xenografts (), whereas αSMA (green) expression was lower and patchy (). Meanwhile, the MPI was low in xenografts in each group. After treatment with EGCG or bevacizumab, CD31-MVD decreased gradually from day 2 and had decreased by approximately 50% on day 6 (). Conversely, αSMA-MVD increased slightly over time, peaking on day 6 before declining (). The MPI did not increase clearly until day 6, after which it entered a plateau phase (). No significant difference was found between the two groups (P>0.05); however, significant differences were observed between each treatment group and the blank control (P<0.01).
Figure 1 Quantum-dot double-labeling immunofluorescence assessment of CD31 and αSMA after treatment (400×).
Notes: Five to six mice from three treatment groups (n=40) — epigallocatechin-3-gallate (EGCG), bevacizumab (positive control), and saline (blank control) — were euthanized on day 0, 2, 4, 6, 9, or 12, and then quantum-dot double-labeling immunofluorescence assessment was performed. Red staining denotes CD31 labeling vascular endothelial cells, representing disorders such as hypertrophy, lumen disfigurement, and discontinuity of connection (yellow arrow); formed and thickened lumen and continuous connection (orange arrow); and decrease in the number of lumina, along with thinning and discontinuous change in the wall (white arrow). Green staining denotes αSMA that labels vascular pericytes, which represent discontinuous connection (purple arrow) and a thickened, complete, and continuous state (pink arrow). When two fluorescently labeled images are merged, the coverage of vascular endothelial cells in pericytes can be observed to be incomplete, loosely interconnected or even completely absent (blue arrow). We can also see that the entire continuous layer of pericytes is covered with a complete and continuous layer of vascular endothelial cells, which are closely connected to each other (yellow arrows).
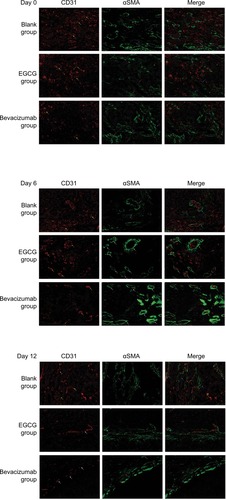
Figure 2 Vessel-structure index changes after treatment.
Notes: Three treatment groups (n=40) — EGCG, bevacizumab (positive control), and saline (blank control) — were established. Mice from each group were euthanized on day 0, 2, 4, 6, 9, or 12 (n=5–6). (A) CD31 MVD (strips/HP lens). (B) αSMA-MVD (strips/HP lens). (C) Microvessel pericyte-coverage index (MPI; %). (D) Collagen IV (pixels/ HP lens). *P<0.05, **P<0.01 compared with blank control at same time point; △P<0.05, △△P<0.01 compared with day 0 in same group.
Abbreviations: EGCG, epigallocatechin-3-gallate; MVD, microvessel density; HP, high power.
Vascular basement membrane
Collagen IV labeled by green fluorescence can illustrate the morphology and expression of the basement membrane. Under baseline conditions, green fluorescence was intense and disordered in each group, indicating that the basement membrane was thick and disorganized (). After 4 days of EGCG treatment, collagen IV expression had significantly reduced compared with that in the blank- and positive-control groups (P<0.01, ). In addition, we found that the collagen IV+ basement membrane was thinner and more regularly distributed (). However, collagen IV expression tended to decrease in the bevacizumab group, although this was not significant (P>0.05, ). CD31+ vessels decreased in number in both the EGCG- and bevacizumab-treatment groups, leaving a high number of CD31− collagen IV+ empty sleeves in the basement membrane.
Figure 3 Quantum-dot double-labeling immunofluorescence assessment of CD31 and collagen IV after treatment (200×).
Notes: Three treatment groups (n=40) — EGCG, bevacizumab (positive control), and saline (blank control) — were established. Mice from each group were euthanized on day 0, 2, 4, 6, 9, or 12 (n=5–6), and then quantum-dot double-labeling immunofluorescence assessment was performed. Red staining denotes CD31 labeling vascular endothelial cells, and green staining denotes collagen IV labeling vascular basement membrane, representing thickened, disordered, discontinuous-connection vascular basement membrane and incompletely covered with vascular endothelial cells (yellow arrows), a thickened, complete, and continuous state (pink arrows), or CD31− collagen IV+ empty sleeves (white arrows).
Abbreviation: EGCG, epigallocatechin-3-gallate.
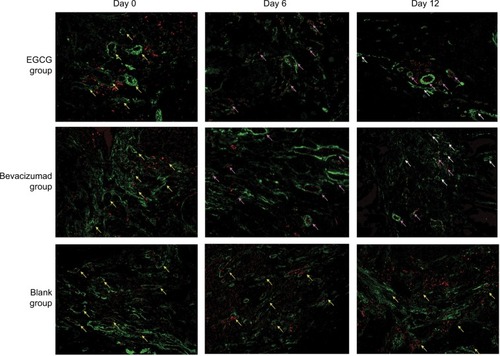
Figure 4 Vessel-perfusion function and permeability.
Notes: (A) CD31+lectin+ percentage. Three treatment groups (n=40) — EGCG, bevacizumab (positive control), and saline (blank control) — were established. Mice from each group were euthanized on day 0, 2, 4, 6, 9, or 12 (n=5–6), and then quantum-dot double-labeling immunofluorescence assessment was performed to detect CD31, which was followed by lectin injection. (B) Concentration of Evans blue dye within a tumor (μg/g tumor tissue). From the three treatment groups (n=20), five to six mice from each group were injected with 100 μL 2% Evans blue dye and euthanized on day 0, 5, or 12. *P<0.05, **P<0.01 compared with the blank control at the same time point; △P<0.05, △△P<0.01 compared with day 0 in the same group.
Abbreviation: EGCG, epigallocatechin-3-gallate.
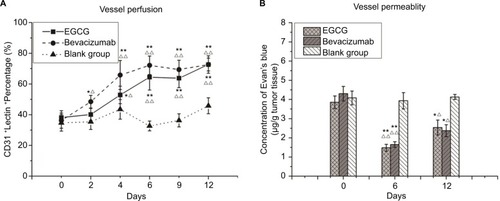
Vessel-perfusion function and permeability
Lectin injected into the bloodstream binds rapidly and uniformly to the luminal surface of the vasculature, thus marking blood vessels that are patent and perfused.Citation29 Before any treatment, most CD31+ vessels lacked lectin staining, and the coexpression rate of CD31 and lectin was also low. After 4 days of EGCG or bevacizumab treatment, CD31 staining had decreased, whereas lectin staining and coex-pression rate of CD31 and lectin had increased, especially in the positive-control group. Lectin expression and coex-pression rate in the EGCG-treated group peaked on day 6 and then plateaued, illustrating that unperfused vessels had degenerated and vessels that survived treatment were patent and perfused. Evans blue perfusion assessment indicated that after 6 days of treatment with EGCG or bevacizumab, the concentration of Evans blue dye had surged markedly compared with the blank-control group (P<0.01) before declining on day 12, albeit remaining higher than the initial value (P<0.05).
Tumor hypoxia and IFP
Both in vivo and in vitro experiments were performed to define the degree of hypoxia in tumor tissue. A polarographic electrode was used to determine PO2, recording an average value of 4.1±0.42 mmHg before treatment in the EGCG group. This value increased after 2 days of treatment, peaking at 11.05±0.94 mmHg on day 6 before declining to the baseline level by day 12. A similar trend also appeared in the positive-control group, with the value peaking on day 4 (). Conversely, the immunohistochemical expression of Pimo implied an inversely proportional relationship with oxygen concentration. Before treatment, the positive-expression area was extensive and intense, indicating severe hypoxia in xenograft tumor tissue. After treatment, the positive area of Pimo had decreased to 7,593.30±2,087.83 (day 6) and 9,457.33±3,114.71 (day 4) pixels/high-power lens in the EGCG and positive-control groups, respectively, before increasing (). The two methods confirmed the transient improvement in oxygenation after treatment of EGCG directly and indirectly.
Figure 5 Microenvironment indices.
Notes: Three treatment groups (n=40) — EGCG, bevacizumab (positive control), and saline (blank control) — were established. Mice from each group were euthanized on day 0, 2, 4, 6, 9, or 12 (n=5–6). (A) Partial pressure of O2 (PO2; mmHg); (B) interstitial fluid pressure (IFP; mmHg); (C) pimonidazole (Pimo; pixels/HP). *P<0.05, **P<0.01 compared with the blank control at the same time point; △P<0.05, △△P<0.01 compared with day 0 in the same group.
Abbreviation: EGCG, epigallocatechin-3-gallate.
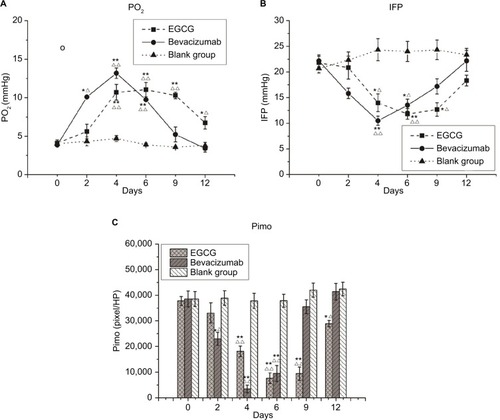
Meanwhile, IFP averaged 21.83±1.22, 22.17±1.17, and 20.67±0.84 mmHg in the EGCG, positive-control, and blank-control groups, respectively, before treatment (P>0.05). These values were significantly higher than the IFP of the upper-arm muscle of mice during synchronization, suggesting that the IFP of xenograft tumors was abnormally elevated. IFP was lower on day 4 in the EGCG and positive-control groups, but higher in these groups on days 9 and 6, respectively. On day 12, IFP was slightly lower than the baseline in the positive-control group (P<0.05, ).
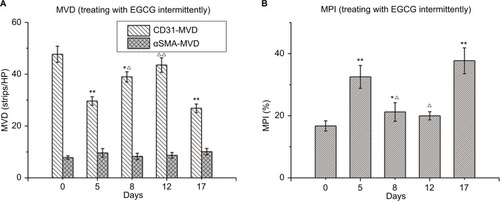
When A549 xenografts were treated with EGCG intermittently, CD31-MVD increased, whereas αSMA-MVD and MPI had decreased slightly 3 days after drug withdrawal before reverting to the basal level after 7 days. After EGCG-treatment restart for 5 days, increases in CD31-MVD and decreases in αSMA-MVD and MPI reappeared, indicating the restoration of normal vascular conditions after intermittent EGCG treatment ().
Figure 6 Changes in tumor vessels after intermittent treatment with EGCG.
Notes: Thirty mice were administered EGCG (1.5 mg/mouse/day) on days 0–4 and again on days 12–17. The mice were euthanized on day 0, 5, 8, 12, or 17 (n=5–6), dissected, and xenografts removed for further analysis. (A) CD31 microvessel density (MVD; strips/high-power [HP lens). (B) Microvessel pericyte-coverage index (MPI; %). *P<0.05, **P<0.01 compared with day 0; △P<0.05, △△P<0.01 compared with day 5.
Abbreviation: EGCG, epigallocatechin-3-gallate.
Relationship between vascular normalization and local cisplatin concentration
Cisplatin concentrations in groups A, B, and C were 0.8, 1.0, and 1.8 µg/g tissue, respectively. As such, the concentrations after administering full-dose cisplatin were similar to those after administering half doses with 5-day EGCG pretreatment (P>0.05) and were much higher in the full-dose combined group (C; P<0.01).
Effect of EGCG on response to cisplatin in A549 xenografts
As shown in and , the final average tumor volumes in groups A, B, C, D1, and D2 were 3,562±395, 3,365±296, 3,098±311, 2,154±296, and 1,536±215 mm3, respectively, with the values in groups D1 and D2 being significantly different from those in groups A–C (P<0.05). Mean times to reach a tumor volume of 1250 mm3 were 6.3±1.51, 7.5±1.57, 8.3±1.79, 12.1±1.35, and 15.4±1.99 days in groups A, B, C, D1, and D2, respectively, indicating a decline in tumor growth in response to the combination of EGCG and cisplatin (P<0.001), especially when cisplatin was administered within the vascular normalization window. Meanwhile, linear regression of TGD indicated that the combination of EGCG and cisplatin had synergistic effects against human lung adenocarcinoma (test of synergy, P<0.001). The average tumor volume on day 21 was significantly smaller in group D2 than in group D1 (P<0.05). Meanwhile, the growth-trend curve was steeper in groups D1 and D2, especially in the latter group, than in the other groups.
Figure 7 Growth curves of xenografts.
Notes: Five treatment groups (n=6) — control group (group A), cisplatin-treated group (group B), epigallocatechin-3-gallate (EGCG)-treated group (group C), combined-treatment group 1 (EGCG + cisplatin [day 0]; group D1), and combined-treatment group 2 (EGCG + cisplatin [day 5]; group D2) — were established. The longest diameter (L) and shortest vertical diameter (W) of the tumors were measured using Vernier calipers after the appearance of the tumors, and then the volume fraction of the tumors was calculated: V (mm3) = (L×W2/2), where V is the approximate volume of the tumors. *P<0.05, **P<0.01 compared with group A; △P<0.05, △△P<0.01 compared with group B; #P<0.05, ##P<0.01 compared with group C; ☆P<0.05 compared with group D1.
Abbreviations: Cis, cisplatin; EGCG, epigallocatechin-3-gallate.
![Figure 7 Growth curves of xenografts.Notes: Five treatment groups (n=6) — control group (group A), cisplatin-treated group (group B), epigallocatechin-3-gallate (EGCG)-treated group (group C), combined-treatment group 1 (EGCG + cisplatin [day 0]; group D1), and combined-treatment group 2 (EGCG + cisplatin [day 5]; group D2) — were established. The longest diameter (L) and shortest vertical diameter (W) of the tumors were measured using Vernier calipers after the appearance of the tumors, and then the volume fraction of the tumors was calculated: V (mm3) = (L×W2/2), where V is the approximate volume of the tumors. *P<0.05, **P<0.01 compared with group A; △P<0.05, △△P<0.01 compared with group B; #P<0.05, ##P<0.01 compared with group C; ☆P<0.05 compared with group D1.Abbreviations: Cis, cisplatin; EGCG, epigallocatechin-3-gallate.](/cms/asset/6cdceb35-2fe6-4fa7-b113-6aa881219913/dcmr_a_12186095_f0007_b.jpg)
Table 1 Tumor-growth delay (days) and tumor-inhibition rate (%) of xenografts treated with EGCG + Cis
Discussion
Effects of EGCG on vascular structure and lung adenocarcinoma-tumor function
In the present study, we observed that EGCG induced micro-vascular structure changes in human lung adenocarcinoma xenografts. Of these, the early shifts in the MPI in the treatment groups compared with that in the control group were in line with the findings of a previous report. Additionally, the continued decreases in CD31-MVD and αSMA-MVD and increases in MPI at later time points could be attributable to further reductions in the number of immature vessels, resulting in the predominance of vessels with high maturity. Meanwhile, the more continuous and regular αSMA expression in the EGCG and positive-control groups suggested that the maturity of the remaining blood vessels was improved. Reportedly, drugs targeting the VEGF pathway,Citation2 Ang–Tie2 axis,Citation30 and PI3K–Akt–mTOR pathwayCitation31 can lead to such changes.Citation32 Previous studies on the antiangiogenesis effects of EGCG have confirmed that EGCG can decrease HIF1α protein expression and VEGF, VEGFR2, and pVEGFR2 mRNA expression in SW837 colorectal cancer cells, in which the VEGF–VEGFR axis is constitutively activated.Citation14,Citation15 Orally administered EGCG significantly inhibits VEGFR2 and VEGF mRNA expression and activationCitation14,Citation15,Citation33 and increases endostatin expressionCitation33 in xenografts in nude mice. Moreover, Shi et alCitation34 revealed that EGCG significantly reversed the nicotine-mediated upregulation of HIF1α and VEGF protein levels in A549 cells and markedly inhibited nicotine-induced HIF1α-dependent angiogenesis in vitro and in vivo. Simultaneously, Wang et alCitation35 found that EGCG exhibits the aforementioned activity by inhibiting the PI3K–Akt–mTOR–HIF1α pathway. Moreover, inhibition of PI3K–Akt pathways can regulate antiangiogenic effects of EGCG through activation of the FOXO family of transcription factors when applied to human umbilical vein endothelial cells in vitro.Citation36 This evidence further supports the effects of EGCG on microvascular structure and explains the possible underlying mechanisms.
With respect to the vascular basement membrane, we found that collagen IV expression in the basement membrane of the EGCG group was significantly reduced compared with that in the blank- and positive-control groups (P<0.01, ), showing thinner and more regularly distributed basement membranes (). As such, high numbers of CD31− collagen IV+ empty sleeves were observed in the basement membranes. This phenomenon has been observed in other regions, including the lens vascular membrane (component of blood-vessel walls) and remnant basement-membrane components between capillaries after degradation.Citation37 Injured skeletal muscle capillaries have two basement membrane layers after repair: the outer layer remaining after the injury and the inner layer formed after repair, indicating that the repair process occurs via revascularization through the old basement membrane.Citation38 Therefore, we speculate that the basement membrane-formatted vascular cuff was the remnants of trimmed blood vessels, whereas the vascular endothelium and basement membrane cannot be trimmed simultaneously merely by blocking the VEGF–VEGFR2 pathway. This indicates that these processes occur through different mechanisms. It has been confirmed that EGCG can reduce VEGF, MMP2, MMP7, MMP9, and MMP12 expression in AsPC1 (pancreatic cell line)-xenograft tumors and inhibit angiogenesis,Citation39 while also affecting collagen synthesis by modulating MMP1, TGF1, collagen I, MMP2, MMP9, and MMP inhibitors 1 and 2.Citation40 This suggests the possible mechanism by which EGCG induces vascular basement-membrane degradation. However, the specific mechanism requires further research. Antiangiogenesis therapy causes empty-vessel cuffing, thus providing good support for angiogenesis. This suggests that we should both target vascular endothelial cells and note the importance of the vascular basement membrane. In this regard, EGCG is potentially superior to bevacizumab regarding antiangiogenesis effects.
The abnormal growth of tumor blood vessels leads to heterogeneity of the distribution and morphology of blood vesselsCitation41 as well as heterogeneity regarding the space and timing of blood flow perfusion.Citation42,Citation43 In the present study, the increase of CD31+lectin+ coexpression 4 days after treatment with EGCG indicated improved perfusion. Similarly, the EB concentration was transiently increased after treatment in the two groups, indicating improved vascular permeability. These findings were consistent with the aforementioned changes in MPI, further confirming that EGCG can induce vascular normalization in human lung adenocarcinoma xenografts.
Effect of EGCG on human lung adenocarcinoma tumor-tissue microenvironment
IFP is reportedly not regulated in a variety of solid tumors,Citation44 and it is closely related to tumor size,Citation45 volume growth,Citation46 and pulmonary and lymph-node metastasis. Meanwhile, hypoxia can reduce the cytotoxic effects of radiotherapy and chemotherapy,Citation47,Citation48 and both hypoxia and IPF are independent tumor prognostic factors. Emerging clinical data suggest that patients with greater tumor oxygenation have longer survival and respond to many antiangiogenic drugs targeting VEGF, leading to improved outcomes of radiotherapy, chemotherapy, and immunotherapy.Citation49 Based on the relationship between PO2 and IFP, we speculated that the decline in IFP in tumor tissue resulted in a decrease of differential pressure between the capillaries and stromata, permitting easier delivery of oxygen to tissue and cells and alleviation of hypoxia. Consistent with previous studies, we also observed a significant increase in baseline IFP in human lung adenocarcinoma tumors, whereas EGCG and bevacizumab treatment resulted in marked reduction of hypoxia and IFP.Citation17 This study confirms our previous findings and reveals that improvement in hypoxia and IFP induced by EGCG are transient.
Combining the aforementioned changes in vascular structure, function, and microenvironmental indices, we speculate that the window for EGCG-induced vascular normalization in human lung adenocarcinoma-xenografted tumors is 4–9 days after treatment. In fact, because of limitations regarding the observation time points that we set, this window might be 1–2 days longer. From graphs of the MPI and the perfusion-function index, it can be observed that the start of the EGCG-induced vascular normalization window was slightly delayed compared with the timing in the positive-control group; however, the window tended to be wider, and the peak-platform period tended to be longer, although this difference was not statistically significant.
Effect of continuous EGCG treatment on human lung adenocarcinoma-tumor blood vessels
Previous studies suggested that although continuously administering drugs that normalize the tumor vasculature restores vessel growth to the baseline level, vascular normalization can reoccur after treatment termination.Citation50 The study results indicated further that EGCG can induce tumor vascular normalization in human lung adenocarcinoma and intermittent dosing can repeatedly induce vascular normalization. These findings reveal a feasible combinatorial antitumor clinical therapy strategy, ie, inducing human lung adenocarcinoma tumor vascular normalization via repeated intermittent treatment with EGCG combined with chemotherapy during the vascular normalization window to improve the curative effect of chemotherapy and enhancing prognosis.
Effects of EGCG combined with chemotherapy
Teicher et al revealed that antiangiogenesis therapy combined with chemotherapy, radiotherapy, and immunotherapy, can exhibit synergistic effects on solid tumors,Citation51 possibly because tumor cells and endothelial cells are different targets. Chemotherapy and radiotherapy also exhibit antiangio-genesis effects and can directly damage endothelial cells and inhibit the recruitment of perithelial cells. Cancer cells can express VEGFR and can be targeted by drugs influencing the VEGF–VEGFR pathway.Citation52 However, the effectiveness of chemotherapy and radiotherapy is generally considered to depend on sufficient blood perfusion, which is contrary to the effect of antiangiogenic drugs on vascular degeneration. The concept of transient “vascular normalization” efficiently explains the contradiction that antiangiogenic drugs can cause temporary maturation of the microvascular structure and improvement in tumor function. This suggests that anticancer-drug concentration in tissue may increase by increasing perfusion.Citation53,Citation54 The results of this study show that cisplatin concentration that was originally administered at the same dose in tumor tissues was significantly higher than that after pretreatment with EGCG (1.8 µg/g tissue vs 0.8 µg/g tissue, P<0.01). Using half-dose cisplatin (2 mg/ kg) with EGCG pretreatment for 5 days resulted in a high concentration of 1.0 µg/g tissue. This highlights that the combination of chemotherapy and EGCG pretreatment may achieve a better effect by increasing local cisplatin concentration and can appropriately reduce the dose and thus the side effects of chemotherapy.
EGCG exhibits antitumor activity by inhibiting the growth factor receptor-mediated signal-transduction pathway (including EGFR, IGF1R, VEGFR, and PDGFR),Citation55 suppressing the NFκB-signaling pathway,Citation56 reducing proteasome activity,Citation57 and lowering cyclooxygenase 2.Citation58 To clarify whether EGCG can act synergistically to increase chemotherapy efficacy through its vascular normalization besides its antitumor activity, we observed TGD in mice treated with both cisplatin and EGCG within or outside the vascular normalization window. Our results suggested that the synergistic effect of cisplatin was highest in the vascular normalization window induced by EGCG, although it cannot be ruled out that the effect was due to the antitumor effect of EGCG.
Conclusion
In our study, we determined that EGCG, a natural component of green tea, can temporarily induce the normalization of tumor microvasculature and microenvironment in human lung adenocarcinoma. Moreover, we identified that the time window for normalization in xenografted mice is 4–9 days. The degradation of the vascular basement membrane is more efficient during normalization than following bevacizumab treatment, suggesting some potential advantages regarding antiangiogenesis. Combining cisplatin treatment with EGCG-induced vascular normalization window can increase cisplatin concentration in tumor tissue and synergistically potentiate its antitumor efficacy, which represents a novel strategy for enhancing the effects of chemotherapy.
Author contributions
All authors contributed toward data analysis, drafting and revising the paper, gave final approval of the version to be published and agree to be accountable for all aspects of the work.
Acknowledgments
This work was supported in part by grants from the National Natural Science Foundation of China (81502699, 8160025).
Supplementary material
Disclosure
The authors report no conflicts of interest in this work.
References
- JainRKNormalizing tumor vasculature with anti-angiogenic therapy: a new paradigm for combination therapyNat Med20017998798911533692
- JainRKDudaDGClarkJWLoefflerJSLessons from phase III clinical trials on anti-VEGF therapy for cancerNat Clin Pract Oncol200631244016407877
- TongRTBoucherYKozinSVWinklerFHicklinDJJainRKVascular normalization by vascular endothelial growth factor receptor 2 blockade induces a pressure gradient across the vasculature and improves drug penetration in tumorsCancer Res200464113731373615172975
- IzumiYXuLdi TomasoEFukumuraDJainRKTumour biology: Herceptin acts as an anti-angiogenic cocktailNature20024166878279280
- AnsiauxRBaudeletCJordanBFMechanism of reoxygenation after antiangiogenic therapy using SU5416 and its importance for guiding combined antitumor therapyCancer Res200666199698970417018628
- AnsiauxRBaudeletCJordanBFThalidomide radiosensitizes tumors through early changes in the tumor microenvironmentClin Cancer Res2005112 Pt 174375015701864
- DingsRPLorenMHeunHScheduling of radiation with angiogenesis inhibitors anginex and Avastin improves therapeutic outcome via vessel normalizationClin Cancer Res200713113395340217545548
- BatchelorTTSorensenAGdi TomasoEAZD2171, a pan-VEGF receptor tyrosine kinase inhibitor, normalizes tumor vascu-lature and alleviates edema in glioblastoma patientsCancer Cell2007111839517222792
- GuQHuCChenQXiaYFengJYangH[Prevention of chinese green tea on 3,4-benzopyrene-induced lung cancer and its mechanism in animal mode]Zhongguo Fei Ai Za Zhi2008114519523 Chinese20735961
- LiJJGuQHLiMYangHPCaoLMHuCPRole of Ku70 and Bax in epigallocatechin-3-gallate-induced apoptosis of A549 cells in vivoOncol Lett20135110110623255902
- MaYCLiCGaoFEpigallocatechin gallate inhibits the growth of human lung cancer by directly targeting the EGFR signaling pathwayOncol Rep20143131343134924366444
- SongXDuJZhaoWGuoZEpigallocatechin-3-gallate (EGCG): mechanisms and the combined applicationsComb Chem High Throughput Screen Epub20171217
- JungYDKimMSShinBAEGCG, a major component of green tea, inhibits tumour growth by inhibiting VEGF induction in human colon carcinoma cellsBr J Cancer200184684485011259102
- ShimizuMShirakamiYSakaiH(-)-Epigallocatechin gallate inhibits growth and activation of the VEGF/VEGFR axis in human colorectal cancer cellsChem Biol Interact2010185324725220346928
- RashidiBMalekzadehMGoodarziMMasoudifarAMirzaeiHGreen tea and its anti-angiogenesis effectsBiomed Pharmacother20178994995628292023
- ShapiroRValleeBLSite-directed mutagenesis of histidine-13 and histidine-114 of human angiogenin. alanine derivatives inhibit angiogenin-induced angiogenesisBiochemistry19892818740174082479414
- DengPBHuCPXiongZYangHPLiYYTreatment with EGCG in NSCLC leads to decreasing interstitial fluid pressure and hypoxia to improve chemotherapy efficacy through rebalance of Ang-1 and Ang-2Chin J Nat Med201311324525323725836
- LiuXLPengCWChenCQuantum dots-based double-color imaging of HER2 positive breast cancer invasionBiochem Biophys Res Commun2011409357758221609713
- MyersALWilliamsRFNgCYHartwichJEDavidoffAMBev-acizumab-induced tumor vessel remodeling in rhabdomyosarcoma xenografts increases the effectiveness of adjuvant ionizing radiationJ Pediatr Surg20104561080108520620299
- EberhardAKahlertSGoedeVHemmerleinBPlateKHAugustinHGHeterogeneity of angiogenesis and blood vessel maturation in human tumors: implications for antiangiogenic tumor therapiesCancer Res20006051388139310728704
- RolnyCMazzoneMTuguesSHRG inhibits tumor growth and metastasis by inducing macrophage polarization and vessel normalization through downregulation of PLGFCancer Cell2011191314421215706
- DicksonPVHamnerJBSimsTLBevacizumab-induced transient remodeling of the vasculature in neuroblastoma xenografts results in improved delivery and efficacy of systemically administered chemotherapyClin Cancer Res200713133942395017606728
- FukumuraDJainRKTumor microvasculature and microenvironment: targets for anti-angiogenesis and normalizationMicrovasc Res2007742–3728417560615
- BoucherYKirkwoodJMOpacicDDesantisMJainRKInterstitial hypertension in superficial metastatic melanomas in humansCancer Res19915124669166941742743
- RaleighJAChouSCArteelGEHorsmanMRComparisons among pimonidazole binding, oxygen electrode measurements, and radiation response in C3H mouse tumorsRadiat Res1999151558058910319731
- WeidnerNIntratumor microvessel density as a prognostic factor in cancerAm J Pathol199514719197541613
- DoupleEBTottenMDSpencerFPlatinum levels in murine tumor following intraperitoneal administration of cisplatin or paraplatinNCI Monogr19886129132
- JiangZPoreNCernigliaGJPhosphatase and tensin homologue deficiency in glioblastoma confers resistance to radiation and temozolo-mide that is reversed by the protease inhibitor nelfinavirCancer Res20076794467447317483362
- DebbagePLGriebelJRiedMGneitingTDevriesAHutzlerPLectin intravital perfusion studies in tumor-bearing mice: micrometer-resolution, wide-area mapping of microvascular labeling, distinguishing efficiently and inefficiently perfused microregions in the tumorJ Histochem Cytochem19984656276399562571
- FalcónBLHashizumeHKoumoutsakosPContrasting actions of selective inhibitors of angiopoietin-1 and angiopoietin-2 on the normalization of tumor blood vesselsAm J Pathol200917552159217019815705
- SchnellCRStaufferFAllegriniPREffects of the dual phospha-tidylinositol 3-kinase/mammalian target of rapamycin inhibitor NVP-BEZ235 on the tumor vasculature: implications for clinical imagingCancer Res200868166598660718701483
- JainRKMolecular regulation of vessel maturationNat Med20039668569312778167
- SakamotoYTerashitaNMuraguchiTFukusatoTKubotaSEffects of epigallocatechin-3-gallate (EGCG) on A549 lung cancer tumor growth and angiogenesisBiosci Biotechnol Biochem20137791799180324018658
- ShiJLiuFZhangWLiuXLinBTangXEpigallocatechin-3-gallate inhibits nicotine-induced migration and invasion by the suppression of angiogenesis and epithelial-mesenchymal transition in non-small cell lung cancer cellsOncol Rep20153362972298025845434
- WangJManGCWChanTHKwongJWangCCA prodrug of green tea polyphenol (-)-epigallocatechin-3-gallate (Pro-EGCG) serves as a novel angiogenesis inhibitor in endometrial cancerCancer Lett2018412102029024813
- ShankarSChenQSrivastavaRKInhibition of PI3K/Akt and MEK/ERK pathways act synergistically to enhance antiangiogenic effects of EGCG through activation of FoxO transcription factorJ Mol Signal20083718355401
- LatkerCHKuwabaraTRegression of the tunica vasculosa lentis in the postnatal ratInvest Ophthalmol Vis Sci19812156896997298273
- VrackoRBasal lamina scaffold-anatomy and significance for maintenance of orderly tissue structureAm J Pathol19747723143464614671
- ShankarSGanapathySHingoraniSRSrivastavaRKEGCG inhibits growth, invasion, angiogenesis and metastasis of pancreatic cancerFront Biosci20081344045217981559
- NakamutaMHigashiNKohjimaMEpigallocatechin-3-gallate, a polyphenol component of green tea, suppresses both collagen production and collagenase activity in hepatic stellate cellsInt J Mol Med200516467768116142404
- LessJRSkalakTCSevickEMJainRKMicrovascular architecture in a mammary carcinoma: branching patterns and vessel dimensionsCancer Res19915112652731988088
- JainRKNormalization of tumor vasculature: an emerging concept in antiangiogenic therapyScience20053075706586215637262
- BaishJWStylianopoulosTLanningRMScaling rules for diffusive drug delivery in tumor and normal tissuesProc Natl Acad Sci USA201110851799180321224417
- BoucherYJainRKMicrovascular pressure is the principal driving force for interstitial hypertension in solid tumors: implications for vascular collapseCancer Res19925218511051141516068
- YoungJSLumsdenCEStalkerALThe significance of the tissue pressure of normal testicular and of neoplastic (Brown-Pearce carcinoma) tissue in the rabbitJ Pathol Bacteriol195062331333314784896
- RofstadEKTunheimSHMathiesenBPulmonary and lymph node metastasis is associated with primary tumor interstitial fluid pressure in human melanoma xenograftsCancer Res200262366166411830516
- AirleyREPhillipsRMEvansAEHypoxia-regulated glucose transporter GLUT-1 may influence chemosensitivity to some alkylating agents: results of EORTC (first translational Award) study of the relevance of tumour hypoxia to the outcome of chemotherapy in human tumour-derived xenograftsInt J Oncol20052661477148415870859
- GreijerAEde JongMCSchefferGLShvartsAvan DiestPJvan der WallEHypoxia-induced acidification causes mitoxantrone resistance not mediated by drug transporters in human breast cancer cellsCell Oncol2005271434915750206
- JainRKAntiangiogenesis strategies revisited: from starving tumors to alleviating hypoxiaCancer Cell201426560562225517747
- MancusoMRDavisRNorbergSMRapid vascular regrowth in tumors after reversal of VEGF inhibitionJ Clin Invest2006116102610262117016557
- TeicherBADupuisNPRobinsonMFEmiYGoffDAAntiangio-genic treatment (TNP-470/minocycline) increases tissue levels of anticancer drugs in mice bearing Lewis lung carcinomaOncol Res1995752372438534929
- TeicherBAA systems approach to cancer therapy. (Antioncogenics + standard cytotoxics-->mechanism(s) of interaction)Cancer Metastasis Rev19961522472728842498
- MillerKWangMGralowJPaclitaxel plus bevacizumab versus paclitaxel alone for metastatic breast cancerN Engl J Med2007357262666267618160686
- ReckMvon PawelJZatloukalPPhase III trial of cisplatin plus gemcitabine with either placebo or bevacizumab as first-line therapy for nonsquamous non-small-cell lung cancer: AVAilJ Clin Oncol20092781227123419188680
- ShimizuMAdachiSMasudaMKozawaOMoriwakiHCancer chemoprevention with green tea catechins by targeting receptor tyrosine kinasesMol Nutr Food Res201155683284321538846
- KhanNMukhtarHMultitargeted therapy of cancer by green tea polyphenolsCancer Lett2008269226928018501505
- DouQPMolecular mechanisms of green tea polyphenolsNutr Cancer200961682783520155623
- SinghTKatiyarSKGreen tea catechins reduce invasive potential of human melanoma cells by targeting COX-2, PGE2 receptors and epithelial-to-mesenchymal transitionPLoS One2011610e2522422022384

