
Abstract
Objective
To study the protein expression level of Nrf2/HO-1 in clear cell renal cell carcinoma (ccRCC) and adjacent normal tissue and to explore its relationship with clinicopathological characteristics and prognosis in ccRCC patients.
Materials and methods
In total, 152 ccRCC patients with available follow-up and clinical data were enrolled, and sample microarrays were prepared for immunohistochemistry studies. The human ccRCC cell lines 786-O, OS-RC-2, A498, and ACHN were cultured for immunofluorescence. The protein concentrations of five ccRCC patients’ tumor and adjacent normal renal tissues were prepared for Western blotting. Chi-squared tests, Fisher’s exact test, Kaplan–Meier analyses, log-rank tests, and Cox regression were performed for statistical analyses.
Results
The immunoreactivity results showed that the Nrf2 and HO-1 proteins were found in consistent locations in vitro and were expressed both in ccRCC and adjacent normal tissues. The two proteins were localized in the cytoplasm and nucleus of RCC tumor cells and in adjacent normal tissue cells. The expression levels of Nrf2 and HO-1 were significantly higher in ccRCC tissues than in the adjacent normal tissues. The Nrf2 protein level was found to be significantly correlated with the tumor size. Additionally, higher protein expression levels of Nrf2 and HO-1 were also correlated with worse overall survival outcomes and could potentially be used to predict the prognosis of ccRCC patients.
Conclusion
Our study provides an important theoretical basis for evaluating the clinical prognosis of ccRCC patients, which implies that the Nrf2/HO-1 axis can be a prognostic factor in ccRCC.
Keywords:
Introduction
Clear cell renal cell carcinoma (ccRCC) is the most common malignant subtype of RCC.Citation1 A heterogeneous group of malignancies originating from renal tubular epithelium cells, ccRCC is identified by specific histopathologic and genetic characteristics.Citation2 ccRCC tends to be misdiagnosed or not diagnosed because of atypical clinical presentation in the early stage, and 20%–40% of patients experience recurrence after surgery.Citation3 Therefore, it is necessary to discover more effective novel biomarkers to use in the evaluation of the clinical prognosis of patients with ccRCC.
Recently, many studies have shown that the progression of tumors is closely related to oxidative stress. Nrf2 a basic leucine-zipper containing transcription factor that binds to the antioxidant responsive element, is a major regulator of many antioxidative and cytoprotective genesCitation4 as well as the downstream sensor and regulator HO-1. Under physiological conditions, the activation of the Nrf2/HO-1 axis is involved in the maintenance of cellular homeostasis and plays a critical role in the adaptive response to cellular stress, representing a crucial factor in cytoprotection, cell survival, and the prevention of carcinogenesis. However, in cancer cells, the prolonged activation of Nrf2 and HO-1 is ambiguous and deleterious. No study has defined Nrf2 and HO-1 protein expression profiles in ccRCC.
In this study, immunohistochemistry (IHC) was performed to investigate the expression profiles of the two proteins in ccRCC and adjacent normal tissues and to assess their associations with various clinicopathological parameters and postoperative survival in ccRCC patients. This study elucidated the roles played by Nrf2 and HO-1 proteins in ccRCC and their potential prognostic value.
Materials and methods
Patients and cell culture
In this retrospective study, archival formalin-fixed paraffin-embedded (FFPE) specimens from 152 ccRCC patients treated from January 2010 to December 2012 at the Fudan University Shanghai Cancer Center were obtained. All patients underwent radical or partial nephrectomy without radiotherapy or chemotherapy before surgery. All specimens were fixed in 10% buffered formalin, dehydrated using an ethanol gradient, and embedded in paraffin. Four-micrometer-thick serial sections were cut and stained using a 3,3′-diaminobenzidine staining kit (Dako, Glostrup, Denmark). The study was conducted in accordance with the Declaration of Helsinki and was also approved by the Clinical Research Ethics Committee of Fudan University Shanghai Cancer Center. Written informed consent was obtained from all the patients.
Patients (103 males and 49 females) with available followup and clinical data were included in the IHC studies. The related data, including age, gender, ROS, Nrf2, HO-1, immunohistochemistry, prognosis, tumor size, T stage, sarcomatoid differentiation status, and lymph node metastasis, were collected from the medical record system. Patient follow-up visits were performed every month during the first year after surgery and every 3 months thereafter until December 31, 2017. Adjacent normal renal tissues obtained from the same patients were used as controls.
The human ccRCC cell lines 786-O, OS-RC-2, A498, and ACHN were cultured in DMEM (Thermo Fisher Scientific, Waltham, MA, USA) supplemented with 10% FBS (Thermo Fisher Scientific), 50 U/mL penicillin, and 50 µg/mL streptomycin (Thermo Fisher Scientific). They were maintained at 37°C and 5% CO2 in a humidified atmosphere.
Immunofluorescence
To investigate the localization of Nrf2 and HO-1 in vivo, immunofluorescence analysis of Nrf2 and HO-1 was performed in 786-O, OS-RC-2, A498, ACHN cell lines using the mouse monoclonal Nrf2 antibody (Santa Cruz Biotechnology, Santa Cruz, CA, USA, sc-365949) and the rabbit polyclonal HO-1 antibody (Abcam, Cambridgeshire, UK, ab13243). Briefly, formaldehyde-fixed cells (2% formaldehyde for 10 minutes) were washed and incubated with primary antibodies for 20 minutes. Then, the cells were washed and incubated with a fluorescent secondary antibody for 15 minutes. The cover slips were mounted onto slides using Dako fluorescent mounting medium (Agilent, Carpinteria, CA, USA). The cells were scanned using a Leica confocal microscope. The excitation source for Alexa 488 was a 20 mW Argon Laser at 488 nm, whereas the excitation source for Alexa 594 was a 1.2 mW Green HeNe Laser at 543 nm.
Western blotting
Five ccRCC patients’ tumor and adjacent normal renal tissues were obtained and lysed in RIPA buffer (Sigma-Aldrich) supplemented with a protease inhibitor (Roche, Basel, Switzerland) and a phosphatase inhibitor (Roche). The protein concentration was measured using a BCA protein assay kit (Thermo Fisher Scientific). The primary rabbit anti-Nrf2 and anti-Ho-1 antibodies were purchased from Abcam.
Immunohistochemical staining
Four-micrometer-thick serial sections were cut from the FFPE tissue blocks for IHC. The slides were heated in an oven at 65°C for 1 hour, then deparaffinized (xylene, three times for 15 minutes) and rehydrated using the following series of washes: 100% ethanol for 5 minutes (repeated twice), 3 minutes in an ethanol gradient (twice at each concentration), and finally twice with PBS (3 minutes each). A pilot experiment was conducted, and according to the test results and design requirements, the experimental protocol was improved and fine-tuned.
Heat-induced epitope retrieval was performed with Tris–EDTA buffer (Servicebio, WuHan, China) in a pressure cooker programmed to run for 30 seconds at 125°C, followed by 10 seconds at 90°C. The samples were then cooled to room temperature over 10–20 minutes. After the slides were washed three times with PBS on a shaker (3 minutes each), endogenous peroxidases were blocked by incubation with 3% H2O2 for 10 minutes. This step was followed by blocking in 10% normal serum in PBS for 1 hour at room temperature.
The primary Nrf2 and HO-1 antibodies (Santa Cruz Biotechnology) were diluted 1:200 in 5% normal serum in PBS and then incubated with the tissue slices overnight at 4°C. On the second day, the slices were warmed for 30 minutes in a 37°C incubator. Then, the slides were washed three times in PBS on a shaker (3 minutes each). The samples were incubated with the secondary antibodies for 30 minutes. The slides were then washed with PBS as before, followed by staining with 3,3′-diaminobenzidine (Dako) for 1–10 minutes at room temperature. Finally, the slides were rinsed in running tap water and counterstained with haematoxylin (Servicebio, WuHan, China) (generally 10 seconds).
Expression scoring
The staining of tumors was quantitated by determining the percentage of positive cells and the staining intensity.Citation5,Citation6 All slides were independently evaluated by three board-certified pathologists, and the observers were required to randomly select five different high-power visual fields (400×) from each section to determine the intensity and extent of positively stained cells. The intensity of cell staining was categorized as follows: 0, no staining; 1, weak staining; 2, moderate staining; and 3, strong staining. The staining extent scores (percentage of cells stained positive) were assigned as follows: 0, no positive cells; 1, <10% positively stained cells; 2, 11%–30% positively stained cells; 3, 31%–60% positively stained cells; 4, 61%–90% positively stained cells; and 5, >90% positively stained cells. The final staining score was calculated by adding the points from the positive cell percentage and the staining intensity. A score of 0 points was considered an absence of expression (–), whereas 1–3 points were weakly positive expression (+). 4–6 points were moderately positive expression (++), and 7–8 points were strongly positive expression (+++).
Statistical analyses
The statistical analyses were performed using SPSS Statistics R23 (IBM, Chicago, IL, USA) and Prism 5.0 (GraphPad, La Jolla, CA, USA) software. To assess the correlations between clinical variables with Nrf2/HO-1 protein expression, the chi-squared test and Fisher’s exact test were used for categorical variables. A chi-squared test was also performed to compare the levels of protein expression of Nrf2/HO-1 between tumor tissues and adjacent benign tissues. As the study endpoint, overall survival (OS) time was defined as the time from surgery until the date of death or last follow-up. To determine statistical significance, the OS rate of all patients was estimated by Kaplan–Meier analysis with a log-rank test. The Cox regression and proportional hazards models were used for univariate/multivariate analysis. All P-values were two-sided. P≤0.05 was considered statistically significant.
Results
Nrf2 and HO-1 were consistently located in vitro and upregulated in human ccRCC tissues
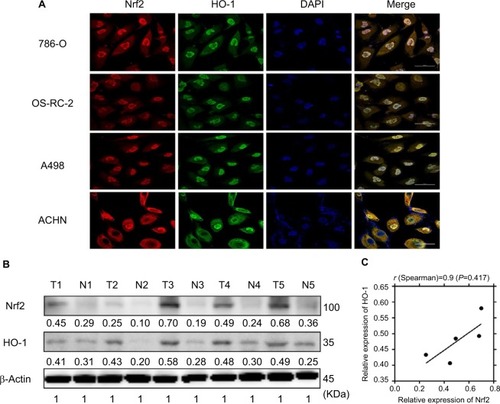
As mentioned in the Introduction section, Nrf2 and the downstream effector HO-1 play important roles in tumorigenesis, but their prognostic value in ccRCC is unknown. Immunofluorescence staining was first performed to assess Nrf2 and HO-1 localization. shows that these two proteins are consistently located in 786-O, OS-RC-2, A498, and ACHN cell lines and are both found in the cytoplasm and the nucleus, which suggests that they may exert their functions jointly. We next compared their expression levels in ccRCC tissues and adjacent normal tissues. shows that compared to normal kidney tissues, both Nrf2 and HO-1 protein levels were upregulated in cancer. This finding confirms previous reports that Nrf2 and HO-1 may act as oncogenes in cancer. Moreover, Spearman’s correlation analysis suggested a significant positive correlation between Nrf2 and HO-1 expression levels (r=0.9, P=0.0417, ), which further confirmed the relationship between Nrf2 and HO-1.
Figure 1 Nrf2 and HO-1 were consistently located in vitro and were upregulated in human ccRCC tissues.
Notes: (A) Nrf2 and HO-1 were consistently located in the 786-O, OS-RC-2, A498, and ACHN cell lines using immunofluorescence. Scale bar, 50µm. (B) Nrf2 and HO-1 protein levels were upregulated in ccRCC tissues. (C) Pearson’s correlation curves are shown, revealing the positive relationship between Nrf2 and HO-1 expression.
Abbreviation: ccRCC, clear cell renal cell carcinoma.
Increased Nrf2/HO-1 protein expression in ccRCC
The protein expression levels of Nrf2/HO-1 in ccRCC were determined by IHC (). Nrf2 and HO-1 were expressed in both ccRCC and adjacent normal tissues. Positive immunostaining was predominantly localized in the cytoplasm, and low levels of nuclear staining were also evident in some cancer cells (). The percentages of ccRCC cells positive for Nrf2 and HO-1 were 78.3% and 85.7%, respectively. Both proteins had significantly higher levels in ccRCC tissues than in the adjacent normal tissues (P<0.05) ().
Figure 2 Nrf2 and HO-1 were expressed both in ccRCC and adjacent normal tissues. Expression scoring was performed as follows: the staining of tumors was quantitated by determining the percentage of positive cells and the staining intensity (Scale bar, 50µm).
Notes: The intensity of cell staining was categorized as follows: 0, negative staining; 1, weak staining; 2, moderate staining; and 3, strong staining. The extent scores (percentages of cells stained positive) were as follows: 0, no positive cells; 1, positive cells staining <10%; 2, 11%–30% of cells; 3, 31%–60%; 4, 61%–90% of cells; and 5, the percentage of positive cells staining >90%. The final staining score was calculated by adding the points from the positive cell percentage and the staining intensity. A score of 0 points was considered negative expression (–), 1–3 points were considered weakly positive expression (+), 4–6 points were considered moderately positive expression (++), and 7–8 points were considered strongly positive expression (+++).
Abbreviation: ccRCC, clear cell renal cell carcinoma.
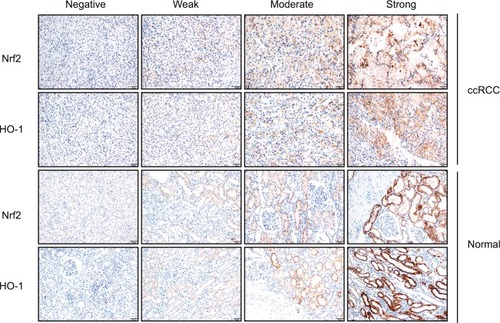
Figure 3 Positive immunostaining was predominantly localized in the cytoplasm.
Notes: Low levels of nuclear staining were also evident in some cancer cells. (A) H&E staining in ccRCC tissue. Scale bar, 20 µm. (B) Some scattered Nrf2 nucleus-positive cells were observed in ccRCC tissue (shown by black arrows, scale bar, 20 µm). (C) Some scattered HO-1 nucleus-positive cells were observed in ccRCC tissue (shown by black arrows, scale bar, 20 µm).
Abbreviation: ccRCC, clear cell renal cell carcinoma.
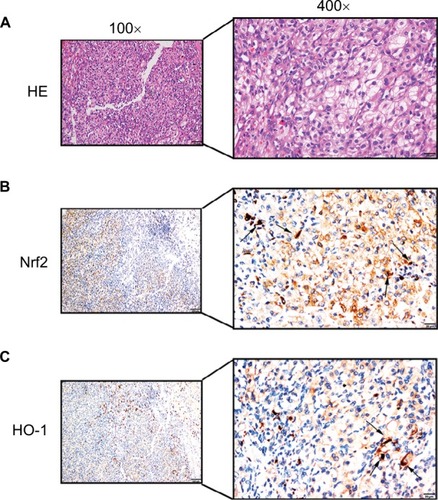
Table 1 The difference expression of Nrf2/HO-1 in ccRCC
Associations between Nrf2 and HO-1 expression and the clinicopathological characteristics of ccRCC patients
Analysis of the correlations between Nrf2 and HO-1 expression levels and clinical parameters showed that there were no statistically significant differences in expression related to age, gender, ISUP grade, T stage, sarcomatoid differentiation, or lymph node metastasis. No significant difference in HO-1 expression was observed in patients with different tumor sizes (P>0.05), whereas significantly higher Nrf2 expression was observed in patients with tumors >9 cm than in those with tumors <9 cm (P<0.05) ().
Table 2 Correlation analysis between Nrf2/HO-1 protein expression and clinicopathological parameters
Correlation between Nrf2 and HO-1 protein expression levels in ccRCC tissue
Among the 108 Nrf2-positive patients, 96 (88.9%) were HO-1 positive and 12 (11.1%) were HO-1 negative. Among the 25 Nrf2-negative patients, 18 (72.0%) were HO-1 positive and 7 (28%) were HO-1 negative. The chi-squared test showed that the differences in the expression of Nrf2 and HO-1 in ccRCC tissues was statistically significant (χ2=4.729, P=0.030, r=0.435) ().
Table 3 Correlation between Nrf2 protein expression and HO-1 protein in ccRCC tissues
Protein expression levels of Nrf2/HO-1 and the prognosis of patients with ccRCC
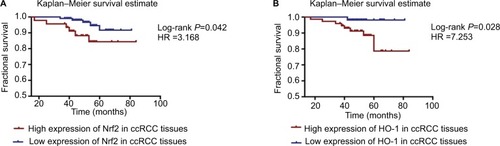
The protein expression levels of Nrf2/HO-1 were used to divide the samples into several groups (). Tissues that were moderately or strongly positive for Nrf2 and HO-1 were labeled as the high-expression group, and those that were negative or weakly positive were labeled as the low-expression group. All patient follow-up information was available. The Kaplan–Meier survival curves were generated to determine the mean survival time (MST) and patient postoperative OS. The results suggested that patients with a high expression level of Nrf2 or HO-1 tended to have a poorer prognosis, with MSTs of 76.88±2.722 and 76.39±1.456 months and OS of 88.2% and 93.1%, respectively, compared with the low Nrf2 or HO-1 expression group (MST: 78.55±1.072 and 80.28±0.716 months; OS: 91.7% and 98.1%, respectively) (). The differences in the expression of Nrf2 and HO-1 in ccRCC were associated with a statistically significant difference in survival curves (Nrf2: χ2=4.127, P=0.042; HO-1: χ2=4.846, P=0.028) ( and ).
Figure 4 Kaplan–Meier survival curves were performed to determine the MST and OS rate.
Notes: (A) Patients with a high expression level of Nrf2 or HO-1 tended to have a worse prognosis. (B) Additionally, patients with a high expression level of HO-1 tended to have a worse prognosis.
Abbreviations: ccRCC, clear cell renal cell carcinoma; MST, mean survival time; OS, overall survival.
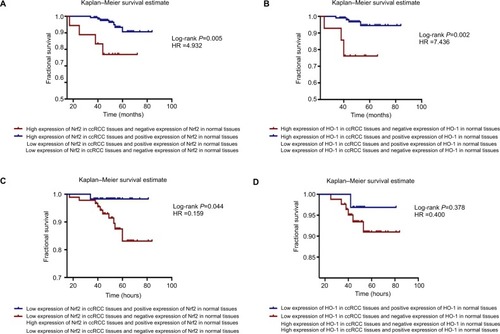
Interestingly, through the joint analysis of Nrf2 and HO-1 protein expression in carcinoma and adjacent normal tissues, we discovered that the group with a high expression level of Nrf2 in cancer tissues but no Nrf2 expression in paracancerous tissues had the worst prognosis of all subgroups (MST =62.65±4.249, OS =76.9%, χ2=8.029, P=0.005), patients with high expression levels of HO-1 in cancer tissues but no HO-1 expression in paracancerous tissues also had poor survival (MST =58.59±3.824, OS =76.2%, χ2=9.601, P=0.002, respectively) ( and ). The HRs of high protein expression levels of Nrf2/HO-1 in ccRCC but not in paracancerous tissues were 4.932 and 7.436, respectively (). However, when the Nrf2/HO-1 protein was expressed at low levels in ccRCC but at higher levels in paracancerous tissues, the patient prognosis was improved; the HRs were 0.159 and 0.400, respectively ().
Figure 5 Simultaneous analysis of the protein expression levels in carcinoma and adjacent normal tissues.
Notes: The Kaplan–Meier survival estimate was performed to determine the MST and OS rate. (A) The group highly expressing Nrf2 in cancer tissues but not in paracancerous tissues had the worst prognosis of all the subgroups (log-rank P=0.005, HR =4.932). (B) There was a group with high expression levels of HO-1 in cancer tissues but not in paracancerous tissues had the worst prognosis (log-rank P=0.002, HR =7.436). (C) Patients with low levels of expression of Nrf2 in ccRCC but positive expression of Nrf2 in paracancerous tissues had better prognoses (log-rank P=0.044, HR =0.159). (D) The HO-1 protein was expressed at low levels in ccRCC and at higher levels in paracancerous tissues, and the patient’s prognosis was better (log-rank P=0.378, HR =0.400).
Abbreviations: ccRCC, clear cell renal cell carcinoma; MST, mean survival time; OS, overall survival.
These results indicate that there are negative correlations between Nrf2/HO-1 protein expression levels and patient OS, and higher levels of expression of both proteins are associated with a worse OS; the subgroup with the worst prognosis is that with high expression level of the Nrf2/HO-1 axis in cancer tissues but no expression in paracancerous tissues.
Table 4 Kaplan–Meier survival analysis based on different subgroups
Univariate and multivariate analyses of the association of clinicopathological factors with OS
Cox univariate regression analysis was performed to investigate the correlations between OS and clinical pathological indexes. Eleven prognostic factors were analyzed and showed that ISUP grade, T stage, the presence of perirenal fatty invasion, and the presence of tumor necrosis or sarcomatoid differentiation were related to poor patient survival (P<0.05), while no associations were found with gender, age, intravenous tumor thrombus, fiber capsule invasion, and other factors, including the expression of Nrf2 or HO-1 (). Notably, a significant difference was observed in the univariate model when we jointly analyzed the protein expression of Nrf2 and HO-1 in carcinoma and adjacent normal tissues. The multivariate analysis identified the prognostic value of tumor T stage as an independent prognostic factor for ccRCC patients ().
Table 5 Cox regression: univariate/multivariate analysis
Discussion
Recently, advancements in the understanding of the important role that ROS play in modulating cellular signaling have greatly expanded our knowledge of the roles of these reactive species in disease processes.Citation7 An increased ROS level may promote significant injury to cell structure and functions,Citation8 such as changing the cellular genetic material and triggering tumors.Citation9,Citation10 Nrf2 is well known as a transcription factor in the regulation of oxidative stress and inflammation and the maintenance of mitochondrial function and nitric oxide equi librium.Citation11 The human Nrf2 gene was first described in 1994 and consists of a 66.1 kDa protein with 589 amino acids,Citation12 which functions as a key trigger in promoting the expression of various antioxidant proteins.Citation13 Intricate networks of intracellular signaling events are involved in the activation of transcription factors. The HO-1 protein has been recognized as the key enzyme in the degradation of heme, and its production involves biliverdin, serum ferritin, and serum bilirubin, which function as antioxidants, maintaining the homeostasis of the cell microenvironment.Citation14 HO-1 is also reported to be a “high-flyer” mediated by Nrf2 to resist anticancer treatments,Citation13 and the Nrf2/HO-1 pathway has been studied in a variety of diseases.Citation15,Citation16 However, the role of the two entities in determining the prognosis of patients tumors, particularly those with ccRCC, is not well defined.
Here, we first determined the localization of the two proteins in vitro and their protein expression levels using immunofluorescence and Western blotting. Then, the correlation between Nrf2/HO-1 expression levels and survival outcomes was analyzed in ccRCC samples. The results showed that the primary locations of Nrf2 and HO-1 were the cytoplasm and nucleus of the tumor, as well as in normal tissues; the two proteins are upregulated in human ccRCC tissues. This finding is consistent with the report by Lister et alCitation17 who observed that Nrf2 levels were significantly elevated in the cytoplasm and nuclei of pancreatic tumor cells compared to the levels in the matching normal tissues. Accordingly, we agree with the view that the primary signaling response to oxidative stress involves facilitating the movement of cytoplasmic Nrf2 into the nucleus. In the normal state, Nrf2 is combined with Keap-1 in the cytoplasm and forms an enzyme–inhibitor complex that prevents Nrf2 from entering the nucleus. According to the “Keap1-Nrf2”Citation18,Citation19 and “latch and hinge” theories,Citation20,Citation21 the increased generation of electrophiles or ROS in patients with various disorders releases the restriction on Keap-1, moving Nrf2 into the nucleus where it combines with the 5′-antioxidant response element, activating the Nrf2 signal transduction pathways. Therefore, redox-stimulated tumors or normal cells will tend to differences in the protein expression levels of Nrf2 and HO-1, and the two proteins could be located in both the cytoplasm and nucleus.
Consistent with the research results in other systems, our IHC experiments showed that the expression of Nrf2 or HO-1 was significantly higher in ccRCC than in normal tissues. However, 78.3% of ccRCC patients were Nrf2-positive, which was higher than the proportion of Nrf2-positive patients among those with colorectal cancer (66.4%),Citation22 gastric carcinoma (61.7%),Citation23 non-small cell lung cancer (26%),Citation24 and gall bladder cancer (23%).Citation25 We believe that this difference might be caused by different materials and methods.
A series of prior studies revealed that Nrf2/HO-1 are overexpressed in a variety of tumor cell lines,Citation26–Citation28 promoting the proliferation of various tumor cells, including renal cell carcinoma cells.Citation29 In our work, the chi-squared test showed that the difference in expression of Nrf2 and HO-1 in ccRCC tissues was statistically significant. Clinical pathological index analysis indicated that Nrf2 was associated with tumor size. Kaplan–Meier survival estimates suggested that patients with high expression of Nrf2 or HO-1 tended to have a worse prognosis than those with low expression levels of the two proteins, whereas patients with high expression levels of Nrf2 or HO-1 in cancer tissues but not in paracancerous tissues had the worst prognosis of all the subgroups analyzed. These results further demonstrate that the Nrf2/HO-1 signaling pathway can promote the development of ccRCC.
The Nrf2/HO-1 proteins can function as a “double-edged sword”Citation30 and are regulated by a number of factors.Citation31,Citation32 These proteins protect normal tissues from the damage caused by ROS.Citation33 At the same time, high expression levels of these proteins may represent the stronger intrinsic power of tumor cells to respond to an adverse environment and to act as antioxidants to protect cancer cells from ROS-mediated injuries.Citation34 For example, Nrf2/HO-1 were reported to enhance drug resistance. Shibata et al found that mutant Nrf2 promoted cell growth and insensitivity to 5-fluorouracil and γ-irradiation.Citation35 Lester et al reported that Nrf2 promoted pancreatic adenocarcinomas and attenuated the effects of chemotherapy.Citation17 These findings may explain why patients who had high expression levels of Nrf2/HO-1 in ccRCC but not in normal tissues exhibited the shortest survival time of all the subgroups.
Conclusion
This is the first report to detect the effect of the protein expression of Nrf2/HO-1 in the prognosis of ccRCC patients. Nrf2 and HO-1 were consistently located in vitro and were upregulated in human ccRCC tissues. Various factors are related to the prognosis of patients with ccRCC, including ISUP stage, T stage, perirenal fat invasion, necrosis, and sarcomatoid differentiation. While the T stage appears to be an independent prognostic factor, it may be important that high expression levels of Nrf2 or HO-1 in patients tended to indicate a worse prognosis, and a high expression in ccRCC but no expression in normal tissues indicated the worst prognosis, showing that the Nrf2/HO-1 axis can be a prognostic factor in ccRCC. These findings provide an important theoretical basis for clinically evaluating the prognosis of ccRCC patients.
Acknowledgments
The research was supported by grants from the Science and Technology Commission of Shanghai Municipality (17ZR1417500), the Shanghai Municipal Commission of Health and Family Planning (201540280), and the National Natural Science Foundation of China (81802361).
Disclosure
The authors report no conflicts of interest in this work.
References
- MochHCubillaALHumphreyPAReuterVEUlbrightTMThe 2016 WHO classification of tumours of the urinary system and male genital organs-part A: renal, penile, and testicular tumoursEur Urol201670110611926996659
- MochHAn overview of renal cell cancer: pathology and geneticsSemin Cancer Biol20132313922722066
- ThomasJSKabbinavarFMetastatic clear cell renal cell carcinoma: a review of current therapies and novel immunotherapiesCrit Rev Oncol Hematol201596352753326299335
- BanerjeePBasuADattaDGasserMWaaga-GasserAMPalSThe heme oxygenase-1 protein is overexpressed in human renal cancer cells following activation of the Ras-Raf-ERK pathway and mediates anti-apoptotic signalJ Biol Chem201128638335803359021808062
- SpechtEKaemmererDSängerJWirtzRMSchulzSLuppAComparison of immunoreactive score, HER2/neu score and H score for the immunohistochemical evaluation of somatostatin receptors in bronchopulmonary neuroendocrine neoplasmsHistopathology201567336837725641082
- LiuRPengJWangHOxysophocarpine retards the growth and metastasis of oral squamous cell carcinoma by targeting the Nrf2/HO-1 axisCell Physiol Biochem20184951717173330231242
- KehrerJPKlotzLOLars-OliverKFree radicals and related reactive species as mediators of tissue injury and disease: implications for healthCrit Rev Toxicol201545976579826610815
- RamadassMCatzSDMolecular mechanisms regulating secretory organelles and endosomes in neutrophils and their implications for inflammationImmunol Rev2016273124926527558339
- ScialòFFernández-AyalaDJSanzARole of mitochondrial reverse electron transport in ROS signaling: potential roles in health and diseaseFront Physiol20178242828701960
- SchieberMChandelNSROS function in redox signaling and oxidative stressCurr Biol20142410R453R46224845678
- Dinkova-KostovaATKazantsevAGActivation of Nrf2 signaling as a common treatment of neurodegenerative diseasesNeurodegener Dis Manag2017729710028534719
- TaguchiKMotohashiHYamamotoMMolecular mechanisms of the Keap1–Nrf2 pathway in stress response and cancer evolutionGenes Cells201116212314021251164
- NaHKSurhYJOncogenic potential of Nrf2 and its principal target protein heme oxygenase-1Free Radic Biol Med201467135336524200599
- ZhangDDMechanistic studies of the Nrf2-Keap1 signaling pathwayDrug Metab Rev200638476978917145701
- ShuklaKSonowalHSaxenaARamanaKVSrivastavaSKAldose reductase inhibitor, fidarestat regulates mitochondrial biogenesis via Nrf2/HO-1/AMPK pathway in colon cancer cellsCancer Lett20174112576328986187
- AmataEPittalàVMarrazzoARole of the Nrf2/HO-1 axis in bronchopulmonary dysplasia and hyperoxic lung injuriesClin Sci2017131141701171228667068
- ListerANedjadiTKitteringhamNRNrf2 is overexpressed in pancreatic cancer: implications for cell proliferation and therapyMol Cancer20111013721489257
- McMahonMThomasNItohKYamamotoMHayesJDDimerization of substrate adaptors can facilitate cullin-mediated ubiquitylation of proteins by a “tethering” mechanism: a two-site interaction model for the Nrf2-Keap1 complexJ Biol Chem200628134247562476816790436
- LuoYEgglerALLiuDLiuGMesecarADvan BreemenRBSites of alkylation of human Keap1 by natural chemoprevention agentsJ Am Soc Mass Spectrom200718122226223217980616
- TongKIKatohYKusunokiHItohKTanakaTYamamotoMKeap1 recruits Neh2 through binding to ETGE and DLG motifs: characterization of the two-site molecular recognition modelMol Cell Biol20062682887290016581765
- KobayashiAKangMIWataiYAkiraKMoon-IlKYorikoWOxi-dative and electrophilic stresses activate Nrf2 through inhibition of ubiquitination activity of Keap1Mol Cell Biol200626122116354693
- HuangPHeYCaoJUp-regulated Nrf2 in colorectal carcinoma and predicts poor prognosisInt J Clin Exp Med20171011034
- ZhengHNongZLuGCorrelation between nuclear factor E2-related factor 2 expression and gastric cancer progressionMed Sci Monit2015212893289926410168
- SolisLMBehrensCDongWNrf2 and Keap1 abnormalities in non-small cell lung carcinoma and association with clinicopathologic featuresClin Cancer Res201016143743375320534738
- ShibataTKokubuAGotohMGenetic alteration of Keap1 confers constitutive Nrf2 activation and resistance to chemotherapy in gallbladder cancerGastroenterology200813541358136818692501
- BaoLJJaramilloMCZhangZBNrf2 induces cisplatin resistance through activation of autophagy in ovarian carcinomaInt J Clin Exp Pathol2014741502151324817946
- BancosSBagloleCJRahmanIPhippsRPInduction of heme oxygenase-1 in normal and malignant B lymphocytes by 15-deoxy-delta(12,14)-prostaglandin J(2) requires Nrf2Cell Immunol20102621182720064636
- LuDYYehWLHuangSMTangCHLinHYChouSJOsteopontin increases heme oxygenase-1 expression and subsequently induces cell migration and invasion in glioma cellsNeuro Oncol201214111367137823074199
- SrinivasanRRickettsCJSourbierCLinehanWMNew strategies in renal cell carcinoma: targeting the genetic and metabolic basis of diseaseClin Cancer Res2015211101725564569
- KimJKeumYSNrf2, a key regulator of antioxidants with two faces towards cancerOxid Med Cell Longev20162016217
- ZhaoHEguchiSAlamAMaDThe role of nuclear factorerythroid 2 related factor 2 (Nrf-2) in the protection against lung injuryAm J Physiol Lung Cell Mol Physiol20173122L155L16227864288
- ZhaoXDongWGaoYNovel indolyl-chalcone derivatives inhibit A549 lung cancer cell growth through activating Nrf-2/HO-1 and inducing apoptosis in vitro and in vivoSci Rep201771391928634389
- LiLTanJMiaoYLeiPZhangQROS and autophagy: interactions and molecular regulatory mechanismsCell Mol Neurobiol201535561562125722131
- LobodaADamulewiczMPyzaEJozkowiczADulakJRole of Nrf2/HO-1 system in development, oxidative stress response and diseases: an evolutionarily conserved mechanismCell Mol Life Sci201673173221324727100828
- ShibataTKokubuASaitoSNrf2 mutation confers malignant potential and resistance to chemoradiation therapy in advanced esophageal squamous cancerNeoplasia201113986487321969819