
Abstract
Purpose
The evidence from recent epidemiological studies investigating the relationship between bone mineral density (BMD) and the risk of breast cancer (BC) remains inconsistent.
Materials and methods
The PubMed, EMBASE, and Web of Science databases were comprehensively searched by two independent authors to identify related cohort studies from the inception of the databases through January 31, 2018. Similarly, two researchers separately extracted the data from the selected studies, and any differences were resolved by discussion. Summarized relative risks (RRs) and 95% CIs were summarized via inverse variance weighted random-effects meta-analysis. Heterogeneity among studies was assessed with the I2 statistic.
Results
Ten studies with 1,522 BC patients among 81,902 participants were included in this meta-analysis. Compared to the participants with the lowest BMD at the lumbar spine, those with the highest BMD had a significantly lower RR for BC (RR =0.75; 95% CI =0.60–0.93; I2=23.0%). In the subgroup analyses, although the directions of the results were consistent with those of the main findings, not all showed statistical significance. We failed to detect an association between BMD at the femoral neck or total hip and the risk of BC (RR =0.94; 95% CI =0.66–1.33; I2=72.5%). Furthermore, the results of the dose–response analysis did not show a significant association between BMD at the lumbar spine, femoral neck, or total hip and the risk of BC. Funnel plot and statistical analyses showed no evidence of publication bias.
Conclusion
There is no relationship between BMD and the risk of BC. More prospective cohort studies are warranted to further investigate this issue.
Introduction
Breast cancer (BC) is the most common cancer (excluding non-melanoma skin cancer) among women worldwide.Citation1 Unsurprisingly, in 2018, BC was expected to account for 30% of all new cancer diagnoses in women in the USA.Citation2 Recently, estrogen has been proven to play an important role in the development and progression of this disease in numerous studies. Several risk factors for BC have been identified, many of which (eg, age at menarche, age at menopause, breastfeeding, and hormone replacement therapy [HRT]) are related to prolonged estrogen exposure.Citation3 Furthermore, it is noteworthy that more than three-quarters of all BC and 85% of BC-related deaths occur in postmenopausal women.
Bone mineral density (BMD) is an essential component of the assessment of bone quality and is utilized to assess the osteoporotic status of the bone for the prevention of osteoporotic fractures. The standard method of assessing BMD is dual-energy X-ray absorptiometry (DXA) of the lumbar spine (LS), femoral neck (FN), or total hip (TH). Moreover, because estrogen regulates bone turnover by inhibiting bone resorption and upregulating hormones that enhance bone formation,Citation4 high BMD is regarded as a marker of prolonged cumulative lifetime exposure to estrogen,Citation5,Citation6 and high BMD serves as an intermediate marker of BC risk. Although the number of prospective cohort studies exploring the role of BMD in the risk of BC has been increasing,Citation7–Citation16 the findings have been inconsistent. This inconsistency might be attributed to different study designs, menopausal status of participants, and BMD measurement methods and sites. Although Nagel et alCitation7 performed a meta-analysis of this topic, the aforementioned differences still existed in their study. Herein, to further clarify the association between BMD and the risk of BC, we performed a systematic review and meta-analysis using currently available evidence from cohort studies.
Materials and methods
Search strategy
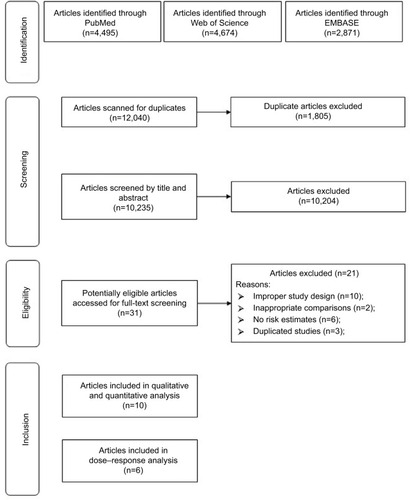
We carried out a systematic review of English language articles published from the inception of the databases to the end of January 2018 in PubMed, EMBASE, and Web of Science that reported the association between BMD and the risk of BC with the following search algorithm: “(bone mineral density OR bone density OR BMD OR osteoporosis) AND (breast) AND (cancer OR neoplasm OR carcinoma OR tumour OR malignancy OR malignancies)”. shows the flowchart detailing the process of identifying eligible studies; 12,040 abstracts were reviewed (by J-HC and QY). We followed the guidelines of the PRISMA.Citation17
Figure 1 Selection of studies for inclusion in this meta-analysis.
Study selection and exclusion
Paired reviewers (J-HC and QY) who have been trained in research methods both independently screened the titles/abstracts and full texts to identify eligible articles, assessed the risk of bias, and extracted data from each eligible study using standardized pilot-tested forms with detailed instructions. Reviewers resolved discrepancies through discussion or, if necessary, arbitration by a third reviewer (S-HZ).
Cohort studies that contained extractable information on BMD and BC outcomes were eligible. Furthermore, studies were included if they reported the relative risks (RRs) with 95% CIs or reported sufficient data to allow the calculation of those risk estimates. We excluded studies that met the following criteria: 1) case–control studies, randomized controlled trials, case reports, editorials, ecological studies, and reviews without original data and 2) studies that failed to provide risk estimates and 95% CIs. If multiple studies had the same participant cohort, only the study with the largest sample size was included for any given outcome.
Data extraction and quality assessment
Data were extracted in duplicate by two independent authors (J-HC and QY) using standardized forms. Disagreements were resolved by consensus. A single investigator (J-HC) extracted the following information from each included study: first author, publication year, geographic location, number of BC patients and controls, BMDs of BC patients and controls, site of BMD measurement, exposure category, and study-specific adjusted RRs with 95% CIs. For risk estimates, if both univariate and multivariate analyses were provided, data from multivariate analysis were extracted; otherwise, data from univariate analysis were used. The extracted data were entered into a standardized Excel spreadsheet (Microsoft Corporation, Redmond, WA, USA). The quality of each study was assessed according to the Newcastle–Ottawa Scale (NOS)Citation18 by two authors (J-HC and QY) independently.
Statistical analysis
The RRs and 95% CIs are presented as summaries of the risk estimates; the RRs were calculated with a random-effects model to investigate the association between BMD and the risk of BC. For studies that only provided the results of a dose–response analysis, we used the scaling method proposed by Danesh et alCitation19 to convert the reported risk estimates into a standard scale of effect to compare persons with levels of exposure in the top tertile to persons with exposure levels in the bottom tertile. More details about this method can be obtained elsewhere. For studies that did not use the lowest category of BMD as the reference,Citation8–Citation10,Citation12,Citation14 we used the effective counts method proposed by Hamling et alCitation20 to recalculate the RRs and 95% CIs.
The method described by Greenland and LongneckerCitation21 was used for the dose–response analysis, and study-specific slopes (linear trends) and 95% CIs were computed from the natural logs of the RRs and CIs across categories of BMD values. This method requires that the distribution of cases and person-years or non-cases and RRs with variance estimates are known for at least three quantitative exposure categories. We assigned the median or mean level of BMD in each category to the corresponding RR for each study. For studies that reported ranges of BMD values, we estimated the midpoint in each category by calculating the average of the lower and upper bounds. When the highest category was open ended, we assumed the length of the open-ended interval to be the same as that of the adjacent interval. When the lowest category was open ended, we set the lower boundary to zero. The dose–response results in the forest plots are presented for 0.1 g/cm2 increments in BMD.
I2 statistic was used to assess the heterogeneity between studies,Citation22 which was the amount of total variation that is explained by the variation between studies.Citation22 Heterogeneity between subgroups was evaluated by meta-regression. Post hoc subgroup analyses were conducted according to the geographic location (North America, Europe, and others), median number of BC cases (≥50 vs <50), exposure unit (g/cm2 vs others), study quality (low risk of bias vs high risk of bias), and menopausal status of participants (postmenopausal vs not postmenopausal), and adjustments were made for potential confounders (including body mass index, menopausal status, HRT use, and any reproductive factors).
We generated a funnel plot and applied Egger’s testCitation23 and Begg’s testCitation24 to examine publication biases (eg, publication bias), with P<0.10 indicating the presence of bias. In addition, we visually explored the funnel plots for asymmetry. We carried out sensitivity analyses by removing one study at a time to examine the effect of the data from each study on the overall estimate. The sequential exclusion strategy proposed by Patsopoulos et alCitation25 was used to determine whether the overall estimates were influenced by the substantial observed heterogeneity. Studies that accounted for the largest proportions of the heterogeneity were sequentially and cumulatively excluded until I2 was <50%. Then, further examinations were conducted to determine whether the risk estimates were consistent before and after the exclusion of those studies.Citation26 All statistical analyses were performed using the Stata statistical software package (version 12.0; StataCorp LP, College Station, TX, USA).
Results
Search results, study characteristics, and quality assessment
In total, 12,040 articles on BMD and BC risk were screened for inclusion (). After the removal of duplicates, 9,937 articles were screened via title and abstract to determine those eligible for full-text review. In total, 36 articles were selected for full-text review. Sixteen articles were excluded for various reasons. Finally, ten articles were selected for inclusion in this systematic review and meta-analysis.
The main characteristics of the ten included cohort studies are presented in . Most of the included studies were conducted in Europe (n=5) and North America (n=4), and one was conducted in Asia. All included studies included data on DXA scanning at the baseline but at different positions, including the LS, FN, and TH. Nine, eight, seven, and five studies adjusted for age, body mass index, menopausal status, and HRT use, respectively, while fewer studies adjusted for cigarette smoking (n=3), physical activity (n=3), alcohol consumption (n=2), and parity (n=2). None of the included studies adjusted for race ().
Table 1 Characteristics of the included cohort studies
provides the details of the study quality assessment as reflected by the NOS scores.
Table 2 Adjustment for potential confounders in the included cohort studies
Table 3 Methodological quality of the included cohort studies
BMD and BC risk (highest vs lowest category)
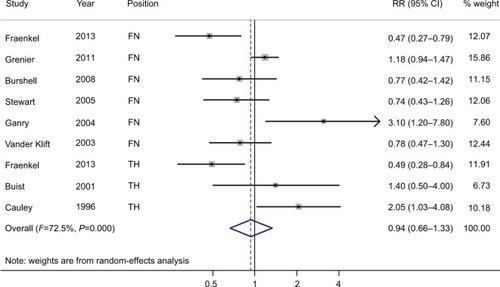
We found that compared with participants with the lowest BMD at the LS, participants with the highest BMD had ~0.75-fold the risk of BC (95% CI =0.60–0.93; I2=23.0%; P for heterogeneity =0.254; n=7), as shown in . In the analysis of BMD at the FN or TH, we failed to detect an association between BMD and BC risk (summarized RR =0.94; 95% CI =0.66–1.33; I2=72.5%; P for heterogeneity <0.001; n=8), as shown in . The funnel plot and statistical analyses showed no evidence of publication bias ( and ).
Figure 2 Forest plot (random-effects model) of bone mineral density at the lumbar spine and the risk of breast cancer.
Note: The squares indicate study-specific RRs (the size of the square reflects the study-specific statistical weight); the horizontal lines indicate 95% CIs; and the diamond indicates the summary RR estimate with its 95% CI.
Abbreviation: RR, relative risk.
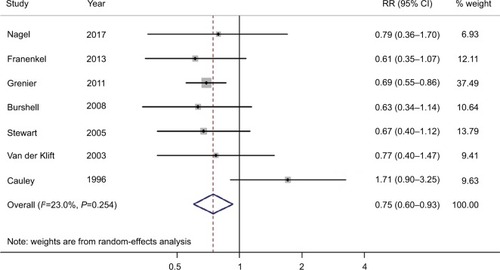
Figure 3 Forest plot (random-effects model) of bone mineral density at the FN or TH and the risk of breast cancer.
Note: The squares indicate study-specific RRs (the size of the square reflects the study-specific statistical weight); the horizontal lines indicate 95% CIs; and the diamond indicates the summary RR estimate with its 95% CI.
Abbreviations: FN, femoral neck; RR, relative risk; TH, total hip.
In subgroup analyses, although the directions of the results were consistent with those of the main findings, not all subgroups showed statistical significance. For example, there was a significant association between BMD at the LS and the risk of BC in the subgroups of studies that used exposure units such as T-score or z score. Furthermore, similar significant results for BMD at the LS and the risk of BC were observed in studies with a high risk of bias and studies with postmenopausal women. However, in meta-regression analyses, there was no evidence of heterogeneity between the subgroups stratified by the study characteristics or those adjusted for confounding factors (), except in the analysis of BMD at the FN or TH. We obtained significant results for differences in the quality of studies in meta-regression analyses. Sensitivity analyses using an alternative statistical model showed robust results (data not shown). Additionally, the sensitivity analysis presented the summarized RR of BMD at the LS for the risk of BC ranged from 0.68 (95% CI =0.58–0.81; I2=0%; exclusion of Cauley et alCitation16) to 0.79 (95% CI =0.58–1.07; I2=31.5%; exclusion of Grenier et alCitation9). Moreover, the sensitivity analysis presented the summarized RR of BMD at the FN or TH for the risk of BC ranged from 0.85 (95% CI =0.61–1.19; I2=69.5%; exclusion of Ganry et alCitation13) to 1.13 (95% CI =0.82–1.56; I2=55.8%; exclusion of Fraenkel et alCitation8). For BMD at the FN or TH, when the studies that contributed the largest amount to between-study heterogeneity were sequentially excluded until I2 was <50%, the summarized HR was 1.03 (95% CI =0.78–1.37; I2=43.4%), which was similar to the original estimate.
Table 4 Risk estimate summary of the association between bone mineral density and the risk of breast cancer (highest category vs lowest category)
BMD and BC risk (dose–response analysis)
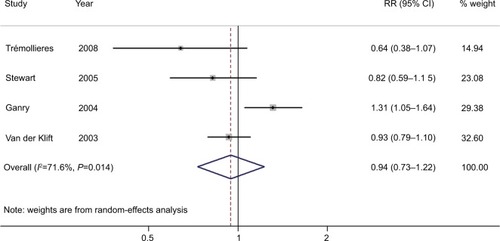
Four studies were included in the dose–response analysis of BMD at the LS, with 234 BC patients among 11,237 participants. The summary RR was 0.94 (95% CI =0.82–1.07) for each 0.1 g/cm2 incremental change in BMD at the LS, with moderate heterogeneity (I2=59.6%; P for heterogeneity =0.059), as shown in . Furthermore, four studies were included in the dose–response analysis of BMD at the FN or TH, with 227 BC patients among 6,668 participants. The summary RR was 0.94 (95% CI =0.73–1.22) for each 0.1 g/cm2 incremental change in BMD at the FN or TH, with significant heterogeneity (I2=71.6%; P for heterogeneity =0.014), as shown in .
Figure 4 Forest plot (random-effects model) of BMD at the lumbar spine and the risk of breast cancer in the dose–response analysis (per 0.1 g/cm2 incremental change in BMD).
Note: The squares indicate study-specific relative risks (the size of the square reflects the study-specific statistical weight); the horizontal lines indicate 95% CIs; and the diamond indicates the summary RR estimate with its 95% CI.
Abbreviations: BMD, bone mineral density; RR, relative risk.
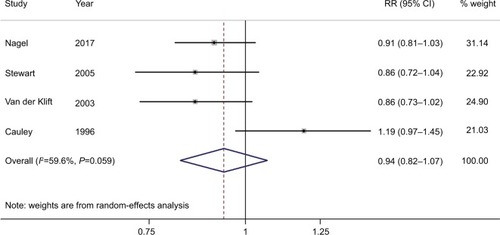
Figure 5 Forest plot (random-effects model) of bone mineral density at the femoral neck or total hip and the risk of breast cancer.
Note: The squares indicate study-specific relative risks (the size of the square reflects the study-specific statistical weight); the horizontal lines indicate 95% CIs; and the diamond indicates the summary RR estimate with its 95% CI.
Abbreviation: RR, relative risk.
Discussion
On the basis of the ten included cohort studies, we found a significant association between BMD at the LS and the risk of BC in a categorical meta-analysis. However, no significant association was observed between BMD at the FN or TH and the risk of BC. Similar null findings were also observed in dose–response meta-analyses.
The present meta-analysis has several strengths. Since we carried out the analyses on the basis of prospective cohort studies, we have effectively avoided recall bias and reduced the possibility of selection bias. Compared with previous meta-analyses, we conducted more detailed subgroup analyses and dose–response analyses. This meta-analysis may also have several limitations that must be taken into consideration. BMD may be associated with other factors, including body mass index, physical activity, alcohol consumption, smoking, reproductive factors, and the use of HRT, which could possibly confound the associations we observed. The direction of results for BMD at the LS persisted in studies that adjusted for these potential confounders; however, statistical significance was only observed in these studies adjusting for body mass index. We could not easily interpret these results because of the limited number of studies in some of these subgroup analyses. There was no evidence of heterogeneity between these subgroups with and without adjustment for these potentially confounding factors. For BMD at the FN or TH, although null results were observed throughout the main subgroup analyses, the direction of the results was not consistent. Further studies are needed to fully adjust for these potential confounders in the future. Second, a high degree of heterogeneity was observed in the analysis of BMD at the FN or TH. In the subgroup analyses, according to study characteristics with adjustment for potential confounders, many of the I2 estimates were judged to be moderate or high. Although we explored the potential sources of heterogeneity, because of the scarcity of the data, most causes of heterogeneity could not be identified. It is noteworthy that we found only study quality to be a source of heterogeneity (P=0.042). These issues may reduce the strength of the conclusions that can be drawn from this meta-analysis. Furthermore, after excluding the study performed by Cauley et alCitation16 in 1996, we observed significant results in the categorical and dose– response analyses. Notably, in that study, they measured BMD twice by different methods, which may explain the significant results we obtained after the exclusion of that study. Third, a limited number of included studies provided information that could be used in the dose–response analyses. Therefore, we could only conduct the dose–response analysis with a limited number of studies.Citation7,Citation11–Citation14,Citation16 Since the BMD measurement units varied among the included studies, a future meta-analysis should perform another dose–response analysis to clarify the association between BMD and the risk of BC. Fourth, the quality of the included studies varied. Interestingly, we only generated significant results after summarizing the high-risk studies, although this phenomenon might be attributed to the limited number of studies. Lastly, most studies investigating BMD and BC risk combined both estrogen receptor (ER)-positive and ER-negative tumors as a single outcome, although estrogen is primarily associated with the development of ER-positive cancers. Furthermore, an ER mutation in the ERα isoform has been described by Fuqua et alCitation27 that is associated with the increased proliferation of BC cells and that has been found in a high percentage of patients with hyperplastic breast tissue.Citation28 If such a mutation was present in both the bone and breast tissue, very low levels of estradiol could preserve BMD and still increase the risk of BC. However, only one included studyCitation12 provided risk estimates stratified by ER status.
In addition to the effects of different study designs, BMD measurement sites, BMD measurement methods, and characteristics of study participants, the inconsistent findings of these published studies might also be attributed to the different menopausal status of the participants in various studies. Significant results were observed in the analysis of BMD at the LS in postmenopausal participants (). Because BMD could be a marker of cumulative exposure to estrogen, this effect could be more apparent in postmenopausal women than in premenopausal women. Furthermore, the rates of HRT use were different among these studies. For example, Stewart et alCitation12 reported that over half the women had received HRT at some point by the end of the study in a population-based screening program for osteoporosis risk. Additionally, they found that those with low baseline levels of BMD were more likely to receive HRT. However, the FraminghamCitation29 and RotterdamCitation14 studies included all subjects and had 17.7% and 10.2% of their participants who reported the use of HRT, respectively. Therefore, it may be that those in the lowest quartile of BMD were taking HRT, thereby increasing their risk of BC and while not increasing their BMD. Although we could not perform an analysis stratified by the use of HRT, interestingly, we found significant results in the subgroup analysis that did not adjust for HRT use. More studies should focus on this issue.
In summary, on the basis of the present meta-analysis, we were unable to demonstrate an association between BMD and the risk of BC.
Author contributions
J-HC, QY, Y-NM, and D-LW designed the research; J-HC and QY conducted the research; QY and S-HZ analyzed data; J-HC and QY wrote the draft; and all authors contributed to data analysis, drafting and revising the article, gave final approval of the version to be published, and agree to be accountable for all aspects of the work.
Supplementary materials
Figure S1 Test for publication bias for bone mineral density at the lumbar spine through Begg’s funnel plot.
Notes: The circles represent real studies. The vertical lines represent the summary effect estimates, and the dashed lines represent pseudo-95% CI limits.
Abbreviations: RR, relative risk; SE, standard error.
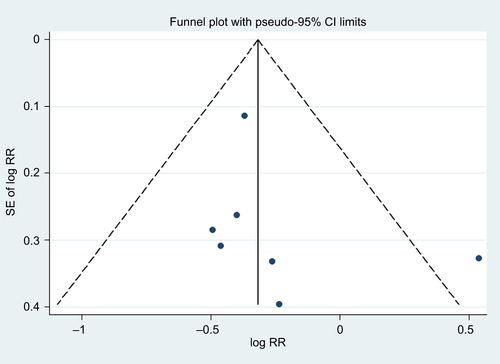
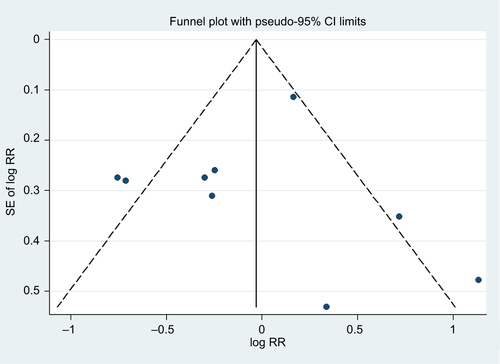
Figure S2 Test for publication bias for bone mineral density at the femoral neck or total hip through Begg’s funnel plot.
Notes: The circles represent real studies. The vertical lines represent the summary effect estimates, and the dashed lines represent pseudo-95% CI limits.
Abbreviations: RR, relative risk; SE, standard error.
Disclosure
The authors report no conflicts of interest in this work.
References
- TorreLABrayFSiegelRLFerlayJLortet-TieulentJJemalAGlobal cancer statistics, 2012CA Cancer J Clin20156528710825651787
- SiegelRLMillerKDJemalACancer statistics, 2018CA Cancer J Clin201868173029313949
- RojasKStuckeyABreast cancer epidemiology and risk factorsClin Obstet Gynecol201659465167227681694
- VäänänenHKHärkönenPLEstrogen and bone metabolismMaturitas199623SupplS65S698865143
- GuthrieJRLehertPDennersteinLBurgerHGEbelingPRWarkJDThe relative effect of endogenous estradiol and androgens on menopausal bone loss: a longitudinal studyOsteoporos Int2004151188188615042284
- RapuriPBGallagherJCHaynatzkiGEndogenous levels of serum estradiol and sex hormone binding globulin determine bone mineral density, bone remodeling, the rate of bone loss, and response to treatment with estrogen in elderly womenJ Clin Endocrinol Metab200489104954496215472191
- NagelGPeterRSKlotzEBrozekWConcinHBone mineral density and breast cancer risk: results from the Vorarlberg Health Monitoring & Prevention Program and meta-analysisBone Rep20177838929018837
- FraenkelMNovackVLielYAssociation between bone mineral density and incidence of breast cancerPLoS One201388e7098023940680
- GrenierDCookeALLixLMetgeCLuHLeslieWDBone mineral density and risk of postmenopausal breast cancerBreast Cancer Res Treat2011126367968620838879
- BurshellALSongJDowsettSARelationship between bone mass, invasive breast cancer incidence and raloxifene therapy in postmenopausal women with low bone mass or osteoporosisCurr Med Res Opin200824380781318254988
- TrémollieresFAPouillèsJMLaparraJRibotCBone mineral density at menopause does not predict breast cancer incidenceOsteoporos Int200819101497150418373052
- StewartAKumarVTorgersonDJFraserWDGilbertFJReidDMAxial BMD, change in BMD and bone turnover do not predict breast cancer incidence in early postmenopausal womenOsteoporos Int200516121627163215782281
- GanryOBaudoinCFardellonePPengJRaverdyNBone mass density and risk of breast cancer and survival in older womenEur J Epidemiol200419878579215469036
- van der KliftMde LaetCECoeberghJWHofmanAPolsHARotterdam StudyBone mineral density and the risk of breast cancer: the Rotterdam studyBone200332321121612667548
- BuistDSLacroixAZBarlowWEBone mineral density and endogenous hormones and risk of breast cancer in postmenopausal women (United States)Cancer Causes Control200112321322211405326
- CauleyJALucasFLKullerLHVogtMTBrownerWSCummingsSRBone mineral density and risk of breast cancer in older women: the study of osteoporotic fractures. Study of Osteoporotic Fractures Research GroupJAMA199627617140414088892715
- MoherDLiberatiATetzlaffJAltmanDGPRISMA GroupPreferred reporting items for systematic reviews and meta-analyses: the PRISMA statementBMJ2009339b253519622551
- WellsGASheaBO’ConnellDThe Newcastle–Ottawa scale (NOS) for assessing the quality of nonrandomised studies in meta-analyses Available from: http://www.ohri.ca/programs/clinical_epidemiological/oxford.aspAccessed August 26, 2018
- DaneshJCollinsRApplebyPPetoRAssociation of fibrinogen, C-reactive protein, albumin, or leukocyte count with coronary heart disease: meta-analyses of prospective studiesJAMA199827918147714829600484
- HamlingJLeePWeitkunatRAmbühlMFacilitating meta-analyses by deriving relative effect and precision estimates for alternative comparisons from a set of estimates presented by exposure level or disease categoryStat Med200827795497017676579
- GreenlandSLongneckerMPMethods for trend estimation from summarized dose–response data, with applications to meta-analysisAm J Epidemiol199213511130113091626547
- HigginsJPThompsonSGQuantifying heterogeneity in a meta-analysisStat Med200221111539155812111919
- EggerMDavey SmithGSchneiderMMinderCBias in meta-analysis detected by a simple, graphical testBMJ199731571096296349310563
- BeggCBMazumdarMOperating characteristics of a RANK correlation test for publication biasBiometrics1994504108811017786990
- PatsopoulosNAEvangelouEIoannidisJPSensitivity of between-study heterogeneity in meta-analysis: proposed metrics and empirical evaluationInt J Epidemiol20083751148115718424475
- OdutayoAWongCXHsiaoAJHopewellSAltmanDGEmdinCAAtrial fibrillation and risks of cardiovascular disease, renal disease, and death: systematic review and meta-analysisBMJ2016354i448227599725
- FuquaSAWiltschkeCZhangQXA hypersensitive estrogen receptor-alpha mutation in premalignant breast lesionsCancer Res200060154026402910945602
- CauleyJASongJDowsettSAMershonJLCummingsSRRisk factors for breast cancer in older women: the relative contribution of bone mineral density and other established risk factorsBreast Cancer Res Treat2007102218118817028986
- ZhangYKielDPKregerBEBone mass and the risk of breast cancer among postmenopausal womenN Engl J Med199733696116179032046