
 ?Mathematical formulae have been encoded as MathML and are displayed in this HTML version using MathJax in order to improve their display. Uncheck the box to turn MathJax off. This feature requires Javascript. Click on a formula to zoom.
Abstract
Background:
Stanniocalcin 2 (STC2) expression is upregulated under multiple stress conditions including hypoxia, nutrient starvation and radiation. Overexpression of STC2 correlates with tumor progression and poor prognosis.
Purpose:
We previously demonstrated that overexpression of STC2 in nasopharyngeal carcinomas (NPC) positively correlates with radiation resistance and tumor metastasis, two major clinical obstacles to the improvement of NPC management. However, it remains elusive whether STC2 expression is a critical contributing factor for post-radiation survival and metastasis of NPC cells.
Materials and methods:
Using the radiation resistant CNE2 cell line as a model, we examined the importance of STC2 expression for post-radiation survival, migration and invasion. Here, we report the establishment of STC2 knockout lines (CNE2-STC2-KO) using the CRISPR/Cas9-based genome editing technique.
Results:
Compared with the parental line, STC2-KO cells showed similar proliferation and morphology in normal culture conditions, and loss of STC2 did not compromise the cell tumorigenicity in nude mice model. However, STC2-KO lines demonstrated increased sensitivity to X-radiation under either normoxic or hypoxic conditions. Particularly, upon X-radiation, parental CNE2 cells only slightly whereas STC2-KO cells remarkably decreased the migration and invasion ability. Cell cycle analysis revealed that loss of STC2 accumulated cells in G1 and G2/M phases but decreased S-population.
Conclusion:
These data indicate that the expression of STC2, which can be stimulated by metabolic or therapeutic stresses, is one important factor to promote survival and metastasis of post-radiation NPC cells. Therefore, targeting STC2 or relative downstream pathways may provide novel strategies to overcome radiation resistance and metastasis of NPC.
Introduction
NPC is the most common type of cancer among all head and neck malignancy in South-East Asia. Currently, the standard treatment for NPC is radiotherapy alone or in combination with chemotherapy. Radiation resistance and post-radiation metastasis are two major leading causes of treatment failure. Therefore, how to overcome radiation resistance and post-radiation metastasis of NPC remains an important question to be addressed.
Human stanniocalcin 2 (STC2) is a glycoprotein of 302-amino acids, with 34% identity to its homolog STC1, the prototype stanniocalcin initially identified from bony fish where it regulates calcium homeostasis in fish living in freshwater.Citation1,Citation2 Accordingly, human stanniocalcins were initially proposed to regulate mineral metabolism.Citation3,Citation4 In normal human tissues, STC1 and STC2 show tissue-specific expression patterns. STC2 is highly expressed in selected tissues, particularly in smooth muscle and cardiac muscle, indicating a tissue-specific, conditionally required role of STC2 for normal cell physiology.
By analyzing archived nasopharyngeal carcinoma samples and relative clinicopathological data, we previously found that STC2 overexpression correlated with radiation resistance, recurrence and metastasis in NPC.Citation7 Consistently, increased STC2 levels correlate with invasiveness, metastasis and poor prognosis in ovarian cancer,Citation8 breast cancers,Citation9 neuroblastoma,Citation10 prostate cancer,Citation11 esophageal squamous cell carcinoma (ESCC),Citation12 gastric cancer,Citation13 lung cancers,Citation14 colorectal cancerCitation15 and renal cell carcinoma (RCC).Citation16 However, the importance of STC2 in promoting cancer invasiveness and metastasis remains unclear. Particularly, it remains unknown whether STC2 expression is important for radiation resistance and post-radiation metastasis of NPC.
In addition to NPC, STC2 overexpression has been observed in many other human tumors, including breast cancer,Citation17,Citation18 prostate cancer,Citation11 ESCC,Citation12 gastric cancer,Citation13 colorectal cancer,Citation15 RCCCitation16 and neuroblastoma.Citation10 While the molecular mechanisms underlying its regulation remains elusive, hypoxia has been reported to upregulate STC2 transcription through hypoxia-inducible factor-1, a transcription factor stabilized and activated by hypoxia and other oncogenic pathways,Citation8,Citation19 indicating tumor-specific microenvironment is a contributing factor to STC2 upregulation. In addition, STC1 was reported to be a negative indicator of prognosis of certain types of cancers.Citation20
We hypothesize that STC2 upregulation plays a critical role in mediating radiation resistance and metastasis of NPC. Taking radiation resistant CNE2 line as a model and using CRISPR/Cas9-based genome editing technology, we established STC2 knockout CNE2 lines (CNE2-STC2-KO), and thereafter investigated the potential effects of STC2 knockout on CNE2 cells response to X-radiation. We found that loss of STC2 compromised clonogenic ability post-radiation. Particularly, STC2-KO cells demonstrated reduced invasion and migration ability post-radiation comparing to the parental cells. Cell cycle analysis revealed that loss of STC2 accumulated cells in G1 and G2/M phases, consistent with increased DNA damage and cytotoxicity. Taken together, these data indicate that STC2 expression, which can be stimulated by either metabolic or therapeutic stresses, is one important factor to promote NPC cell survival and metastasis post-radiation.
Materials and methods
Ethical statement
This study was approved by the Ethical Review Committee of Fujian Cancer Hospital (approval no. K201412). The animal experiment was performed in strict accordance with the protocol (SYXK(FJ)2013-004) and guidelines from the Institutional Animal Care and Use Committee at the Fujian Cancer Hospital.
Immunohistochemistry
Paraffin blocks that contained sufficient formalin-fixed tumor specimens were cut into 3 μm sections and mounted on silane-coated slides for immunohistochemical staining analysis. Sections were deparaffinized with dimethylbenzene and rehydrated consecutively using sequential ethanol (100%, 95%, 90%, 85%, 80% and 75%). Antigen retrieval was done in 0.01 M sodium citrate buffer (121°C for 2 mins, pH 6.0), and endogenous peroxidase was blocked by incubating slides in 3% H2O2 for 10 mins at room temperature. The sections were then washed in PBS and incubated with anti-STC2 (1:100 dilution, Abcam, USA) at 4°C for 12 hrs. Subsequently, sections were washed three times in PBS and incubated with the horseradish peroxidase (HRP)-conjugated secondary antibody for 30 mins at room temperature. Signals were detected using DAB substrate (Maixin Co., Fuzhou, People’s Republic of China). All slides were counterstained with 20% hematoxylin, dehydrated and mounted. Slides stained with antibody solution buffer were used as negative controls.
Cell lines and cell culture
Human NPC cell line CNE-2 was obtained from the Cell Bank of Chinese Academy of Sciences (Beijing, People’s Republic of China). CNE-2 cells were cultured in RPMI-1640 culture medium supplemented with 10% new-born calf serum, 100 U/mL penicillin (Sigma-Aldrich) and 100 μg/mL streptomycin (Sigma-Aldrich) at 37°C in water-jacket incubator with 5% CO2. RPMI-1640 was purchased from Hyclone (SH30809.01, USA). Trypsin was bought from Amresco (0258-25G, USA). New-born calf serum was obtained from Zhejiang Tianhang Biological Technology Co., Ltd. (22011-8612/22011-8615, Deqing County, Zhejiang Province, People’s Republic of China).
Establishment and characterization of CNE2-STC2-KO lines
For CRISPR/Cas9-mediated genome editing, target primers were designed using online CRISPR design tool (http://crispr.mit.edu/), and engineered into pX330 plasmid following the procedure from Zhang lab (http://www.genome-engineering.org/crispr). The following are the guide RNA sequences for STC2 knock out: STC2_77_Forward Sequence: 5ʹ-ACCGTGCCTCGGGCATGGGCGTTT-3ʹ; STC2_77_Reverse sequence: 5ʹ-AAACAAACGCCCATGCCCGAGGCAC-3ʹ. The engineered plasmid to express both Cas9 and the STC2 gRNA (5 μg) was cotransfected with pcDNA3 (0.25 μg), the later providing a Neo marker for subsequent G418 selection. Selected individual colonies (STC2-KO) were expanded, screened through Western blotting and confirmed by genomic PCR, followed by T7 endonuclease 1 digestion (NEB #E3321).
Hypoxia and glucose starvation
Cells were flushed with a gas mixture of 1% O2, 5% CO2, and balanced N2 in hypoxia work stations (3131, Thermo scientific, USA). Normal culture media contain 25 mM glucose, while for glucose starvation, medium with 2.5 mM glucose was used.
RNA extraction and qRT-PCR
Total RNA was extracted with RNeasy Plus Mini Kit (74134, QIAGEN, Germany). Complement DNA was synthesized using ReverAid First Strand cDNA Synthesis Kit (k1622, Thermo Scientific, USA) with random hexamers. qRT-PCR was performed using LightCycler 480 SYBR Green I Master Kit (04707516001, Roche, Switzerland) and LightCycler 480® II Real-Time PCR System (Roche, Switzerland). β-actin was detected and used as internal control. Primers STC2 (sense primer 5ʹ-GCCTGTGCTCCATCTTG-3ʹ, antisense primer 5ʹ-TTTGGGTGGCTCTTGC-3ʹ), β-actin (sense primer 5ʹ-GGAAATCGTGCGTGACATT-3ʹ, antisense primer 5ʹ-CAGGCAGCTCGTAGCTCTT-3ʹ) were used. The primers were designed with Primer Premier 5.0 software (PREMIER Biosoft, USA) and synthesized by Invitrogen (Shanghai, People’s Republic of China). qPCR assays were performed in 20 μL reactions with 10 µM of each primer, and Master mix 10 µL. The reactions were preheated at 95°C for 10 mins followed by 40 cycles (95°C for 10 s, 60°C for 10 s, 72°C for 20 s). The values of 2−ΔΔCt were used to indicate the relative mRNA levels.
Nude mice model and tumorigenicity studies
Tumorigenicity studies were carried out using 6-week old, male Balb/c nude mice (CAnN.Cg-Foxn1nu/Crl), which were purchased from Shanghai Silaike Experiment Animal Co.,Ltd, with authentication #SCSK(SH)2012-002. Mice were housed in the Animal Experimental Center of Fuzhou General Hospital by following the approved protocol (SYXK(FJ)2013-004). Briefly, the environment was kept pathogen free with controlled temperature of 22°C and a relative humidity of 50%. To test tumorigenicity of cancer cells, cultured cells were digested with 0.25% trypsin in order to prepare single cell suspension, which then were thoroughly washed with 1×PBS 3 times and finally resuspended in serum-free RPMI-1640 media to achieve a density of 1×10⁷ cells/mL. For nude mouse inoculation, 100 µL (1×10⁶ cells) of cell suspension were injected subcutaneously to the left chest region. After inoculation, the tumorigenicity was monitored up to 8 weeks.
Radiation treatment of cancer cells
Cancer cell radiation was performed at room temperature with an ELEKTA accelerator (6MV X, Sweden) with a radiation field of 30 cm×30 cm. Cells were radiated at a distance of 100 cm, with a radiation strength of 285 cGy/min.
For radiation sensitivity assays, cells were cultured in a water-jacketed cell culture incubator until reaching 80% confluence, then cells were digested with 0.25% trypsin to create single cell suspension and re-seeded into 25-T flasks. When cell density reached 40–50%, the flasks were divided into four groups randomly. Two groups were kept in 21% O2 while the other two groups were cultured under 1% O2. After reaching about 80% confluence, cells were exposed to 4 Gy X radiation, followed by other studies.
Western blotting analyses
Anti-STC2 antibody (Ab63057) was purchased from Abcam (USA). Anti-HIF-1α antibody was purchased from Cell Signaling Technology (USA). Anti-α-tubulin and all horseradish peroxidase-coupled secondary antibodies were purchased from Thermo Scientific or Sigma (USA).
Cultured cells were used to prepare total cell lysis following the previously published procedure. After 12,000 g centrifugation at 4°C for 10 mins, supernatant was collected and protein concentration was determined using PierceTMBCA Protein Assay Kit (Thermo scientific, USA). Same amount of protein samples were separated through electrophoresis in 10% SDS-PAGE, followed by electro-transferring to PVDF membrane. Then, the membrane was blocked with 3% non-fat dry milk overnight and washed with TTBS (20 mM Tris-HCl, 150 mM NaCl, 0.1% Tween-20, pH 7.2), three times prior to incubation with primary antibody for 4 hrs. After three washes with TTBS, the membrane was incubated with HRP-labelled secondary antibody for 3 hrs. After the washes with TTBS, the membrane was finally developed with ECL kit, and imaged with a multi-functional imaging system (4000 MM PRO, Carestream, Canada).
Trypan blue staining
Cell survival rates were estimated based on cell counting after Trypan Blue staining (Amresco, USA). Briefly, CNE-2, CNE2-STC2-KOA and CNE2-STC2-KOB cells were cultured under either normoxic or hypoxic conditions overnight. After radiation and re-culturing, cells were digested with 0.25% trypsin to obtain single cell suspension. 0.4% trypan blue was added to a final concentration of 0.04%. Dead and living cells were separately counted using a light microscope and hematocytometers. The cell survival rates were calculated as in the following: Survival rate (%)=(living cell number/total cell number)×100%.
Post-radiation clonogenic assays
Cells were seeded in 6-well culture plates. Radiation was performed as described above. A single dose of 0, 2, 4, 6, 8 and 10 Gy for cell numbers of 100, 200, 400, 800, 1,600 and 3,200 cells/well, respectively. After radiation, cells were cultured for 14 days with a medium change every other day. Cell culture dishes were stained with crystal violet and examined under light microscopy. Clusters of ≥50 cells were considered valid colonies which were counted. Survival fraction (SF) was calculated based on the following equations:
Based on the established standard multiple targets, single hit model and cell survival curve fitting [SF=1–(1–e−D/D0)N], D0 (lethal dose), Dq (quasi-threshold dose), N (extrapolation number) and SF2 (SF of 2 Gy) were deduced. Finally, sensitivity enhancing ratio (SER) was calculated.
Flow cytometric analysis of apoptosis
Apoptosis was examined with BD CycletestTMPlus DNA Reagent Kit (340,242) and BD PharmingenTM FITC Annexin V Apoptosis detecting Kit I (BD Biosciences). The assays were performed following the manufacturer’s instruction. Briefly, cells were digested with 0.25% trypsin to prepare single cell suspension, which was centrifuged at 1,000 g for 5 mins, and washed with chilled PBS. After the final centrifugation, cells were re-suspended in 100 μL of binding buffer, mixed with 5 μL Annexin V-FITC and 5 μL Propidium Iodine included in the assay kits, and incubated at room temperature in dark for 15 mins. Flow cytometric analysis was performed with exciting wavelength of 488 nm, and emission wavelength of 530 nm (BD FACSCANTO II, US).
Cell cycle analysis
CNE2 and CNE2-STC2-KO cells at approximately 60% confluence were exposed to X-radiation at doses of 0 and 4 Gy, respectively. Then, cells were digested with 0.25% trypsin in order to prepare single cell suspension. After washing with PBS, cells were stained with the cell cycle detection kit (BD Biosciences, San Diego, CA, USA) following the manufacturer’s instructions, and analyzed with an FACSCantoTMII flow Cytometer (BD Biosciences; San Jose, CA, USA). All analyses were repeated in triplicate.
Cell migration assays
The Cell Culture Inserts (Millicell) were purchased from Millipore (CAT NO: PIEP12R48, Switzerland). Cell migration assays were performed as described previously.Citation21 The lower chamber surface of the Inserts was evenly coated with 10 μL fibronectin (1 mg/mL). The coated inserts were placed in 24- well cell culture plates and placed in 37°C incubator for 4 h prior to assays. Single cell suspension was diluted with serum-free RPMI-1640 media to a final density of 2×10⁵ cells/mL. 100 μL cell suspension was added into the upper chambers of the inserts, while 600 μL RPMI-1640 containing 20% calf serum were added into the lower chamber. The set-up was cultured in a water-jacketed cell culture incubator for 24 hrs. After removal of non-migrated cells on the upper chamber side, the inserts were fixed in 100% methanol for 30 mins, dried and stained with 0.1% Crystal Violet Staining Solution (cat #: C0121, Beyotime, People’s Republic of China) for 15 min. After a thorough wash with water, the insert membranes were observed under a microscopy (200 ×). Total numbers of migrating cells of each optic field (up, down, left, right, center) were obtained and recorded. The mean of migrated cells was calculated based on three independent experiments.
Cell invasion assays
Matrigel was purchased from CORNING (cat #: 356,234, Bedford, MA, USA). Cell invasion assays were performed as described previously.Citation21 The Matrigel was dissolved and mixed with serum-free media at 4°C. Into each of the upper chamber of the Cell Culture Inserts, 100 μL Matrigel-mix were added. The hanging cell culture was then incubated in a cell culture incubator for 2 hrs for Matrigel to cure. Single cell suspension was diluted with serum-free RPMI-1640 media to final density of 2×10⁵ cells/mL. 100 μL cell suspension was added into the upper chamber of the Inserts, with 600 μL RPMI-1640 containing 20% calf serum in the lower chamber. The set-up was cultured in a water-jacketed cell culture incubator for 48 hrs. After removal of cells and Matrigel on the upper chamber side, the insert membranes were processed as described in cell migration assays.
Statistical analysis
SPSS17.0 was used for statistical analysis. Data from different groups were subjected to Student's t-test and One-way ANOVA. P<0.05 was set as significant difference.
Results
STC2 expression is upregulated by metabolic stress commonly existing in solid tumors
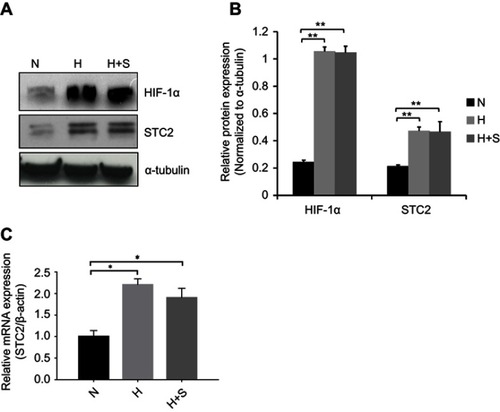
Previously, we showed that STC2 overexpression positively associates with radiation resistance and metastasis in NPC patients; however, potential causes that trigger STC2 overexpression in NPC remain unclear. Hypoxia was reported to upregulate STC2 expression in other tumor models, and both hypoxia and glucose starvation are common consequences of insufficient angiogenesis in rapid growing solid tumors. Using unbiased genome-wide gene expression profiling of hepatocellular carcinoma cells, we identified STC2 as one of those genes commonly upregulated by metabolic stress, such as hypoxia, glucose depletion or glutamine depletion (collectively, nutrient depletion). To investigate if common metabolic stress is sufficient to trigger STC2 expression in CNE2 cells, we exposed cultured CNE2 cells under hypoxia or combination of hypoxia and glucose starvation conditions. Western blotting analyses and qPCR indicate that either hypoxia or combination of hypoxia and glucose starvation is sufficient to upregulate STC2 expression (P<0.01, and ; P<0.05, ), suggesting metabolic stresses commonly associated with solid tumor microenvironment could be a cause of STC2 upregulation in NPC.
Figure 1 Metabolic stress upregulates STC2 expression in CNE2 cells.
Notes: CNE2 cells were cultured under hypoxia (H) or combined hypoxia and glucose starvation (H+S) conditions for 16 hrs. (A) Whole cell lysates were prepared, and Western blotting was used to determine the levels of STC2. HIF-1α was examined as indicator of hypoxia, and α-tubulin was determined as loading control. (B) Three independent Western blots performed under the identical experimental conditions, and results were quantified based on signal density. Error bars are mean± SD(n=3). **P<0.01. (C) Total RNA was extracted, and mRNA levels of STC2 were determined by quantitative real-time PCR after reverse transcription. *P<0.05.
Abbreviations: N, normal culture condition (21% O2, 25 mM glucose); H, hypoxia (1% oxygen); H+S, hypoxia (1% oxygen) and glucose starvation (2.5 mM).
Establishment and characterization of CNE2-STC2-KO lines
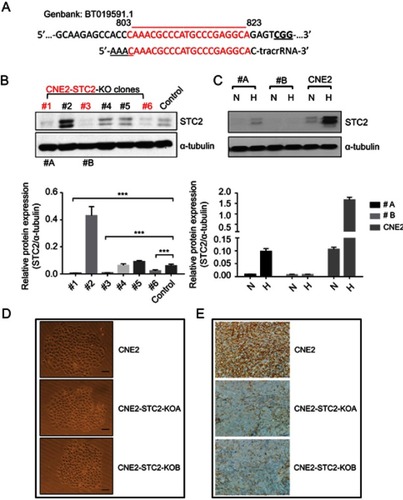
To evaluate the importance of STC2 overexpression in NPC cells, we used the CRISPR/Cas9-based genome editing to knock out STC2 in CNE2 cells. Using an online tool, we designed a gRNA sequence to target nucleotides 803-823 (GenBank: BT019591.1). Oligos of both strands were designed and synthesized (). After annealing, the double-stranded DNA fragment with designed compatible sticky ends were inserted into pX330 to express the gRNA, along with tracRNA for Cas9 recognition. After G418 selection and expanding cell clones, we screen the cell clones by Western blotting analyses to check the knockout effects (). Clone#1 and #3 in showed overt knockout effects (P<0.001), so they were further expanded and designated as CNE2-STC2-KOA and CNE2-STC2-KOB, respectively. Next, we cultured these two KO clones along with parental CNE2 under normoxic and hypoxic conditions. We observed that hypoxia-mediated upregulation of STC2 was apparent in the parental CNE2 line whereas CNE2-STC2-KOA or KOB ones showed residual levels of STC2 under hypoxia condition (). To determine the effect of loss of STC2 on general cell morphology, we used limiting dilution to culture both parental CNE2 and KO lines to observe cell morphology and colony formation in rapid clonal proliferation. As shown in , loss of STC2 did not alter the general morphology of CNE2 cells. To address if loss of STC2 impairs the tumorigenicity of CNE2, we prepared single cell suspension in serum-free medium, and subcutaneously injected these cells into three nude mice for each cell line and housed the mice up to 8 weeks. We observed that both CNE2 and KO lines generated tumor xenografts, which were confirmed by pathologists, and STC2 expression status was confirmed by immunohistochemical staining (). Taken together, these data indicate that we have established CNE2-STC2-KO lines, which maintain morphology in regular culture and tumorigenicity in nude mice similar to parental CNE2 cells. The CNE2 and genetically matched CNE2 STC2 KO lines provide a model system to further investigate the importance of STC2 in radiation resistance and post-radiation metastasis.
Figure 2 Establishment and characterization of STC2 knockout CNE2 cells.
Notes: (A) CRISPR/Cas9 was used to knock out STC2 in CNE2 cells. The DNA sequence encoding gRNA was designed to target an exon region corresponding to nt#803–823. (B) Protein levels of STC2 and α-tubulin (as loading control) were determined by Western blots to screen for knockout lines. ***P<0.001. (C) Clone#1 and #3 were further purified, expanded and named as CNE2-STC2-KOA and CNE2-STC2-KOB, which were cultured in either normoxic or hypoxic condition. Hypoxia-mediated upregulation of STC2 was apparent in parental CNE2 line, but only barely seen in the two knockout lines. (D) Loss of STC2 does not alter the general morphology of CNE2 cells. Cells were grown in low density to observe colonized proliferation. Images were taken under light microscope (100 ×). Scale bar=25 µm. (E) Loss of STC2 does not impair the tumorigenic ability of CNE2 cells. CNE2 and CNE2-STC2-KO cells were digested with trypsin to prepare single cell suspension in serum-free medium. For each cell line, cells were subcutaneously injected into three nude mice (1×10⁶ cells each). The mice were housed up to 8 weeks after injection. All mice injected with CNE2 or CNE2-STC2-KO lines formed tumor xenografts, which were confirmed by pathologists. The STC2 expression status was confirmed by immunohistochemical staining. Images were taken under light microscope (400 ×). Scale bar =50 µm.
Abbreviations: N, normal culture condition as control; H, hypoxia (1% Oxygen); #A, CNE2-STC2-KOA; #B, CNE2-STC2-KOB.
Loss of STC2 enhances cell death post-radiation
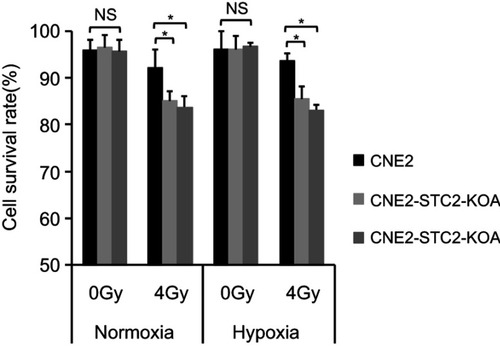
To determine the importance of STC2 in cancer cell survival post-radiation, we cultured CNE2 and the two STC2-KO lines in either normoxic or hypoxic condition. Without radiation, CNE2-STC2-KOA and CNE2-STC2-KOB maintain survival rates <95%, which shows no significant difference from CNE2 (P>0.05) under either normoxic or hypoxic condition. Under normoxic conditions, radiation treatment reduced the survival rate of CNE2 cells to 92.24±3.76% () whereas the CNE2-STC2-KOA and CNE2-STC2-KOB lines resulted in a significant decrease in survival rates (85.07±1.93%, P<0.05 and 83.75±2.25%, P<0.05, respectively). Importantly, irradiated CNE2 cultured under hypoxic conditions maintained a survival rate of 93.56±1.54%, while hypoxic CNE2-STC2-KOA, CNE2-STC2-KOB resulted in significantly reduced survival rates after X-irradiation (85.53±2.53%, P<0.05 and 83.10±1.1%, P<0.05, respectively). These data indicate that loss of STC2 undermines post-radiation survival of CNE2 cells.
Figure 3 Loss of STC2 enhances radiation-triggered death of NPC cells.
Notes: CNE-2, CNE2-STC2-KOA and CNE2-STC2-KOB cells were cultured under normoxic (21% O2) or hypoxic (1% O2) condition to reach 80% confluence and irradiated with 4 Gy X-radiation. Six hours later, cells were digested with 0.25% trypsin and cell survival was determined by Trypan blue staining. Living or dead cells were counted under a light microscope. Cell survival rates were calculated as: (Number of living cells/Total cell numbers)×100%. *P<0.05.
Abbreviation: NS, not significant.
Loss of STC2 impairs post-radiation clonogenic ability of CNE2 cells
Radiation-resistant CNE2 cells have strong post-radiation clonogenic ability. To further substantiate the importance of STC2 in CNE2 radiation resistance, we performed clonogenic assays under both normoxic and hypoxic conditions ( and ). The dose-survival curves were obtained under both normal and hypoxic conditions ( and ). From these curves, we observed that after exposure to the same doses of X-radiation, CNE2-STC2-KOA and CNE2-STC2-KOB cells manifested SFs much lower than CNE2 cells (P<0.05, 21% O2 or 1% O2).
Figure 4 Loss of STC2 reduces clonogenic ability of CNE2 post-radiation.
Notes: Radiation sensitivity was determined by standard clonogenic assays. CNE2-STC2-KOA, CNE2-STC2-KOB and control CNE2 cells were plated in 6-well plates, and cultured under normoxic (A,B) and hypoxic (C,D) conditions to achieve 80% confluency. Then, cells were irradiated with indicated doses and returned to original culture conditions with the change of culture media every 7 days. After 14 days, colonies were stained with crystal violet and counted to calculate the survival fractions. Cell survival curves were fitted based on standard multitarget-single hit model [SF=1–(1–e−D/D0)N], and D0, Dq, N, SF2 and SER values are listed in .
![Figure 4 Loss of STC2 reduces clonogenic ability of CNE2 post-radiation.Notes: Radiation sensitivity was determined by standard clonogenic assays. CNE2-STC2-KOA, CNE2-STC2-KOB and control CNE2 cells were plated in 6-well plates, and cultured under normoxic (A,B) and hypoxic (C,D) conditions to achieve 80% confluency. Then, cells were irradiated with indicated doses and returned to original culture conditions with the change of culture media every 7 days. After 14 days, colonies were stained with crystal violet and counted to calculate the survival fractions. Cell survival curves were fitted based on standard multitarget-single hit model [SF=1–(1–e−D/D0)N], and D0, Dq, N, SF2 and SER values are listed in Table 1.](/cms/asset/00126cc5-6162-430c-8b13-1e9fc2601a95/dcmr_a_12186347_f0004_c.jpg)
Using the multitarget, single-hit model, we analyzed and summarized the data in . Compared with CNE2, CNE2-STC2-KOA and CNE2-STC2-KOB gave SERD0 values of 1.10 and 1.11 under normoxic condition (P<0.05); which increased to 1.33 and 1.42 under 1% O2 conditions (P<0.05). In addition, under both normoxic and hypoxic conditions, the D0, Dq values of CNE2-STC2-KOA and CNE2-STC2-KOB were significantly lower than that of CNE2 cells (P<0.05).
Table 1 Loss of STC2 sensitizes CNE2 cells
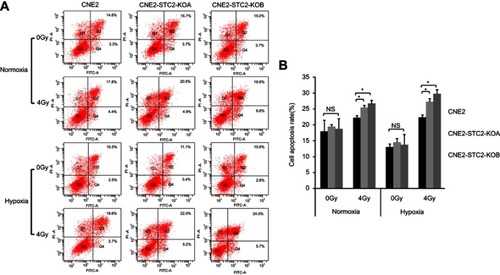
Finally, potential role of STC2 in protecting NPC cells from radiation-caused apoptosis was analyzed. Six hours after exposure to 4 Gy X-radiation, cells were stained and analyzed for apoptosis () and the results are summarized in . Loss of STC2 in CNE2-STC2-KOA and CNE2-STC2-KOB cells resulted in higher rates of apoptosis than CNE2 after radiation exposure (P<0.05 for normoxia; P<0.05 for 1%O2). Taken together, these data indicate that loss of STC2 significantly increases the radiation-caused apoptosis of CNE2 cells, particularly under hypoxic conditions.
Figure 5 Loss of STC2 Enhances Radiation-Triggered Apoptosis.
Notes: (A) CNE2, CNE2-STC2-KOA and CNE2-STC2-KOB cells were cultured under either normoxic or hypoxic conditions to 80% confluence and exposed to 4 Gy of X-radiation. Six hours after radiation, apoptosis was determined by Annexin V and PI staining followed by flow cytometric analyses. The percentage of apoptotic cells was shown as the means±SD from three biological replicates. (B) Histograms show the total apoptotic rates (late+early phases). Error bars are mean± SD (n=3). *P<0.05.
Abbreviation: NS, not significant.
Loss of STC2 increase cells at G1 and G2/M phases post-radiation
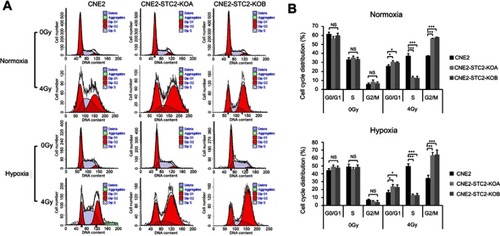
Radiation causes DNA damage that in turn usually triggers a G2/M arrest mediated by ATR/ATM-p53 pathways.Citation22–Citation24 Therefore, we next assessed the effects of STC2 loss on the cell cycle progression post-radiation (). We found that without radiation exposure, CNE2, CNE2-STC2-KOA and CNE2 STC2-KOB have a similar percentage of cells in G2/M phases. When analyzed 6-hr post-radiation, CNE2-STC2-KOA and CNE2-STC2-KOB cells showed a significantly increased percentage of cells in G1 and G2/M phases (P<0.05 for G1; P<0.001 for G2/M, and ), but a decrease in S-phase compared with control cells (P<0.001, and ). Similar results were observed when CNE2 cells were comparably studied with the STC2-KO lines under hypoxic conditions (P<0.05 for G1; P<0.001 for G2/M and S, and ). These data strongly indicate that loss of STC2 strengthens DNA damage-triggered cell cycle arrest at both G1 and G2/M phases, further supporting that loss of STC2 function enhances CNE2 sensitivity to radiation.
Figure 6 Loss of STC2 promotes radiation-triggered cell cycle alteration.
Notes: (A) Cells were cultured under either normoxic or hypoxic conditions to 80% confluence. Then, cells were exposed to 4 Gy of X-radiation and cultured for another 6 hrs. The cells were trypsinized and cell cycle distribution was determined by PI staining and flow cytometric analysis of DNA contents. (B, C) Results from triplicate experiments as shown in panel A were quantified, and the percentages of cells in the G0/G1, S and G2/M phases were presented as means±SD. *P<0.05; **P<0.01; ***P<0.001.
Loss of STC2 undermines post-radiation migration and invasion of CNE2
Cancer cell migration and invasion play key roles in tumor metastasis. Post-radiation recurrence and metastasis are the major causes of therapeutic failure in NPC management. To investigate the effects of STC2 on post-radiation metastasis, we compared the post-radiation migration ability of CNE2 and CNE2-STC2-KO lines using the Transwell culture assays ( and ). We found that without radiation, CNE2, CNE2-STC2-KOA and CNE2-STC2-KOB had similar migration ability. Hypoxia alone did not alter the migration ability of CNE2 (P>0.05). We next exposed cells to 4 Gy X-radiation and continued the culture for another 6 hrs. Then, we prepared single cell suspensions and seeded about 2×10⁴ live cells in each Transwell to test the post-radiation migration abilities. We found that 4 Gy X-radiation only slightly impaired CNE2 migration ability, whereas it significantly suppressed the migration of both CNE2-STC2-KOA and CNE2-STC2-KOB cells under both normoxic and hypoxic conditions (P<0.01).
Figure 7 Loss of STC2 undermines migration and invasion of irradiated NPC cells.
Notes: (A) Transwell culture analyses were used to examine migrating ability. CNE2, CNE2-STC2-KOA and CNE2-STC2-KOB cells were seeded on the upper chambers of Transwell plates and cultured for 24 hrs before analysis. The insert membranes were removed, stained with crystal violet and examined under light microscope (200×) to determine migrated cells at the bottom of membranes. (B) Numbers of cells migrating through the insert membranes were counted and mean ±SD from three triplicates was plotted. **P<0.01. (C) Cell invasion was tested with a Matrigel-based in vitro assay. Representative images showing cells on the bottoms of the Millicell® Hanging cell culture inserts, which were cells invaded through the Matrigel gel and insert membrane. (D) The numbers of invaded cells were counted; and mean±SD from three triplicates was plotted. **P<0.01.
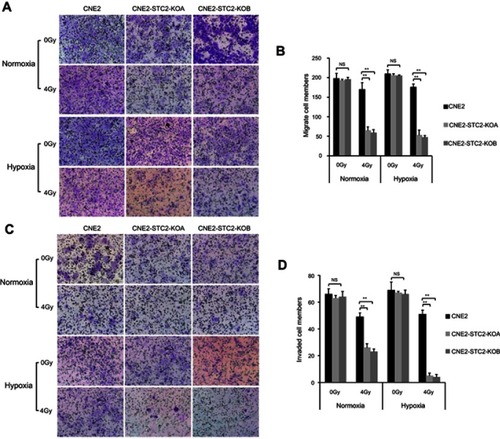
We next investigated the effects of STC2 knockout on post-radiation invasion ability of NPC cells using the standard Matrigel assays ( and ). When cells were studied without radiation, CNE2, CNE2-STC2-KOA and CNE2-STC2-KOB showed similar invasion ability under both normoxic and hypoxic conditions. When 2×10⁴ irradiated cells were tested under normoxic conditions, CNE2 cells resulted in 49±3 cells invaded through the Matrigel; whereas CNE2-STC2-KOA and CNE2-STC2-KOB resulted in significantly reduced invasion (26±3, P<0.01; and 23±2, P<0.01, respectively). Under hypoxic conditions, radiated CNE2 resulted in 51±3 cells invaded the Matrigel, whereas loss of STC2 dramatically reduced the post-radiation invading cells to 5±2 and 4±2, as shown in CNE2-STC2-KOA and CNE2-STC2-KOB, respectively (in both cases, P<0.01). Taken together, these data indicate that under normal culture conditions STC2 expression does not alter NPC migration or invasion significantly, whereas it plays a critical role in maintaining the migration and invasion ability of NPC cells exposed to radiation.
Discussion
In this study, we determined if STC2 expression is required for the development of radiation resistance and metastasis of NPC. Using CNE2-STC2-KO cell lines, we demonstrated that loss of STC2 increases radiation sensitivity of NPC cells under both normoxic and hypoxic conditions. Cell cycle analysis reveals that loss of STC2 significantly accumulates cells in G1 and G2/M phases, consistent with enhanced DNA damage and cytotoxicity post-radiation. These data strongly indicate that STC2 expression, which can be stimulated by metabolic stress commonly occurring in solid tumors, may contribute to maintaining the survival of NPC cells post-radiation. Importantly, we show that although loss of STC2 does not impair the tumorigenicity of CNE2 cells, it significantly decreases the invasion and migration ability post-radiation, suggesting STC2 expression may be a promoting factor for NPC metastasis in vivo.
STC2 expression has been reported to be upregulated under various stress conditions, including metabolic and therapeutic stresses. Molecular oxygen, glutamine and glucose represent three major nutrients for cells undergoing rapid proliferation in order to support active biosynthesis.Citation25–Citation27 A defective blood supply is a common feature of solid tumors, which leads to hypoxia, low glutamine and low glucose conditions in the tumor microenvironment, which may, in turn, upregulate STC2 expression.Citation28–Citation30 Hypoxia was previously reported to upregulate STC2,Citation8,Citation31,Citation32 we also found that STC2 was strongly upregulated by either glutamine or glucose starvation in hepatocellular carcinoma cells.Citation33 In this study, we confirmed that hypoxia and glucose starvation upregulate STC2 expression in NPC cells. In addition, STC2 has been reported to be upregulated under other stress conditions, including radiationCitation34 and ER stress.Citation35 Therefore, STC2 is likely a gene involved in common stress response, which in turn protects cells from apoptosis induced by stress conditions including radiation. Since it is upregulated by multiple stress conditions, nutrient-deprivation stimulated STC2 expression is likely a critical player in tumor cells’ resistance to chemotherapy and radiotherapy. Therefore, targeting STC2 in combination with other therapeutic regimens may have a potential application in the improvement of therapeutic efficiency.
In addition to promoting cell survival, STC2 overexpression has been associated with enhanced cell migration in other cell models. It has been proposed that STC2 facilitates tumor cell migration through epithelial-mesenchymal transition and the upregulation of MMP-2 and MMP-9 under hypoxic conditions.Citation8,Citation10 Consistent with these previous studies, we found that loss of STC2 impaired NPC cell invasion and migration post-radiation. Therefore, STC2-facilitated post-radiation invasion and migration of NPC cells may contribute to the high risk of NPC metastasis and poor overall survival rates, further supporting the notion that STC2 overexpression is a predictive marker for poor prognosis of NPC.
Cell cycle analysis reveals that loss of STC2 significantly accumulates radiated cells at G1 and G2/M phases. It is well known that DNA damage triggers G1 arrest and G2/M arrest to allow cells to repair damaged DNA and chromosomes, which involves complicated protein phosphorylation- mediated processes including ATM/ATR sensing and p53 activation.Citation22–Citation24 When severe DNA damage overwhelms the cells’ ability to repair, apoptosis will be triggered. It has been reported that DNA damage response plays a key role in radiation resistance of glioma stem cells.Citation36 Accordingly, DNA damage response has been considered an important barrier for anti-cancer therapies.Citation37 Our findings imply that STC2 expression may facilitate DNA repair processes, which may be an important component of the DNA damage response.
Mechanistically, STC1 identified from bony fish functions as a hormone, which regulates calcium and phosphate metabolism in response to variation of calcium concentrations in living water environment. In mammalian cells, STC2 can be either intracellular protein or secreted, and the intracellular portion of STC2 is mainly localized on the ER membrane. As such, STC2 has been proposed to regulate the function of STIM1, an ER calcium sensor which promotes extracellular Ca2+ entry upon ER Ca2+ storage decline.Citation5,Citation6 However, considering STC is conserved in many distant species, its role in cell physiology of mammals is apparently more complicated. In human cells, STC1 seems to act the conserved function to control the organismal level homeostasis of calcium and phosphate metabolism, whereas STC2 has been found to regulate cellular level calcium signaling pathways which in turn control a variety of physiological and pathological processes.Citation6 Calcium may serve as a signaling molecule for various extracellular stimuli and regulates a flock of cellular activities.Citation38,Citation39 Particularly, the role of STC2 in regulating cell proliferation and survival also has been studied with different cell lines. Collectively, it is likely that STC2 promotes cell survival through intracellular calcium-mediated pathways. Considering the role of STC2 in promoting cell survival and radiation resistance, it would be intriguing to further investigate how STC2 overexpression may affect the calcium signaling pathways, which may provide a mechanistic link between various stress conditions, including therapeutic stresses, to DNA repair, cell survival and migration.
Conclusion
In conclusion, our findings indicate that STC2 expression is critical to radiation resistance of CNE2. While loss of STC2 function does not impair the tumorigenicity of CNE2, stress-triggered STC2 expression is required to promote post-radiation survival, clonogenic ability, invasiveness and migration of CNE2 cells. Therefore, targeting STC2 function may provide a novel strategy to effectively overcome radiation resistance and prevent post-radiation metastasis of NPC. However, this remains a hypothesis to be validated by in vivo studies and corroborated by a thorough mechanistic understanding.
Author contributions
HH, QS and GQ conducted experiments, and wrote the manuscript. CS, ZC, LT, SY, ZJ, XH, DH, XY and CB provided technical support and carried out experiments. JP provided clinical consultation, and provided guidance in experimental design. SL and NS developed the hypothesis, designed research plans, performed data analysis, and participated in writing and editing the manuscript. All authors contributed to data analysis, drafting or revising the article, gave final approval of the version to be published, and agree to be accountable for all aspects of the work.
Disclosure
The authors report no conflicts of interest in this work.
Acknowledgments
We thank Mr Omar Hayatt for carefully proofreading the manuscript prior to submission. This study was supported by National Natural Science Foundation of China (Grant no.81470134), Science and Technology Project of Fujian Province (Grant no.2015Y0051), Natural Science Foundation of Fujian Province (Grant no.2019J01191), Medical Innovation Project of Fujian Province (Grant no.2015-CX-6), and National Institutes of Health USA: R01-CA129494. An abstract related to this report was presented at the 2018 “American Society for Radiation Oncology (ASTRO) annual meeting” as a poster presentation. The poster’s abstract was published in “Poster Abstracts” in “International Journal of Radiation Oncology Biology Physics”, titled “Stress-Induced Overexpression of Stanniocalcin 2 (STC2) Plays Key Role in Radiation Resistance and Metastasis of Nasopharyngeal Carcinomas”: Hyperlink with DOI: https://doi.org/10.1016/j.ijrobp.2018.07.1019.
References
- Ishibashi K, Miyamoto K, Taketani Y, et al. Molecular cloning of a second human stanniocalcin homologue (STC2). Biochem Biophys Res Commun. 1998;250(2):252–258. doi:10.1006/bbrc.1998.93009753616
- Chang AC-M, Janosi J, Hulsbeek M, et al. A novel human cDNA highly homologous to the fish hormone stanniocalcin. Mol Cell Endocrinol. 1995;112(2):241–247.7489828
- Olsen HS, Cepeda MA, Zhang -Q-Q, et al. Human stanniocalcin: a possible hormonal regulator of mineral metabolism. Proc Natl Acad Sci. 1996;93(5):1792–1796.8700837
- Madsen KL, Tavernini MM, Yachimec C, et al. Stanniocalcin: a novel protein regulating calcium and phosphate transport across mammalian intestine. Am J Physiol Gastrointest Liver Physiol. 1998;274(1):G96–G102. doi:10.1152/ajpgi.1998.274.1.G96
- Pacheco J, Vaca L. STIM-TRP Pathways and Microdomain Organization: auxiliary proteins of the STIM/Orai complex Adv Exp Med Biol. 2017:993:189–210.
- Zeiger W, Ito D, Swetlik C, et al. Stanniocalcin 2 is a negative modulator of store-operated calcium entry. Mol Cell Biol. 2011;31(18):3710–3722. doi:10.1128/MCB.05140-1121746875
- Lin S, Guo Q, Wen J, et al. Survival analyses correlate stanniocalcin 2 overexpression to poor prognosis of nasopharyngeal carcinomas. J Exp Clin Cancer Res. 2014;33(1):26. doi:10.1186/1756-9966-33-2624606961
- Law AY, Wong CK. Stanniocalcin-2 promotes epithelial-mesenchymal transition and invasiveness in hypoxic human ovarian cancer cells. Exp Cell Res. 2010;316(20):3425–3434. doi:10.1016/j.yexcr.2010.06.02620619259
- Esseghir S, Kennedy A, Seedhar P, et al. Identification of NTN4, TRA1, and STC2 as prognostic markers in breast cancer in a screen for signal sequence encoding proteins. Clin Cancer Res. 2007;13(11):3164–3173. doi:10.1158/1078-0432.CCR-07-022417545519
- Volland S, Kugler W, Schweigerer L, Wilting J, Becker J. Stanniocalcin 2 promotes invasion and is associated with metastatic stages in neuroblastoma. Int J Cancer. 2009;125(9):2049–2057. doi:10.1002/ijc.2456419582875
- Tamura K, Furihata M, Chung SY, et al. Stanniocalcin 2 overexpression in castration-resistant prostate cancer and aggressive prostate cancer. Cancer Sci. 2009;100(5):914–919. doi:10.1111/j.1349-7006.2009.01117.x19298603
- Kita Y, Mimori K, Iwatsuki M, et al. STC2: a predictive marker for lymph node metastasis in esophageal squamous-cell carcinoma. Ann Surg Oncol. 2011;18(1):261–272. doi:10.1245/s10434-010-1271-120734150
- Yokobori T, Mimori K, Ishii H, et al. Clinical significance of stanniocalcin 2 as a prognostic marker in gastric cancer. Ann Surg Oncol. 2010;17(10):2601–2607. doi:10.1245/s10434-010-1086-020422456
- Na SS, Aldonza MB, Sung H-J, et al. Stanniocalcin-2 (STC2): a potential lung cancer biomarker promotes lung cancer metastasis and progression. Biochim Biophys Acta Proteins Proteom. 2015;1854(6):668–676. doi:10.1016/j.bbapap.2014.11.002
- Ieta K, Tanaka F, Yokobori T, et al. Clinicopathological significance of stanniocalcin 2 gene expression in colorectal cancer. Int J Cancer. 2009;125(4):926–931. doi:10.1002/ijc.2445319415750
- Meyer HA, Tolle A, Jung M, et al. Identification of stanniocalcin 2 as prognostic marker in renal cell carcinoma. Eur Urol. 2009;55(3):669–678. doi:10.1016/j.eururo.2008.04.00118450365
- Bouras T, Southey MC, Chang AC, et al. Stanniocalcin 2 is an estrogen-responsive gene coexpressed with the estrogen receptor in human breast cancer. Cancer Res. 2002;62(5):1289–1295.11888893
- Joensuu K, Heikkila P, Andersson LC. Tumor dormancy: elevated expression of stanniocalcins in late relapsing breast cancer. Cancer Lett. 2008;265(1):76–83. doi:10.1016/j.canlet.2008.02.02218355956
- Choudhry H, Harris AL. Advances in hypoxia-inducible factor biology. Cell Metab. 2017;27(2):281–298. doi:10.1016/j.cmet.2017.10.00529129785
- Song H, Xu B, Yi J. Clinical significance of stanniocalcin-1 detected in peripheral blood and bone marrow of esophageal squamous cell carcinoma patients. J Exp Clin Cancer Res. 2012;31:35. doi:10.1186/1756-9966-31-9522537917
- Hu T, He N, Yang Y, et al. DEC2 expression is positively correlated with HIF-1 activation and the invasiveness of human osteosarcomas. J Exp Clin Cancer Res. 2015;34:22. doi:10.1186/s13046-015-0135-825884381
- MacLachlan TK, Sang N, Giordano A. Cyclins, cyclin-dependent kinases and cdk inhibitors: implications in cell cycle control and cancer. Crit Rev Eukaryot Gene Expr. 1995;5(2):127–156. doi:10.1615/CritRevEukarGeneExpr.v5.i2.208845581
- Bakkenist CJ, Kastan MB. DNA damage activates ATM through intermolecular autophosphorylation and dimer dissociation. Nature. 2003;421(6922):499–506. doi:10.1038/nature0136812556884
- Matsuoka S, Ballif BA, Smogorzewska A, et al. ATM and ATR substrate analysis reveals extensive protein networks responsive to DNA damage. Science. 2007;316(5828):1160–1166. doi:10.1126/science.114032117525332
- Liang D, Kong X, Sang N. Effects of histone deacetylase inhibitors on HIF-1. Cell Cycle. 2006;5(21):2430–2435. doi:10.4161/cc.5.21.340917102633
- Meng M, Chen S, Lao T, Liang D, Sang N. Nitrogen anabolism underlies the importance of glutaminolysis in proliferating cells. Cell Cycle. 2010;9(19):3921–3932. doi:10.4161/cc.9.19.1313920935507
- Yin C, Qie S, Sang N. Carbon source metabolism and its regulation in cancer cells. Crit Rev Eukaryot Gene Expr. 2012;22(1):17–35. doi:10.1615/CritRevEukarGeneExpr.v22.i1.2022339657
- Chen S, Yin C, Lao T, et al. AMPK-HDAC5 pathway facilitates nuclear accumulation of HIF-1α and functional activation of HIF-1 by deacetylating Hsp70 in the cytosol. Cell Cycle. 2015;14(15):2520–2536. doi:10.1080/15384101.2015.105542626061431
- Chen S, Sang N. Hypoxia-inducible factor-1: a critical player in the survival strategy of stressed cells. J Cell Biochem. 2016;117(2):267–278. doi:10.1002/jcb.2528326206147
- Yin C, He D, Chen S, Tan X, Sang N. Exogenous pyruvate facilitates cancer cell adaptation to hypoxia by serving as an oxygen surrogate. Oncotarget. 2016;7(30):47494. doi:10.18632/oncotarget.v7i3027374086
- Law AY, Lai KP, Ip CK, et al. Epigenetic and HIF-1 regulation of stanniocalcin-2 expression in human cancer cells. Exp Cell Res. 2008;314(8):1823–1830. doi:10.1016/j.yexcr.2008.03.00118394600
- Law AY, Wong CK. Stanniocalcin-2 is a HIF-1 target gene that promotes cell proliferation in hypoxia. Exp Cell Res. 2010;316(3):466–476. doi:10.1016/j.yexcr.2009.09.01819786016
- Qie S, Liang D, Yin C, et al. Glutamine depletion and glucose depletion trigger growth inhibition via distinctive gene expression reprogramming. Cell Cycle. 2012;11(19):3679–3690. doi:10.4161/cc.2194422935705
- Garnett CT, Palena C, Chakraborty M, et al. Sublethal irradiation of human tumor cells modulates phenotype resulting in enhanced killing by cytotoxic T lymphocytes. Cancer Res. 2004;64(21):7985–7994. doi:10.1158/0008-5472.CAN-04-152515520206
- Ito D, Walker JR, Thompson CS, et al. Characterization of stanniocalcin 2, a novel target of the mammalian unfolded protein response with cytoprotective properties. Mol Cell Biol. 2004;24(21):9456–9469. doi:10.1128/MCB.24.21.9456-9469.200415485913
- Bao S, Wu Q, McLendon RE, et al. Glioma stem cells promote radioresistance by preferential activation of the DNA damage response. Nature. 2006;444(7120):756–760. doi:10.1038/nature0523617051156
- Bartkova J, Hořejší Z, Koed K, et al. DNA damage response as a candidate anti-cancer barrier in early human tumorigenesis. Nature. 2005;434(7035):864–870. doi:10.1038/nature0348215829956
- Clapham DE. Calcium signaling. Cell. 2007;131(6):1047–1058. doi:10.1016/j.cell.2007.11.02818083096
- Willoughby D, Cooper DM. Organization and Ca2+ regulation of adenylyl cyclases in cAMP microdomains. Physiol Rev. 2007;87(3):965–1010. doi:10.1152/physrev.00049.200617615394