
Abstract
Purpose: We designed the study to illustrate the OR of programmed cell death-1 (PD-1) or ligand 1 (PD-L1) inhibitor-related diarrhea in patients with non-small cell lung cancer.
Method: This systematic review and meta-analysis were put into practice according to the Preferred Reporting Items for Systematic Reviews and Meta-analyses (PRISMA) guidelines. Incidence of all grades for PD-1/PD-L1 inhibitor-related diarrhea in NSCLC was taken into account.
Results: After screening and eligibility assessment of 57 articles, a total of 12 clinical trials involving 6,659 participants were collected for the final meta-analysis. The incidence risk of diarrhea for all grades was lower in PD-1 inhibitor monotherapy compared to monochemotherapy of docetaxel (OR=0.31, 95% CI [0.24, 0.41]; I2=0%, Z=8.23 (p<0.00001)), while a similar result could also be seen in PD-L1 inhibitor monotherapy group (OR=0.41, 95% CI [0.27, 0.64]; I2=59%, Z=3.92 [p<0.00001]). The opposite result can be seen when PD-1/PD-L1 inhibitor combined chemotherapy was compared to chemotherapy alone (OR=1.51, 95% CI [1.22, 1.87]; I2=0%, Z=3.77 [p<0.00001]). Similar incidence trend could also be seen in the meta-analysis of diarrhea for grade 1–2 and grade 3–5.
Conclusion: The incidence risk of diarrhea associated with PD-1/-PD-L1 inhibitor monotherapy was significantly lower than that of docetaxel monotherapy group. However it was higher in PD-1/PD-L1 inhibitor combined with chemotherapy group compared with the chemotherapy alone group.
Keywords:
Introduction
The programmed cell death 1 (PD-1) receptor has emerged as a dominant negative regulator of antitumor T-cell effector function when engaged by its ligand programmed cell death ligand 1 (PD-L1), expressed on the surface of cells within a tumor.Citation1 Therapies that target the PD-1 receptor have shown unprecedented rates of durable clinical responses in patients with various cancer types. One mechanism by which cancer tissues limit the host immune response is via playing a key role in the maintenance of immunological tolerance to self-antigens, preventing autoimmune disorders, while immune checkpoint inhibitors (ICIs), including CTLA-4 and PD-1, were able to unleash T cells to fight cancer.Citation2–Citation6 Nivolumab showed its antitumor efficacy in non-small cell lung cancer (NSCLC) when it was first administered to a patient in October 2006 in a Phase I trial.Citation7 With the development of clinical research, more and more PD-1/PD-L1 inhibitors have been tried in clinical trials for antilung cancer treatment and have shown good efficacy,Citation8–Citation10 especially for NSCLC.Citation11–Citation22
The toxic effects associated with PD-1/PD-L1 inhibitors may affect any organ and result from the activation of autoreactive T cells, thereby damaging the host tissue and even jeopardizing the patient’s life.Citation11–Citation23 Diarrhea is a common side effect of antitumor medications. Moderate or severe diarrhea can cause electrolyte imbalance in patients, further leading to the interruption of antitumor treatment.Citation11–Citation22 There was no significant difference in the incidence of diarrhea between PD-L1 inhibitors and placebo.Citation8 Compared with other antilung cancer treatment programs, there is no systematic analysis and report on the incidence risk of PD-1/PD-L1-related diarrhea. In order to clarify the incidence risk of diarrhea in the treatment of NSCLC with PD-1/PD-L1 inhibitors, we conducted a systematic review and meta-analysis.
Methods
This systematic review and meta-analysis was put into practice according to the Preferred Reporting Items for Systematic Reviews and Meta-analyses (PRISMA) guidelines.Citation24
Types of studies
We paid our attention mainly to randomized clinical trials, especially for Phase III clinical trials related to NSCLC. The criteria for the selected data: 1) PD-1/PD-L1-chemotherapy combinations compared with chemotherapy alone; 2) PD-1/PD-L1 monotherapy compared with chemotherapy alone; 3) PD-1/PD-L1 plus antitumor therapy compared with PD-1/PD-L1 inhibitor alone; 4) safety or toxicity was for evaluating OR with 95% CI or other evaluable indicators such as RR, HR and so on; and 5) subjects were diagnosed with NSCLC but SCLC. Some studies without useful information, such as observational studies, editorials, commentaries, and review articles, were excluded.
Outcome and exposure of interest
The outcome of interest was incidence rate of PD-1/PD-L1 inhibitor-related diarrhea, including any grade of diarrhea. Diarrhea-related death was considered to be secondary outcome. Study data that reported measures of colitis, including colitis-related diarrhea, was not taken into account. We sought to examine the difference of incidence risk between PD-1/PD-L1 group and control group.
Search strategy and review method
Original articles, related to results of prospective clinical trials of PD1/PD-L1 inhibitor regimens for NSCLC patients, including monotherapy and combination therapy, were verified by a Pubmed search. The date range was limited from January 22, 2013, to January 22, 2019. Keywords were displayed just as the following: “PD1/PD-L1”, “nivolumab”, “BMS-963558”, “pembrolizumab/MK-3475”, “atezolizumab/MPDL3280A”, “Avelumab”, “Durvalumab”, “lung cancer”, “NSCLC”, “SCLC”, “safety”, and “toxicity”.
We selected studies limited in human beings which were shown in full text, abstract, or poster form. Two members of our team were asked to identify their eligibility independently. References from review articles, editorials, and included studies were reviewed and cross-referenced to check completeness. If no useful data about toxicities of related drugs were found, we would try to get in touch with the corresponding author for more information, or it was precluded from the meta-analysis. The characteristics of enrolled studies, including first author, year of publication, drug name, treatment regimen, study design, phase, number of patients, number of PD-1/PD-L1-related diarrhea and baseline demographic characteristics, were extracted. Risk of bias was evaluated by the Cochrane Collaboration tool for assessing the risk of bias in randomized trials.Citation25
Assessment of heterogeneity and statistical analysis
We took Newcastle–Ottawa scale, proposed by the Cochrane Collaboration,Citation26 to check the quality of enrolled studies. Cochrane’s Q statistic and the I2 statistic were used for accessing the heterogeneity among studies just as proposed by Higgins et al,Citation27 while Harbord’s test was taken to check publication bias for all studies. OR value was considered to be a much more conservative and sensitive evaluation parameter and might be more inclined to reveal a safety signal, as the method by which an OR is calculated provided a point estimate farther from unity than that provided by an HR. OR, and 95% CI would be calculated by random effect (RE) for the heterogeneity inherent in the data..Citation28 p<0.05 was deemed to be statistically significant for all the results of meta-analysis. Statistical tests were all two-sided. Meta-analysis was performed using Review Manager, version 5.3.
Subgroup analysis
We divided all the data into three groups according to the degree of diarrhea, including all grades of diarrhea, grade 1–2, and grade 3–5. We performed a number of subgroup analyses to assess the potential association between PD-1/PD-L1 inhibitor and chemotherapy in the incidence risk of diarrhea. We considered subgroups, including drug type (PD-1 or PD-L1 inhibitor), combination with chemotherapy (combination with chemotherapy or mono-therapy), and drug name.
Results
Literature search results
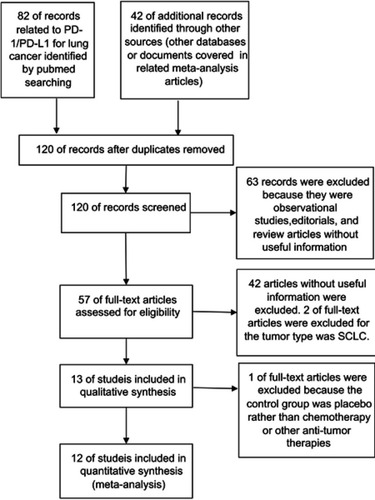
Among all the citations identified by our electronic and manual searches, 124 articles met the preliminary inclusion criteria. After screening and eligibility assessment of 57 articles, a total of 12 clinical trials involving 6,659 participants were collected for the final meta-analysis.Citation11–Citation22 The study flow diagram was shown in . All studies included a subgroup analysis that compared the intervention group with the control group, with an OR for incidence risk of diarrhea (–).
Figure 1 Study flow diagram of inclusion.
Abbreviations: PD-1, programmed cell death 1; PD-L1, Programmed death-ligand 1; SCLC, small cell lung cancer; NSCLC, non-small cell lung cancer.
Characteristics of identified trials
The main characteristics of all enrolled 12 studies are summarized in (). In total, 6,659 patients were included, of which 1,537 (23.1%) experienced diarrhea. Study types included 9 Phase III studies;Citation11–Citation16,Citation18,Citation21,Citation22 1 Phase II/III;Citation20 and 2 Phase II;Citation17,Citation19 All included studies had a control chemotherapy group. 5 of enrolled NSCLC studies received previous therapy before PD-1/PD-L1 inhibitor.Citation11,Citation16,Citation17,Citation20–Citation22 The drug used in 4 studies was PD-L1 inhibitor,Citation11,Citation12,Citation16,Citation17 while the PD-1 inhibitor was used in the other 8 studies.Citation13–Citation15,Citation18–Citation22 11 studies had the results of diarrhea for grade 3–5.Citation11–Citation16,Citation18–Citation22 In 6 studies, the drug used in the control group was monotherapy with docetaxel.Citation11,Citation16,Citation17,Citation20–Citation22 In the other 6 trials, the control treatment regimen was combined chemotherapy.Citation12–Citation15,Citation18,Citation19
Table 1 Basic characteristics of enrolled studies
Risk of bias
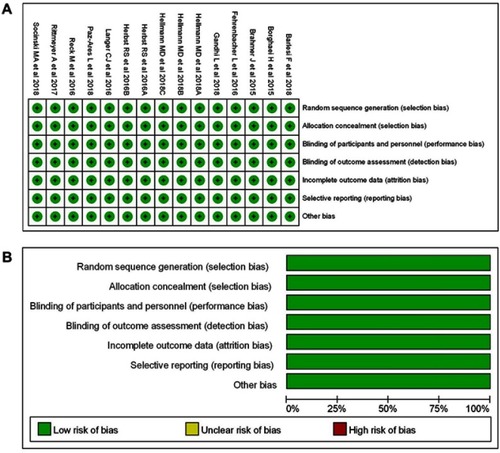
We used Newcastle–Ottawa scale to evaluate study quality and risk of bias in both comparison and noncomparison studies. All selected clinical studies were randomized and double-blinded. They were of high quality and at a low risk for selection bias. The risk of bias graph and summary are summarized in and . The risk for performance and detection bias was too low to affect the outcome. Harbord's test statistic did not suggest obvious publication bias in funnel plot (–).
Figure 2 (A): Risk of bias summary: review authors’ judgments about each risk of bias item for each included study. (B): Risk of bias graph: review authors’ judgments about each risk of bias item presented as percentages across all included studies.
OR of diarrhea for all grades and grade 1-2
The data of 12 studies involving NSCLC patients with PD-1/PD-L1 inhibitors data taken to make further analysis for diarrhea by grade.Citation11–Citation22 Diarrhea of all grades was taken to be evaluated first. All the enrolled studies were divided into 2 groups according to the treatment regimen. The treatment regimen of the experimental group was PD-1/PD-L1 inhibitor monotherapy, named group A,Citation11,Citation13,Citation16–Citation18,Citation20–Citation22 while the treatment regimen of the experimental group was PD-1/PD-L1 inhibitor combined with chemotherapy, named group B.Citation12,Citation14,Citation15,Citation19
The overall outcome of meta-analysis for group A is summarized at the bottom of () (OR=0.45, 95% CI [0.31, 0.66], I2=79%, Z=4.17 [p<0.00001]),Citation11,Citation13,Citation16–Citation18,Citation20–Citation22 while the opposite result of group B is displayed in (OR=1.51, 95% CI [1.22, 1.87], I2=0%, Z=3.77 [p=0.0002]).Citation12,Citation14,Citation15,Citation19 Funnel plot is provided in . The OR of PD-1 subgroup was a little higher (OR=0.48, 95% CI [0.27, 0.86]) than that of PD-L1 subgroup (OR=0.41, 95% CI [0.27, 0.64]) (). Due to the existence of heterogeneity, we conducted a further subgroup analysis (I2=79%), three different subgroup analysis methods were used for group A ().Citation11,Citation13,Citation16–Citation18,Citation20–Citation22
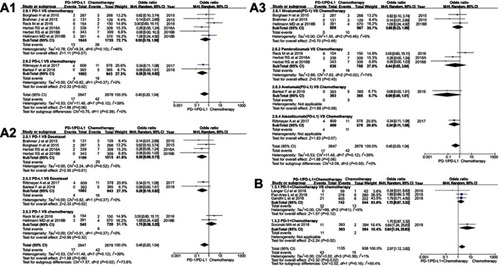
Figure 3 Forest plots of the incidence risk for all-grade diarrhea. (A1): OR of diarrhea for all grades in the subgroup analysis (PD-1/PD-L1 vs chemotherapy). (A2): OR of diarrhea for all grades in the subgroup analysis (PD-1/PD-L1 vs docetaxel/combined chemotherapy), the data included were assigned to the corresponding subgroup according to control group (docetaxel or combined chemotherapy). (A3): OR of diarrhea for all grades in the subgroup analysis (PD-1/PD-L1 vs chemotherapy), the data included were assigned to the corresponding subgroup according to the name of PD-1/PD-L1 inhibitor and the control group. (B): OR of diarrhea for all grades in the subgroup analysis (PD-1/PD-L1 + chemotherapy vs chemotherapy).
Abbreviation: RE, random effect; PD-1, programmed cell death 1; PD-L1, programmed cell death ligand 1;.
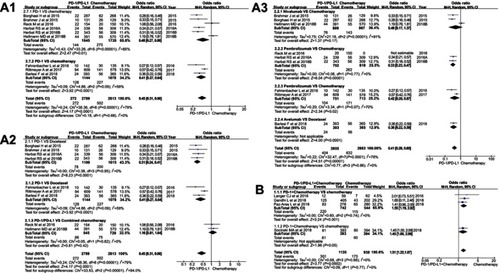
Regardless of whether the experimental group was single-agent PD-1 or PD-L1 inhibitor, the incidence risk of subgroup meta-analysis for diarrhea was significantly lower than that of the control group related to docetaxel (OR=0.31, 95% CI [0.24, 0.41], I2=0%; OR=0.41, 95% CI [0.27, 0.64], I2=59%; ). The results of the two subgroup meta-analysis were statistically significant. Heterogeneity was only found in the subgroup of PD-L1 inhibitor (I2=59%, ).Citation11,Citation16,Citation17 However, the similar trend could not be seen when PD-1/PD-L1 inhibitor was compared with combination chemotherapy (OR=1.16, 95% CI [0.81, 1.64], I2=0%; ).Citation13,Citation18
When another subgroup analysis was performed based on the specific drug name of the PD-1/PD-L1 inhibitor, compared with the control group, it was found that except for nivolumab, the incidence of diarrhea in the PD-1/PD-L1 group was lower than that of the control group, and the results were statistically significant (). In the subgroup of nivolumab (I2=91%) and atezolizumab (I2=70%), there was significant heterogeneity in the analysis results () .
After subgroup analysis of group B data, we found that PD-1 inhibitor combined with chemotherapy significantly increased the incidence risk of diarrhea, and the results were statistically significant (OR=1.55, 95% CI [1.19, 2.02], I2=0%, Z=3.24 [p=0.001]; ).Citation14,Citation15,Citation19
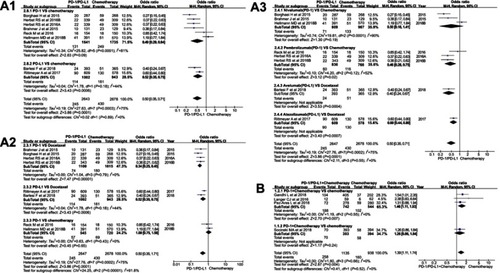
Then, the incidence rates of grade 1–2 diarrhea were taken into account. The incidence risk of diarrhea for all grades () and grade 1–2 () were almost in the same trend. The details of the meta-analysis for grade 1–2 related to group A are summarized in () (OR=0.50, 95% CI [0.35, 0.71], I2=75%; Z=3.86 [p=0.0001]), while the opposite result of group B is displayed in (OR=1.39, 95% CI [1.11, 1.74], I2=0%, Z=2.87 [p=0.004]). The OR of PD-1 subgroup was a little lower (OR=0.49, 95% CI [0.29, 0.84]) than that of PD-L1 subgroup (OR=0.52, 95% CI [0.35, 0.75]) in (). Regardless of whether the experimental group was single-agent PD-1 or PD-L1 inhibitor, the incidence risk of subgroup meta-analysis for diarrhea related to grade 1–2 was significantly lower than that of the control group related to docetaxel (OR=0.34, 95% CI [0.25, 0.45], I2=0%; OR=0.52, 95% CI [0.35, 0.75], I2=44%; ). When the subgroup analysis was performed based on the specific drug name of the PD-1/PD-L1 inhibitor, compared with the control group, it was found that except for nivolumab, the incidence rate of diarrhea in the PD-1/PD-L1 group was lower than that of the control group, and the results were statistically significant (). Funnel plot is provided in .
Figure 4 Forest plots of the incidence risk for grade 1–2 diarrhea. (A1): OR of diarrhea for grade 1–2 in the subgroup analysis (PD-1/PD-L1 vs chemotherapy) (A2): OR of diarrhea for grade 1–2 in the subgroup analysis (PD-1/PD-L1 vs docetaxel/combined chemotherapy), the data included were assigned to the corresponding subgroup according to control group (docetaxel or combined chemotherapy). (A3): OR of diarrhea for grade 1–2 in the subgroup analysis (PD-1/PD-L1 vs chemotherapy), the data included were assigned to the corresponding subgroup according to the name of PD-1/PD-L1 inhibitor and the control group. (B): OR of diarrhea for grade 1–2 in the subgroup analysis (PD-1/PD-L1 + chemotherapy VS chemotherapy).
Abbreviation: PD-1, programmed cell death 1; PD-L1, programmed cell death ligand 1; RE, random effect.
OR of diarrhea for grade 3-5
The incidence of diarrhea related to grade 3–5 was reported in 11 studies.Citation11–Citation16,Citation18–Citation22 The results of the meta-analysis were gathered at the bottom of . Different from the above results of all grades and grade 1–2, no statistical significance could be found when we put group A (PD-1/PD-L1 VS chemotherapy) into meta-analysis for the incidence risk of diarrhea (OR=0.45, 95% CI[0.20, 1.04], I2=39%, Z=1.88 [p=0.06]; ).Citation11,Citation13,Citation16,Citation18,Citation20–Citation22 The incidence risk of diarrhea in the PD-1/PD-L1 combined chemotherapy group was higher than that in the control group, and the results were statistically significant (OR=2.07, 95% CI [1.12, 3.82], I2=1%, Z=2.32 [p=0.02]; ).Citation12,Citation14,Citation15,Citation19 Funnel plot is provided in .
Figure 5 Forest plots of the incidence risk for grade 3–5 diarrhea. (A1): OR of diarrhea for grade 3–5 in the subgroup analysis (PD-1/PD-L1 vs chemotherapy) (A2): OR of diarrhea for grade 3–5 in the subgroup analysis (PD-1/PD-L1 vs docetaxel/combined chemotherapy), the data included were assigned to the corresponding subgroup according to control group (docetaxel or combined chemotherapy). (A3): OR of diarrhea for grade 3–5 in the subgroup analysis (PD-1/PD-L1 vs chemotherapy), the data included were assigned to the corresponding subgroup according to the name of PD-1/PD-L1 inhibitor and the control group. (B): OR of diarrhea for grade 3–5 in the subgroup analysis (PD-1/PD-L1 + chemotherapy vs chemotherapy).
Abbreviation: PD-1, programmed cell death 1; PD-L1, programmed cell death ligand 1; RE, random effect.
As the existence of heterogeneity (I2=39%) in group A, stratified subgroup analysis was taken into account ().Citation11,Citation13,Citation16,Citation18,Citation20–Citation22 When the PD-1 inhibitor was compared with docetaxel (), the incidence of diarrhea for grade 3–5 was significantly lower than that of the control group (OR=0.26, 95% CI [0.09, 0.73], I2=0%, Z=2.55 [p=0.01]).Citation20–Citation22 The same trend of results can also be seen when the PD-L1 inhibitor was compared to docetaxel (OR=0.28, 95% CI [0.10, 0.82], I2=0%, Z=2.33 [p=0.02]; ).Citation11,Citation16 When we mixed the single-agent docetaxel and the combination chemotherapy together as a control group, we did not find statistically significant results in the subgroup analysis (PD-1 vs chemotherapy) (OR=0.55, 95% CI [0.19, 1.59], I2=46%, Z=1.11 [p=0.27]; ).Citation13,Citation18,Citation20–Citation22 Moreover, moderate heterogeneity results had emerged (I2=46%), so the heterogeneity was considered to be derived from the two newly included data.Citation13,Citation18 When we performed a subgroup analysis based on the specific drug name of PD-1/PD-L1 inhibitor, no statistically significant analysis results could be found ().
Discussion
Therapies that target the PD-1 receptor have shown unprecedented rates of durable clinical responses in patients with various cancer types. It was reported that PD-1 or PD-L1 inhibitor improved overall survival compared with standard-of-care chemotherapy in patients with metastatic NSCLC, and several of them have received regulatory approvals.Citation29–Citation31 With the development of clinical research, more and more PD-1/PD-L1 inhibitors have been tried in clinical trials for antilung cancer treatment and have shown good efficacy,Citation8–Citation10 especially for NSCLC.Citation11–Citation22 Similar to other antitumor drugs, good antitumor efficacy was along with many therapeutic side effects, especially for combination with chemotherapy.
Diarrhea is a common side effect of antitumor medications, such as docetaxel, irinotecan, and topotecan. Moderate or severe diarrhea can cause electrolyte imbalance in patients, further leading to the interruption of antitumor treatment.Citation11–Citation22 Docetaxel was used to be taken as a better choice for second-line treatment for advanced NSCLC based on improvement in survival versus best supportive care.Citation32,Citation33 Other treatment regimens, such as pemetrexed and erlotinib, did not show better efficacy than docetaxel in patients with NSCLC.Citation34,Citation35 In order to clarify the incidence of diarrhea in the treatment of NSCLC with PD-1/PD-L1 inhibitors, we conducted a systematic review and meta-analysis.
Through our meta-analysis of the included clinical trials, the incidence of diarrhea for all grades was significantly lower in the PD-1/PD-L1 inhibitor monotherapy group than in the chemotherapy group, while it was higher in PD-1/PD-L1 combined with chemotherapy compared with chemotherapy group alone ().Citation11–Citation22 Similar incidence trend could also be seen in meta-analysis of diarrhea for grade 1–2 ().Citation11–Citation16,Citation18–Citation22 Due to the existence of heterogeneity, we conducted a further subgroup analysis (I2=79%), three different subgroup analysis methods were used for group A ().Citation11,Citation13,Citation16–Citation18,Citation20–Citation22 When we mixed the single-agent docetaxel and the combination chemotherapy together as a control group (, and ),Citation11,Citation13,Citation16–Citation18,Citation20–Citation22 heterogeneity results emerged. So the heterogeneity was considered to be derived from the two newly included data (Reck et al, 2016 and Hellmann et al, 2018B).Citation13,Citation18
In order to eliminate the influence of heterogeneity on the analysis results, we conducted a comprehensive analysis of the results. Regardless of the degree of diarrhea (all grade, grade 1–2 and grade 3–5), the incidence risk of diarrhea in PD-1 monotherapy group was significantly lower than that of docetaxel monotherapy group, and the difference was of statistical significance. There is no obvious heterogeneity and publication bias among the included data (, and , –).Citation20–Citation22 When PD-1/PD-L1 inhibitor was combined with chemotherapy, the incidence risk of diarrhea was significantly increased.Citation12,Citation14,Citation15,Citation19
Although diarrhea was reported in 20% of the patients, some of grade 3–5 treatment-related diarrhea was reported.Citation8–Citation22,Citation36–Citation39 They could be managed with treatment of the symptoms, and the patient recovered promptly without glucocorticoid treatment.Citation36–Citation39 Although diarrhea was reported as a common toxic side effect associated with PD-1/PD-L1 inhibitor appeared in clinical trials, no standard systematic treatment regimen for it was proposed.Citation8–Citation22,Citation36–Citation39 Therefore, for the fully understanding of PD-1/PD-L1-related diarrhea, more clinical trials and mechanism research are needed.
In a word, the incidence risk of diarrhea associated with single-agent PD-1/-PD-L1 inhibitors was significantly lower than that of the single-agent docetaxel group, while it was higher in PD-1/PD-L1 combined with chemotherapy group compared with chemotherapy group alone.
Conclusions
The incidence risk of diarrhea associated with single-agent PD-1/-PD-L1 inhibitors was significantly lower than that of docetaxel monotherapy group, while it was higher in PD-1/PD-L1 inhibitor combined with chemotherapy group compared with chemotherapy group.
Statement of Ethics
This study belongs to the type of data analysis and rearrangement and does not involve human- or animal-related ethical issues.
Abbreviation list
PRISMA, Preferred Reporting Items for Systematic Reviews and Meta-Analyses; PD-1, programmed cell death-1; PD-L1, programmed cell death ligand 1; SCLC, small cell cancer; NSCLC, non-small cell lung cancer; RR, risk ratio; RE, random effect; FE, fixed effect.
Author contributions
All authors contributed to data analysis, drafting and revising the article, gave final approval of the version to be published, and agree to be accountable for all aspects of the work.
Disclosure
The authors have no conflicts of interest to report in relation to this paper.
Acknowledgments
This study was funded by the Natural Science Foundation of Shandong Province (ZR2015HL078), which were in charge by Yuan Tian.
Supplementary materials
Figure S1 Funnel plots of the incidence risk for all-grade diarrhea. (A1): Funnel plots of diarrhea for all grades in the subgroup analysis (PD-1/PD-L1 vs chemotherapy). (A2): Funnel plots of diarrhea for all grades in the subgroup analysis (PD-1/PD-L1 vs docetaxel/combined chemotherapy), the data included were assigned to the corresponding subgroup according to control group (docetaxel or combined chemotherapy). (A3): Funnel plots of diarrhea for all grades in the subgroup analysis (PD-1/PD-L1 vs chemotherapy), the data included were assigned to the corresponding subgroup according to the name of PD-1/PD-L1 inhibitor and the control group. (B): Funnel plots of diarrhea for all grades in the subgroup analysis (PD-1/PD-L1 + chemotherapy vs chemotherapy).
Abbreviation: PD-1, programmed cell death 1; PD-L1, programmed cell death ligand 1; OR, odds ratio; RR, risk ratio.
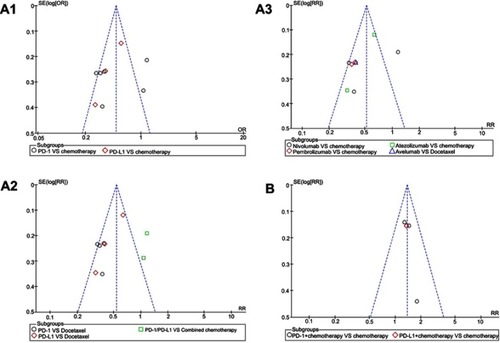
Figure S2 Funnel plots of the incidence risk for grade 1–2 diarrhea. (A1): Funnel plots of diarrhea for grade 1–2 in the subgroup analysis (PD-1/PD-L1 vs chemotherapy). (A2): Funnel plots of diarrhea for grade 1–2 in the subgroup analysis (PD-1/PD-L1 vs docetaxel/combined chemotherapy), the data included were assigned to the corresponding subgroup according to control group (docetaxel or combined chemotherapy).(A3): Funnel plots of diarrhea for grade 1–2 in the subgroup analysis (PD-1/PD-L1 vs chemotherapy), the data included were assigned to the corresponding subgroup according to the name of PD-1/PD-L1 inhibitor and the control group. (B): Funnel plots of diarrhea for grade 1–2 in the subgroup analysis (PD-1/PD-L1 + chemotherapy vs chemotherapy).
Abbreviation: PD-1, programmed cell death 1; PD-L1, programmed cell death ligand 1; OR, odds ratio; RR, risk ratio.
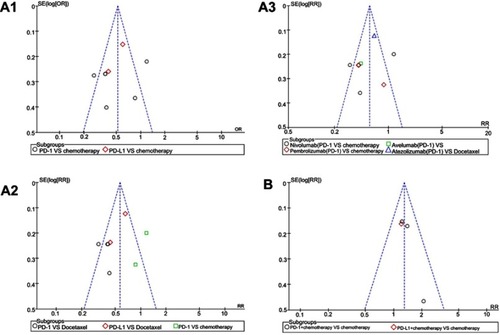
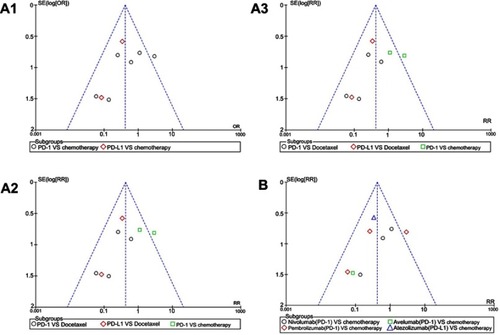
Figure S3 Funnel plots of the incidence risk for grade 3–5 diarrhea. (A1): Funnel plots of diarrhea for grade 3–5 in the subgroup analysis (PD-1/PD-L1 vs chemotherapy). (A2): Funnel plots of diarrhea for grade 3–5 in the subgroup analysis (PD-1/PD-L1 vs docetaxel/combined chemotherapy), the data included were assigned to the corresponding subgroup according to control group (docetaxel or combined chemotherapy). (A3): Funnel plots of diarrhea for grade 3–5 in the subgroup analysis (PD-1/PD-L1 VS chemotherapy), the data included were assigned to the corresponding subgroup according to the name of PD-1/PD-L1 inhibitor and the control group. (B): Funnel plots of diarrhea for grade 3–5 in the subgroup analysis (PD-1/PD-L1 + chemotherapy vs chemotherapy).
Abbreviation: PD-1, programmed cell death 1; PD-L1, programmed cell death ligand 1; OR, odds ratio; RR, risk ratio.
References
- Ribas A, Wolchok JD. Cancer immunotherapy using checkpoint blockade. Science. 2018;359(6382):1350–1355. doi:10.1126/science.aar406029567705
- Tumeh PC, Harview CL, Yearley JH, et al. PD-1 blockade induces responses by inhibiting adaptive immune resistance. Nature. 2014;515(7528):568–571. doi:10.1038/nature1395425428505
- Waterhouse P, Penninger JM, Timms E, et al. Lymphoproliferative disorders with early lethality in mice deficient in Ctla-4. Science. 1995;270(5238):985–988.7481803
- Tivol EA, Borriello F, Schweitzer AN, Lynch WP, Bluestone JA, Sharpe AH. Loss of CTLA-4 leads to massive lymphoproliferation and fatal multiorgan tissue destruction, revealing a critical negative regulatory role of CTLA-4. Immunity. 1995;3(5):541–547.7584144
- Nishimura H, Nose M, Hiai H, Minato N, Honjo T. Development of lupus-like autoimmune diseases by disruption of the PD-1 gene encoding an ITIM motif-carrying immunoreceptor. Immunity. 1999;11(2):141–151.10485649
- Nishimura H, Okazaki T, Tanaka Y, et al. Autoimmune dilated cardiomyopathy in PD-1 receptor-deficient mice. Science. 2001;291(5502):319–322. doi:10.1126/science.291.5502.31911209085
- Brahmer JR, Drake CG, Wollner I, et al. Phase I study of single-agent anti-programmed death-1 (MDX-1106) in refractory solid tumors: safety, clinical activity, pharmacodynamics, and immunologic correlates. J Clin Oncol. 2010;28(19):3167–3175. doi:10.1200/JCO.2009.26.760920516446
- Antonia SJ, Villegas A, Daniel D, et al. PACIFIC investigators. Overall survival with durvalumab after chemoradiotherapy in stage III NSCLC. N Engl J Med. 2018;379(24):2342–2350. doi:10.1056/NEJMoa180969730280658
- Horn L, Mansfield AS, Szczęsna A, et al. IMpower133 study group. First-line atezolizumab plus chemotherapy in extensive-stage small-cell lung cancer. N Engl J Med. 2018;379(23):2220–2229. doi:10.1056/NEJMoa180906430280641
- Kowanetz M, Zou W, Gettinger SN, et al. Differential regulation of PD-L1 expression by immune and tumor cells in NSCLC and the response to treatment with atezolizumab (anti-PD-L1). Proc Natl Acad Sci USA. 2018;115(43):E10119–E10126. doi:10.1073/pnas.180216611530297397
- Barlesi F, Vansteenkiste J, Spigel D, et al. Avelumab versus docetaxel in patients with platinum-treated advanced non-small-cell lung cancer (JAVELIN Lung 200): an open-label, randomised, phase 3 study. Lancet Oncol. 2018;19(11):1468–1479. doi:10.1016/S1470-2045(18)30673-930262187
- Socinski MA, Jotte RM, Cappuzzo F, et al. IMpower150 study group. atezolizumab for first-line treatment of metastatic nonsquamous NSCLC. N Engl J Med. 2018;378(24):2288–2301. doi:10.1056/NEJMoa171694829863955
- Hellmann MD, Ciuleanu TE, Pluzanski A, et al. Nivolumab plus ipilimumab in lung cancer with a high tumor mutational burden. N Engl J Med. 2018;378(22):2093–2104. doi:10.1056/NEJMoa180194629658845
- Paz-Ares L, Luft A, Vicente D, et al. KEYNOTE-407 investigators. pembrolizumab plus chemotherapy for squamous non-small-cell lung cancer. N Engl J Med. 2018;379(21):2040–2051. doi:10.1056/NEJMoa181086530280635
- Gandhi L, Rodríguez-Abreu D, Gadgeel S, et al. KEYNOTE-189 investigators. Pembrolizumab plus chemotherapy in metastatic non-small-cell lung cancer. N Engl J Med. 2018;378(22):2078–2092. doi:10.1056/NEJMoa180100529658856
- Rittmeyer A, Barlesi F, Waterkamp D, et al. Atezolizumab versus docetaxel in patients with previously treated non-small-cell lung cancer (OAK): a phase 3, open-label, multicentre randomised controlled trial. Lancet. 2017;389(10066):255–265. doi:10.1016/S0140-6736(16)32517-X27979383
- Fehrenbacher L, Spira A, Ballinger M, et al. Atezolizumab versus docetaxel for patients with previously treated non-small-cell lung cancer (POPLAR): a multicentre, open-label, phase 2 randomised controlled trial. Lancet. 2016;387(10030):1837–1846. doi:10.1016/S0140-6736(16)00587-026970723
- Reck M, Rodríguez-Abreu D, Robinson AG, et al. KEYNOTE-024 investigators. pembrolizumab versus chemotherapy for PD-L1-positive non-small-cell lung cancer. N Engl J Med. 2016;375(19):1823–1833. Epub 2016 Oct 8. doi:10.1056/NEJMoa160677427718847
- Langer CJ, Gadgeel SM, Borghaei H, et al. KEYNOTE-021 investigators. Carboplatin and pemetrexed with or without pembrolizumab for advanced, non-squamous non-small-cell lung cancer: a randomised, phase 2 cohort of the open-label KEYNOTE-021 study. Lancet Oncol. 2016;17(11):1497–1508. doi:10.1016/S1470-2045(16)30498-327745820
- Herbst RS, Baas P, Kim DW, et al. Pembrolizumab versus docetaxel for previously treated, PD-L1-positive, advanced non-small-cell lung cancer (KEYNOTE-010): a randomised controlled trial. Lancet. 2016;387(10027):1540–1550. doi:10.1016/S0140-6736(15)01281-726712084
- Brahmer J, Reckamp KL, Baas P, et al. Nivolumab versus docetaxel in advanced squamous-cell non-small-cell lung cancer. N Engl J Med. 2015;373(2):123–135. doi:10.1056/NEJMoa150462726028407
- Borghaei H, Paz-Ares L, Horn L, et al. Nivolumab versus docetaxel in advanced nonsquamous non-small-cell lung cancer. N Engl J Med. 2015;373(17):1627–1639. doi:10.1056/NEJMoa150764326412456
- Wang DY, Salem JE, Cohen JV, et al. Fatal toxic effects associated with immune checkpoint inhibitors: a systematic review and meta-analysis. JAMA Oncol. 2018;4(12):1721–1728. doi:10.1001/jamaoncol.2018.392330242316
- Moher D, Liberati A, Tetzlaff J, Altman DG. PRISMA group preferred reporting items for systematic reviews and meta-analyses: the PRISMA statement. Ann Intern Med. 2009;151:264–69.W64. doi:10.7326/0003-4819-151-4-200908180-0013519622511
- Higgins JP, Altman DG, Gøtzsche PC, et al. Cochrane Statistical Methods Group. The Cochrane Collaboration’s tool for assessing risk of bias in randomised trials. BMJ. 2011;343:d5928.22008217
- Wells G, Shea B, O’Connell D, et al. The Newcastle–Ottawa Scale (NOS) for assessing the quality if nonrandomized studies in meta-analyses. 2009 http://www.ohri. ca/programs/clinical _epidemiology/oxford.aspaccesse 76, 2012 Doi:10.1094/PDIS-11-11-0999-PDN
- Higgins JP, Thompson SG, Deeks JJ, Altman DG. Measuring inconsistency in meta-analyses. BMJ. 2003;327:557–560. doi:10.1136/bmj.327.7420.89512958120
- DerSimonian R, Laird N. Meta-analysis in clinical trials. Control Clin Trials. 1986;7:177–188. doi:10.1016/0197-2456(86)90046-23802833
- Kazandjian D, Suzman DL, Blumenthal G, et al. FDA approval summary: nivolumab for the treatment of metastatic non-small cell lung cancer with progression on or after platinum-based chemotherapy. Oncologist. 2016;21:634–642. doi:10.1634/theoncologist.2015-050726984449
- Sul J, Blumenthal GM, Jiang X, He K, Keegan P, Pazdur R. FDA approval summary: pembrolizumab for the treatment of patients with metastatic non-small cell lung cancer whose tumors express programmed death-ligand 1. Oncologist. 2016;21:643–650. doi:10.1634/theoncologist.2015-049827026676
- Weinstock C, Khozin S, Suzman D, et al. US food and drug administration approval summary: atezolizumab for metastatic non-small cell lung cancer. Clin Cancer Res. 2017;23:4534–4539. doi:10.1158/1078-0432.CCR-17-054028611199
- Fossella FV, DeVore R, Kerr RN, et al. Randomized phase III trial of docetaxel versus vinorelbine or ifosfamide in patients with advanced non-small-cell lung cancer previously treated with platinum-containing chemotherapy regimens. The TAX 320 non-small cell lung cancer study group. J Clin Oncol. 2000;18:2354–2362. doi:10.1200/JCO.2000.18.10.205910856094
- Shepherd FA, Dancey J, Ramlau R, et al. Prospective randomized trial of docetaxel versus best supportive care in patients with non-small-cell lung cancer previously treated with platinum-based chemotherapy. J Clin Oncol. 2000;18:2095–2103. doi:10.1200/JCO.2000.18.10.205910811675
- Hanna N, Shepherd FA, Fossella FV, et al. Randomized phase III trial of pemetrexed versus docetaxel in patients with non-small-cell lung cancer previously treated with chemotherapy. J Clin Oncol. 2004;22:1589–1597. doi:10.1200/JCO.2004.08.04015117980
- Garassino MC, Martelli O, Broggini M, et al. Erlotinib versus docetaxel as second-line treatment of patients with advanced non-small-cell lung cancer and wild-type EGFR tumours (TAILOR): a randomised controlled trial. Lancet Oncol. 2013;14:981–988. doi:10.1016/S1470-2045(13)70310-323883922
- Hamid O, Robert C, Daud A, et al. Safety and tumor responses with lambrolizumab (anti-PD-1) in melanoma. N Engl J Med. 2013;369(2):134–144. doi:10.1056/NEJMoa130513323724846
- Rizvi NA, Mazières J, Planchard D, et al. Activity and safety of nivolumab, an anti-PD-1 immune checkpoint inhibitor, for patients with advanced, refractory squamous non-small-cell lung cancer (CheckMate 063): a phase 2, single-arm trial. Lancet Oncol. 2015;16(3):257–265. doi:10.1016/S1470-2045(15)70054-925704439
- Hodi FS, Chesney J, Pavlick AC, et al. Combined nivolumab and ipilimumab versus ipilimumab alone in patients with advanced melanoma: 2-year overall survival outcomes in a multicentre, randomised, controlled, phase 2 trial. Lancet Oncol. 2016;17(11):1558–1568. doi:10.1016/S1470-2045(16)30366-727622997
- Migden MR, Rischin D, Schmults CD, et al. PD-1 blockade with cemiplimab in advanced cutaneous squamous-cell carcinoma. N Engl J Med. 2018;379(4):341–351. doi:10.1056/NEJMoa180513129863979