
 ?Mathematical formulae have been encoded as MathML and are displayed in this HTML version using MathJax in order to improve their display. Uncheck the box to turn MathJax off. This feature requires Javascript. Click on a formula to zoom.
Abstract
Purpose
Hepatocellular carcinoma (HCC) is the sixth most lethal neoplasm worldwide. Traditional biomarkers often exploit the relationship between a certain gene and cancer progression, but they cannot predict patient survival or prognosis accurately. We aim to construct a new DNA repair-related gene signature that combines several genes to improve prognosis prediction in HCC.
Methods
We selected an HCC mRNA sequencing (mRNA-seq) dataset (n=365) from The Cancer Genome Atlas (TCGA), and gene set enrichment analysis (GSEA) was used to explore bioinformatics information and further screen genes. We then built a gene signature based on the Cox proportional hazards regression model.
Results
GSEA revealed that the hallmark DNA repair gene set was significantly upregulated in the tumor phenotype. A set of seven genes, namely, ADA, FEN1, POLR2G, SAC3D1, SEC61A1, SF3A3, and UPF3B, were significantly a ssociated with overall survival (OS) and used to form a gene signature. The signature risk score was calculated and used to divide patients into high‐ and low‐risk groups. The high-risk group showed worse prognosis (log-rank test p<0.0001). Univariate and multivariate Cox regression analysis showed that the prognostic performance of this risk score signature was robust in different subgroups based on clinicopathological features, with p-values <0.05 (HR=2.38, 95% CI (confidence interval) =1.355–4.184), indicating that it can serve as an independent prognostic indicator.
Conclusion
We developed and identified a seven‐gene signature related to the DNA repair process that can predict survival in HCC. It can be used as an effective classification tool and to guide clinical treatment.
Introduction
Hepatocellular carcinoma (HCC), which accounts for approximately 75% of liver cancers, is the sixth most common cancer and the third most common cause of cancer-related death worldwide.Citation1,Citation2 Recently, epidemiological study has indicated that the worldwide incidence of HCC is highly heterogeneous due to variable risk factors, and that most HCC cases occur in South-eastern Asia and Saharan Africa,Citation3 where hepatitis B virus (HBV) infection is the main risk factor.Citation4 Diagnosis and treatment of HCC have greatly improved as medical technology rapidly develops, but prognosis remains very poor, with 5-year survival rates under 40%.Citation5 Although multiple prognostic biomarkers, including alpha‐fetoprotein (AFP),Citation6 glypican‐3,Citation7 des‐γ‐carboxyprothrombin,Citation8 and cytokeratin‐19,Citation9 are widely used in clinical practice, their effectiveness can be influenced by various factors and varies from person to person; thus, the biomarkers are unreliable in clinical implementations.Citation10,Citation11 Meanwhile, a large body of evidence has confirmed that molecular biomarkers play key roles in tumor diagnosis, prognosis assessments, and in identifying potentially high-risk patients. For example, CDX2 is under-expressed in patients with high-risk stage II colon cancer, suggesting its potential as an adjuvant to chemotherapy and a prognostic biomarker for stage II and III colon cancer.Citation12 Sulfite oxidase (SUOX) is a favorable diagnostic and prognostic biomarker of HCC and may forecast the performance and tumor recurrence risk when combined with serum AFP.Citation13 However, the predictive power of a single indicator is insufficient. Conversely, gene signatures making use of several genes provide better predictive performance,Citation14,Citation15 and multi-gene prognostic features can guide clinicians in selecting appropriate treatment. Identifying core genes and pathways in models can enhance clinical applications, identify new therapeutic targets, and provide new insights into cancer progression. Therefore, identifying effective and reliable biomarkers for prognostic prediction is urgently needed for HCC.Citation16,Citation17
In this study, gene set enrichment analysis (GSEA) was used to explore bioinformatics information and to screen several genes for further analysis. Previous differential analyses have often compared gene expression in two groups, specifically seeking genes that were significantly up‐ or down-regulated, and have not examined biological information and related gene regulatory networks.Citation18,Citation19 Meanwhile, GSEA does not require a differential gene threshold; it only examines whether genes in a set are randomly distributed or up- or down-regulated in some phenotypes relative to others, and identifies biological associations (related to functional information, processes, or disease states).
In the present study, we used mRNA expression data for enrichment analysis. GSEA showed that the hallmark DNA repair gene set was significantly up-regulated in the tumor phenotype, and we selected 103 enriched DNA repair genes to construct a seven‐gene signature that can predict the prognosis of HCC.
Materials and methods
Data collection and processing
Whole mRNA expression data and clinical information were obtained from the publicly available Cancer Genome Atlas database (https://cancergenome.nih.gov/). Patients meeting the following criteria were excluded: 1) patient had no follow‐up or survival status, 2) patient had clinical information but no mRNA expression data. Based on these requirements, 365 HCC samples and 50 adjacent noncancerous tissue samples were included in our study. Clinical information was extracted, including age, TNM classification, pathologic stage, histologic grade, history risk factor, and vascular invasion and neoplasm status, among others. The detailed clinical characteristics are summarized in .
Table 1 Clinical characteristics of patients with HCC in our study
Gene set enrichment analysis (GSEA)
Gene set enrichment analysis was used to determine whether the hallmark gene sets downloaded from the Molecular Signature database predicted significant differences between the HCC tumors and adjacent non-tumor tissue in the training set.Citation20 mRNA expression levels in the two groups were analyzed. Gene sets at nominal p<0.05 and false discovery rate (FDR) <0.25 were considered to be significantly enriched and to identify biological processes warranting further investigation.
Statistical analysis
mRNA expression profiles were extracted and log2-transformed. Univariate Cox regression analysis evaluated mRNAs significantly associated with overall survival (OS) with p-values <0.05. Further screening was then performed using multivariate Cox proportional hazards regression analysis, and seven mRNAs were ultimately included. Hazard ratios (HRs) were calculated for each gene. Afterwards, a prognostic risk score model was constructed based on a linear combination of expression levels weighted by regression coefficients obtained from the multivariate Cox regression analysis according to the following equation:
where β is the HR for each gene. Three hundred sixty-five patients were classified into high‐ and low‐risk groups using a median risk score. A Kaplan‐Meier curve was used to compare the prognoses of the two groups, and differences were assessed using the log‐rank test. Student’s t-test was used to examine the differential expression of included genes in HCC tumor and adjacent non-tumor tissues. The chi-squared test analyzed mortality in the two groups. A ROC curve was drawn to analyze the sensitivity and specificity in predicting patient overall survival, and the optimal diagnostic threshold was evaluated using Youden’s Index. The area under the curve of the ROC curve (AUC) was examined with the Z test. P<0.05 was considered statistically significant. Univariate and multivariate Cox regression analyses were performed to investigate the relationship between signature risk score and clinicopathological features. All statistical analyses were conducted using R 3.3.1 (www.r-project.org) and SPSS 19.0 (IMB, Armonk, NY, USA).
Results
Gene set enrichment analysis and gene screening
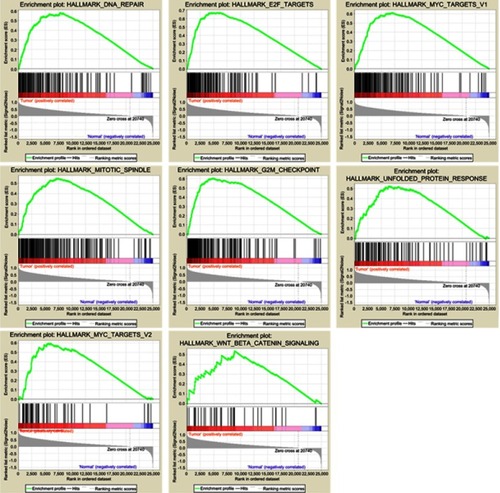
Clinical information and matched mRNA expression data from 365 patients with HCC were obtained from TCGA. The hallmark gene sets in the Molecular Signatures Database comprise 50 gene sets, each of which summarizes and clearly defines a biological state or process and displays coherent expression. GSEA was used to search for significant differences between tumor and normal tissue in these gene sets. The results showed that eight gene sets were significantly enriched, with p-values <0.05 and FDRs <0.25, including the DNA repair, G2/M checkpoint, E2F targets, MYC targets V2, Mitotic spindle, MYC targets V1, Unfolded protein response, and Wnt/β-catenin signaling sets (, ). We selected the lowest p-value DNA repair process, which contained 103 core enriched genes for further investigation.
Table 2 Gene sets enriched in the HCC tumor phenotype (365 samples)
Figure 1 Eight gene sets significantly enriched in the HCC tumor phenotype using GSEA. Including DNA repair, E2F targets, G2/M checkpoint, Mitotic spindle, MYC targets V1, MYC targets V2, Unfolded protein response, Wnt/β-catenin signaling.
Identification of DNA repair-related genes related to survival
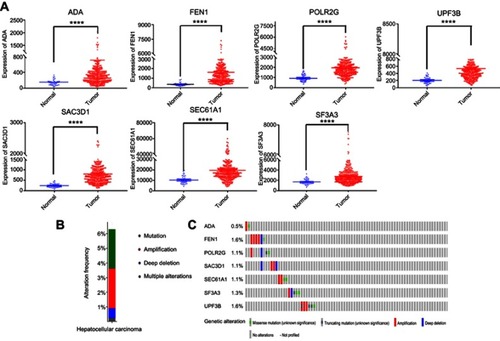
To identify genes associated with survival in HCC, univariate Cox regression analysis was applied. Twenty-six genes were significantly correlated with OS (P<0.00001), and multivariate Cox regression analysis was used to further pare down the panel. As a result, a total of seven genes, namely, ADA, FEN1, POLR2G, SAC3D1, UPF3B, SF3A3, and SEC61A1, were confirmed to be significantly associated with survival. These were used to construct a gene signature. The hazard ratio (HR) of each gene was calculated: ADA, SAC3D1, UPF3B, SF3A3, and SEC61A1 had HRs >0, and were considered high-risk factors associated with short survival; FEN1 and POLR2G had HRs <0, and were considered protective factors associated with long survival (). The mRNA expression levels of these genes in adjacent normal and tumor tissues were also investigated, and we found that the seven genes were all significantly up-regulated in tumor tissues (p<0.05, ). In addition, we explored somatic mutations, including copy-number variations and point mutations in the seven genes of the prognostic signature though the cBioPortal website (www.cbioportal.org). The results showed that total mutation frequency was 6.53%, and all genes in the prognostic signature had missense mutations or copy-number amplifications in patients with HCC ( and ), which suggests that these gene play an role in HCC.
Table 3 Seven mRNAs significantly associated with OS of patients with HCC
Figure 2 Seven screened mRNA which associated with OS.
Notes: (A) Different expression of seven mRNAs in tumor and adjacent non-tumor tissues, ****represents for p-value <0.0001). (B) The total genetic alteration of 7 genes in the HCC sample. (C) Genetic alterations in each of the seven genes in the prognosis signature. Red and blue represent amplification and deletion, respectively.
Development and validation of a seven-gene signature for survival prediction
The seven screened genes were selected to formulate a gene signature. The risk score of every patient was calculated according to the formula:
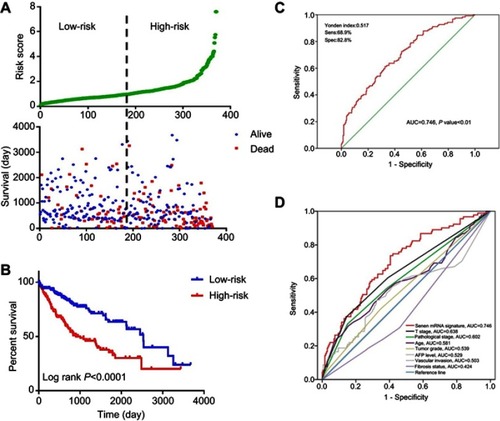
Risk score = (0.167) x ADA value + (0.54) × SAC3D1 value + (0.254) × SEC61A1 value + (0.667) × SF3A3 value + (0.233) × UPF3B value + (−0.276) × FEN1 value + (−0.414) × POLR2G value. The patients were sorted according to risk score and divided into high- and low-risk groups. Risk score distribution and survival status of each patient is shown in . The high-risk group had a higher mortality rate. The mortality rate of the high-risk group was 44.3%, while that of the low-risk group was 26.0%. A chi-squared test showed significant differences in mortality between the two groups (p=0.0000). The Kaplan–Meier curve revealed that patients in the high-risk group had poorer prognoses (log-rank test p<0.0001; ). The median survival for the high-risk group was 2.75 years, and that of the low-risk group was 6.94 years. A ROC curve was generated, and the signature had 68.9% prediction accuracy and 82.8% specificity with a Youden’s index of 0.517, showing good sensitivity and specificity with an average AUC of 0.746 (P<0.01) (). Furthermore, we compared the predictive value for survival of the mRNA-based signature and the other factors using ROC curve analysis. Our results show that T stage (AUC =0.638) and pathological stage (AUC=0.602) have higher predictive value for survival than do other routine factors. However, the 7-mRNA signature (AUC=0.746) may be better for predicting survival in HCC than these routine clinicopathological factors (7-mRNA signature versus T stage P-value =0.031, ).
Figure 3 Evaluation and validation the survival prediction of the risk score signature.
Notes: (A) Risk score distribution and survival status of each patient; (B) Kaplan-Meier survival curves shows a correlation between the expression of the seven-mRNA signature model and overall survival of patients. (log‐rank test P<0.0001); (C) ROC curve show the sensitivity and specificity of the seven-mRNA signature model in predicting the patient overall survival (AUC=0.746, P<0.01); (D) The ROC curves compare predictive value for survival of 7 mRNA signature with routine clinicopathologic.Abbreviations: ROC, Receiver operating characteristic; AUC, Area Under Curve.
Relationship between seven-gene signature risk score and clinicopathological features
We further investigated the relationship between risk score distribution and clinical parameter stratification and found that only tumor grade, pathological stage, and plasma AFP level are associated with our risk score (p<0.05, ). Other clinical features, such as age, gender, HBV or HCV virus infection, and status of liver fibrosis, had no effect on risk score. Thus, the score was related to three parameters, but independent of other clinical information. Furthermore, we used univariate and multivariate Cox regression to examine the combined ability of the signature risk score and other clinicopathological features to predict survival. Univariate Cox regression showed that tumor histological grade, tumor size, neoplasm status, new tumor events after initial treatment, distant metastasis, and signature risk score were significantly related to survival. The Kaplan–Meier curve suggested that the above results and conclusions were consistent, showing that patients with tumors, new tumor events during follow-up, large tumor size, high tumor grade, distant metastasis, or high risk scores have worse prognosis. Notably, the risk scores had greater prognostic value because they were significantly different between univariate and multivariate analyses, with p-values <0.05 (HR =2.38, 95% CI (confidence interval) =1.355–4.184), implying that the risk score is an independent prognostic indicator for HCC (, ).
Table 4 Univariate and multivariate Cox regression analyses for each clinical feature
Figure 4 The relationship between risk score distribution and clinical parameters stratification. Including age, gender, tumor pathologic stage, tumor grade, plasma AFP level and liver fibrosis status.
Notes: *Represent for p-value<0.05, NS represent no statistical difference.
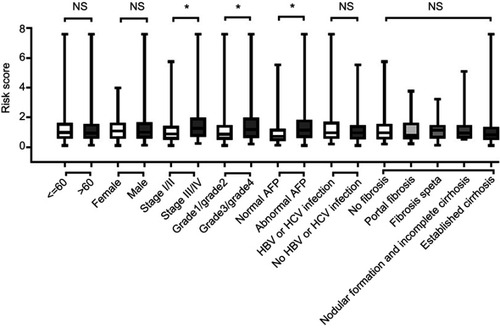
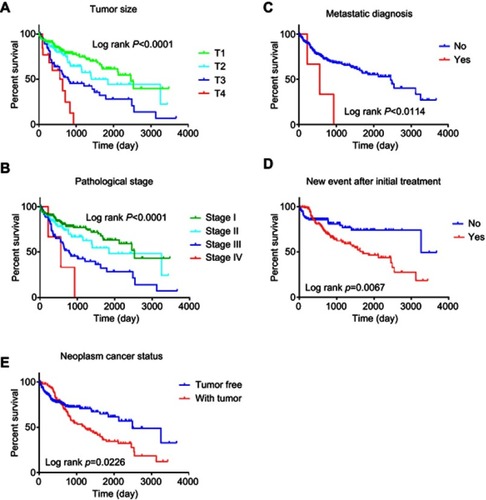
Figure 5 Kaplan–Meier suggested that some clinical features could effectively predict the survival of patients with HCC.
Notes: (A) tumor size; (B) metastatic diagnosis; (C) pathologic stage; (D) new event after initial treatment; (E) neoplasm cancer status.
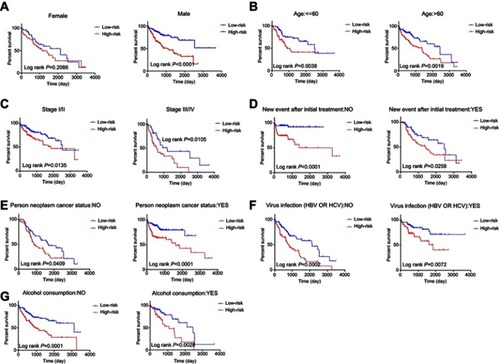
The patients were then stratified into different subgroups according to clinical parameters for further analysis of the relationship between signature risk score and patient prognosis. The Kaplan–Meier curve shows that only in the female subgroup, there was no significant difference between prognoses in the high- and low-risk groups, implying that HCC may be a disease that requires further explanation. There were significant differences between prognoses in the high- and low-risk groups in subgroups stratified by age, pathological stage, new tumor events after initial treatment, tumor status, alcohol consumption, or viral infection. The prognoses of patients in the high-risk groups were always poor. These results indicate that the risk score signature is a stable prognostic marker for patients with HCC and is not influenced by factors that often cause variations in the efficacy of traditional biomarkers ().
Figure 6 Kaplan–Meier curve illustrates the prognostic value of risk score signature based on stratification of different clinical features.
Notes: (A) Gender; (B) Age; (C) Pathological stage; (D) New event after initial treatment; (E) Person neoplasm cancer status; (F) Virus infection; (G) Alcohol consumption.
Discussion
HCC is a highly heterogeneous disease,Citation21,Citation22 which increases the difficulty of treatment and prognostic prediction. There is evidence that commonly used clinicopathological parameters, such as TNM staging, age, gender, viral infection, and serum AFP levels, are not sufficient to accurately predict patient outcomes.Citation23–Citation28 Therefore, a large number of mRNAs have been examined and identified as biomarkers in the process of cancer development and prognosis. For example, Zhang et al confirmed that ATPase family AAA domain containing 2 (ATAD2) is significantly overexpressed in gastric cancer and might serve as an independent marker of poor prognostic in patients.Citation29 However, such biomarkers are limited because they can be influenced by many factors, making their predictive ability unstable. Therefore, data mining techniques as well as univariate and multivariate Cox regression analysis are utilized to develop gene signatures containing various related genes and combining their predictive effects to enhance prediction efficiency. Such signatures are widely used in molecular diagnosis, individualized treatment, and accurate survival prediction,Citation30,Citation31 and the prediction value is superior to those of single biomarkers.Citation18,Citation32–Citation34
Over the years, with the development of high-throughput sequencing technology, the combination of microarray data and bioinformatics has been widely used to find differentially expressed genes in various cancers and to find differential diagnostic and prognostic markers, which usually focus on significant differences. However, GSEA classifies genes based on a series of correlation calculations to determine whether a gene set can reveal the phenotype distribution of related genes. It only emphasizes a specific function rather than exploring a wide range of genes. In addition, the method can find biomarkers in just a few steps. In this study, we performed GSEA analysis using mRNA expression profiles from 365 HCC patients, and we found that eight biological processes or pathways were significantly enriched, with p<0.05 and FDR <0.25. The DNA repair process had the lowest p-value, and we chose it for further analysis. Next, univariate Cox regression analysis was used to identify mRNAs associated with survival in HCC. We found that 80 mRNAs were associated with survival, with p<0.05. We selected the 26 mRNAs most significantly associated with survival (p<0.0001) and further analyzed and identified 7 mRNAs that predicted survival in patients with a multivariate Cox proportional hazards model. These together were used to derive a signature risk score. According to the risk score, patients were separated into high- and low-risk groups. A Kaplan-Meier curve showed that the high-risk group had poor prognosis. Furthermore, we performed univariate and multivariate Cox regression analysis to explore the combined ability of the signature risk score and other clinicopathological parameters to predict survival. The results confirmed that the risk score is a stable, independent prognostic indicator and suggests that the risk score could be of important significance for patients with HCC as an effective clinical classification tool.
DNA damage stimulated by carcinogens or metabolic processes can be translated into genetic mutations, further leading to genomic instability and malignant transformation. To prevent this, DNA damage response and repair interactions counteract threats to genomic integrity; thus, changes in DNA repair capacity caused by genetic polymorphisms may be associated with cancer propensity.Citation35 Studies have shown that DNA repair genes are responsible for repairing different types of DNA damage,Citation36,Citation37 and genetic polymorphisms have been found in almost all human DNA repair genes.Citation38 Meanwhile, polymorphisms in DNA repair genes are associated with various cancers, such as lung,Citation39 epithelial ovarian,Citation40 and pancreatic cancer.Citation41 Several studies have predicted HCC survival using DNA repair-related genes. For example, Long, et al shows that the DNA repair genes XRCC4 and XXCC5 may be genetic markers for aflatoxin (AFB1) exposure-induced hepatocellular carcinoma risk and outcome.Citation42 Within the identified gene signature in our study, SAC3D1 is highly expressed in hepatocellular carcinoma tissues and is associated with poor prognosis. It can be used as a biomarker for prognosis of HCC.Citation43 Flap endonuclease 1 (FEN1) is a structurally specific nuclease that takes an essential role in a variety of DNA metabolic pathways and in the maintenance of genomic stability. Human FEN1 mutations that impair its exonuclease activity are associated with cancer development.Citation44 Meanwhile, Liu et al reported that functional FEN1 genetic variation increases the risk of colorectal cancer, HCC, gastric cancer, and esophageal cancer.Citation44 SF3A3 is a nucleic acid metabolism-related gene involved in DNA replication, repair, and transcriptional regulation.Citation45 SF3A3 is also an activity-suppressing genes of the tumor suppressor P53. Silencing of this gene increases the expression level of p53, thereby inducing tumor cell cycle arrest and cell death.Citation46 ADA primarily regulates immune responses by degrading adenosine.Citation47 The POLR2G, SEC61A1, and UPF3B genes have been rarely studied in relation to tumors. POLR2G is mainly involved in biological processes, and can mediate chromosomal imbalances that lead to abnormal regulation of genes in normal and ectopic tissues of the ovary.Citation48 SEC61A1 is the major subunit of the SEC61 complex and is the major polypeptide conduction channel in the endoplasmic reticulum membrane. Its missense mutation can cause genetic immune-related diseases, such as plasma cell deficiency.Citation49 UPF3B is located on the X chromosome, and its mutation can cause neurodevelopmental disorders.Citation50 In our study, all seven genes were significantly associated with the prognosis of HCC. However, no DNA repair gene signature has previously been developed for the prediction of HCC prognosis. Therefore, we used bioinformatics methods to identify a signature composed of ADA, FEN1, POLR2G, SAC3D1, UPF3B, SF3A3, and SEC61A1, which are associated with DNA repair, and demonstrated its prognostic value in HCC.
Conclusion
In summary, we developed a seven‐gene risk signature related to the DNA repair process that can forecast survival in HCC, with higher risk scores indicating poor prognosis. Additionally, its prognostic value remained stable despite variations in age, clinical pathological stage, historical risk factors and neoplasm status. This signature could serve as an effective and stable classification tool for clinical practice.
Data sharing statement
All mRNA Seq-data were obtained from TCGA (https://tcga-data.nci.nih.gov/).
Author contributions
Na Li and Yongyu Liu participated in the conception and design of the study. Na Li and Chunyan Guo gathered data. Chang Liu and Lan Zhao analyzed and interpreted data. Na Li and Lan Zhao performed statistical and bioinformatics analyses. Na Li drafted the manuscript. Yongyu Liu revised the manuscript. All authors read and approved the final manuscript. All authors contributed toward data analysis, drafting, and critical revision of the paper and agree to be accountable for all aspects of the work.
Disclosure
The authors report no conflicts of interest in this work.
Acknowledgment
This work was supported by grants from the Liaoning Natural Science Fund Project (No. 20180550054) and the Shenyang Science and Technology Project (18-014-4-57).
References
- Forner A, Reig M, Bruix J. Hepatocellular carcinoma. Lancet. 2018;391(10127):1301–1314. doi:10.1016/S0140-6736(18)30010-229307467
- Torre LA, Bray F, Siegel RL, Ferlay J, Lortettieulent J, Jemal A. Global cancer statistics, 2012. CA Cancer J Clin. 2015;65(2):87–108. doi:10.3322/caac.2126225651787
- Venook AP, Papandreou C, Furuse J, Guevara LLD. The incidence and epidemiology of hepatocellular carcinoma: a global and regional perspective. Oncologist. 2010;Suppl 15(Supplement 4):5–13. doi:10.1634/theoncologist.2010-S4-05
- Goh GB, Chang PE, Tan CK. Changing epidemiology of hepatocellular carcinoma in Asia. Best Pract Res Clin Gastroenterol. 2015;29(6):919–928. doi:10.1016/j.bpg.2015.09.00726651253
- Budhu A, Jia HL, Forgues M, et al. Identification of metastasis-related microRNAs in hepatocellular carcinoma. Hepatology. 2010;47(3):897–907. doi:10.1002/hep.22160
- Wang NY, Wang C, Li W, et al. Prognostic value of serum AFP, AFP-L3, and GP73 in monitoring short-term treatment response and recurrence of hepatocellular carcinoma after radiofrequency ablation. Asian Pac J Cancer Prev. 2014;15(4):1539–1544. doi:10.7314/apjcp.2014.15.4.153924641364
- Wang L, Yao M, Pan LH, Qian Q, Yao DF. Glypican-3 is a biomarker and a therapeutic target of hepatocellular carcinoma. Hepatob Pancreat Dis Int. 2015;14(4):361–366. doi:10.1016/S1499-3872(15)60396-4
- Marrero JA, Feng Z, Wang Y, et al. Alpha-fetoprotein, des-gamma carboxyprothrombin, and lectin-bound alpha-fetoprotein in early hepatocellular carcinoma. Gastroenterology. 2009;137(1):110. doi:10.1053/j.gastro.2009.04.00519362088
- Sun DW, Zhang YY, Sun XD, et al. Prognostic value of cytokeratin 19 in hepatocellular carcinoma: A meta-analysis. Clinica Chimica Acta. 2015;448:161–169. doi:10.1016/j.cca.2015.06.027
- Tangkijvanich P, Anukulkarnkusol N, Suwangool P, et al. Clinical characteristics and prognosis of hepatocellular carcinoma: analysis based on serum alpha-fetoprotein levels. J Clin Gastroenterol. 2000;31(4):302–308.11129271
- Kudo M. Surveillance, diagnosis, treatment, and outcome of liver cancer in Japan. Liver Cancer. 2015;4(1):39–50. doi:10.1159/00036772726020028
- Dalerba P, Sahoo D, Paik S, et al. CDX2 as a prognostic biomarker in Stage II and Stage III colon cancer. N Engl J Med. 2016;374(3):211–222. doi:10.1056/NEJMoa150659726789870
- Jin GZ, Yu WL, Dong H, et al. SUOX is a promising diagnostic and prognostic biomarker for hepatocellular carcinoma. J Hepatol. 2013;59(3):510–517. doi:10.1016/j.jhep.2013.04.02823665285
- Cheng W, Ren X, Zhang C, et al. Bioinformatic profiling identifies an immune-related risk signature for glioblastoma. Neurology. 2016;86(24):2226–2234. doi:10.1212/WNL.000000000000277027225222
- Zhao L, Jiang L, He L, et al. Identification of a novel cell cycle-related gene signature predicting survival in patients with gastric cancer. Journal of Cellular Physiology May 2019;234(5):6350–6360.
- Lourdes M, Moisès B, María José R, et al. Gene expression signature in urine for diagnosing and assessing aggressiveness of bladder urothelial carcinoma. Clin Cancer Res. 2010;16(9):2624–2633. doi:10.1158/1078-0432.CCR-09-337320406841
- Sun T, Iris S, Victor M, et al. A combined oncogenic pathway signature of BRAF, KRAS and PI3KCA mutation improves colorectal cancer classification and cetuximab treatment prediction. Gut. 2013;62(4):540–549. doi:10.1136/gutjnl-2012-30242322798500
- Li Q, Su YL, Shen WX. A novel prognostic signature of seven genes for the prediction in patients with thymoma. J Cancer Res Clin Oncol. 2019;145(1):109–116. doi:10.1007/s00432-018-2770-x30328513
- Villanueva A, Portela A, Sayols S, et al. DNA methylation-based prognosis and epidrivers in hepatocellular carcinoma. Hepatology. 2015;61(6):1945–1956. doi:10.1002/hep.2773225645722
- Subramanian A, Tamayo P, Mootha VK, et al. Gene set enrichment analysis: a knowledge-based approach for interpreting genome-wide expression profiles. Proc Natl Acad Sci USA. 2005;102(43):15545–15550. doi:10.1073/pnas.050658010216199517
- Jeng KS, Chang CF, Jeng WJ, Sheen IS, Jeng CJ. Heterogeneity of hepatocellular carcinoma contributes to cancer progression. Crit Rev Oncol Hematol. 2015;94(3):337–347. doi:10.1016/j.critrevonc.2015.01.00925680939
- Lin DC, Mayakonda A, Dinh HQ, et al. Genomic and epigenomic heterogeneity of hepatocellular carcinoma. Cancer Res. 2017;77(9):2255–2265. doi:10.1158/0008-5472.CAN-16-282228302680
- Trevisani F, D’Intino PE, Morsellilabate AM, et al. Serum alpha-fetoprotein for diagnosis of hepatocellular carcinoma in patients with chronic liver disease: influence of HBsAg and anti-HCV status. J Hepatol. 2001;34(4):570–575.11394657
- Zhou F. Serum tumor markers for detection of hepatocellular carcinoma. World J Gastroenterol. 2006;12(8):1175–1181. doi:10.3748/wjg.v12.i8.117516534867
- Li Z, Rui JA, Wang SB, Chen SG, Qiang Q. LCSGJ-T classification, 6th or 5th edition TNM staging did not independently predict the long-term prognosis of HBV-related hepatocellular carcinoma after radical hepatectomy. J Surg Res. 2010;159(1):538–544. doi:10.1016/j.jss.2008.09.00419111323
- Pawlik TM, Poon RT, Abdalla EK, et al. Hepatitis serology predicts tumor and liver-disease characteristics but not prognosis after resection of hepatocellular carcinoma. J Gastrointest Surg. 2004;8(7):794–805. doi:10.1016/j.gassur.2004.06.01315531232
- Tan JT, Zhao C, Peng NF, et al. Association between age and overall survival of patients with hepatocellular carcinoma after hepatic resection. J Surg Oncol. 2016;114(8):966. doi:10.1002/jso.2443427633143
- Tangkijvanich P, Mahachai V, Suwangool P, Yong P. Gender difference in clinicopathologic features and survival of patients with hepatocellular carcinoma. 世界胃肠病学杂志 (英文版). 2004;10(11):1547–1550.15162522
- Zhang M, Zhang C, Du W, Yang X, Chen Z. ATAD2 is overexpressed in gastric cancer and serves as an independent poor prognostic biomarker. Clin Transl Oncol. 2016;18(8):776–781. doi:10.1007/s12094-015-1430-826527032
- Ashley EA. The precision medicine initiative: a new national effort. JAMA. 2015;313(21):2119–2120. doi:10.1001/jama.2015.359525928209
- Yu Y, Feng X, Cang S. A two-microRNA signature as a diagnostic and prognostic marker of pancreatic adenocarcinoma. Cancer Manag Res. 2018;10:1507–1515. doi:10.2147/CMAR.S15871229942152
- Cheng W, Ren X, Cai J, et al. A five-miRNA signature with prognostic and predictive value for MGMT promoter-methylated glioblastoma patients. Oncotarget. 2015;6(30):29285–29295. doi:10.18632/oncotarget.497826320189
- Bao Z-S, Li M-Y, Wang J, et al. Prognostic Value of a Nine-Gene Signature in Glioma Patients Based on mRNA Expression Profiling. CNS Neuroscience & Therapeutics. 2014:20(2):112–118.
- Yuan GQ, Wei NL, Mu LY, et al. A 4-miRNAs signature predicts survival in glioblastoma multiforme patients. Cancer Biomark. 2017;20(4):443–452. doi:10.3233/CBM-17020528869437
- Lord CJ, Alan A. The DNA damage response and cancer therapy. Nature. 2012;481(7381):287–294. doi:10.1038/nature1076022258607
- Hoeijmakers JH. Genome maintenance mechanisms for preventing cancer. Nature. 2001;411(6835):366–374. doi:10.1038/3507723211357144
- Christmann M, Tomicic MT, Roos WP, Kaina B. Mechanisms of human DNA repair: an update. Toxicology. 2003;193(1):3–34.14599765
- Memisoglu A, Samson L. Base excision repair in yeast and mammals. Mutat Res. 2000;451(1):39–51. doi:10.1016/s0027-5107(00)00039-710915864
- Sarlinova M, Majerova L, Matakova T, et al. Polymorphisms of DNA repair genes and lung cancer in chromium exposure. Adv Exp Med Biol. 2016;833:1–8.
- Annika A, Honglin S, Christy W, et al. Polymorphisms in DNA repair genes and epithelial ovarian cancer risk. Int J Cancer. 2010;117(4):611–618.
- Mcwilliams RR, Bamlet WR, Cunningham JM, et al. Polymorphisms in DNA repair genes, smoking, and pancreatic adenocarcinoma risk. Cancer Res. 2008;68(12):4928–4935. doi:10.1158/0008-5472.CAN-07-553918544627
- Xi-Dai L, Dong Z, Chao W, et al. Genetic polymorphisms in DNA repair genes XRCC4 and XRCC5 and aflatoxin B1-related hepatocellular carcinoma. Epidemiology. 2013;24(5):671–681. doi:10.1097/EDE.0b013e31829d274423788213
- Han M-E, Kim J-Y, Kim GH, Park SY, Kim YH, Oh S-O. SAC3D1: a novel prognostic marker in hepatocellular carcinoma. Sci Rep. 2018;8(1). doi:10.1038/s41598-018-34129-9
- Zheng L, Dai H, Hegde ML, et al. Fen1 mutations that specifically disrupt its interaction with PCNA cause aneuploidy-associated cancer. Cell Res. 2011;21(7):1052–1067. doi:10.1038/cr.2011.3521383776
- Yang ZM, Chen WW, Wang YF. Study on gene differential expressions of substance and energy metabolism in chronic superficial gastritis patients of pi deficiency syndrome and of pi-wei hygropyrexia syndrome. Chin J Integr Med. 2012;32(9):1180–1187.
- Olst ESV, Blijlevens M, Menezes RXD, Meulen‐Muileman IHVD, Smit EF, Beusechem VWV. A genome-wide siRNA screen for regulators of tumor suppressor p53 activity in human non-small cell lung cancer cells identifies components of the RNA splicing machinery as targets for anticancer treatment. Mol Oncol. 2017;11(5):534–551. doi:10.1002/1878-0261.1205228296343
- Spina C, Saccucci P, Cozzoli E, Bottini E, Gloriabottini F. A study of three polymorphic sites of ADA gene in colon cancer. Cancer Invest. 2010;28(10):989. doi:10.3109/07357907.2010.48350120590444
- Veiga-Castelli LC, Silva JCRE, Meola J, et al. Genomic alterations detected by comparative genomic hybridization in ovarian endometriomas. Braz J Med Biol Res. 2010;43(8):799–805. doi:10.1590/S0100-879X201000750007220725696
- Bolar NA, Golzio C, Živná M, et al. Heterozygous loss-of-function SEC61A1 mutations cause autosomal-dominant tubulo-interstitial and glomerulocystic kidney disease with anemia. Am J Hum Genet. 2016;99(1):174–187. doi:10.1016/j.ajhg.2016.05.02827392076
- Alrahbeni T, Sartor F, Anderson J, Miedzybrodzka Z, Mccaig C, Müller B. Full UPF3B function is critical for neuronal differentiation of neural stem cells. Mol Brain. 2015;8(1):33. doi:10.1186/s13041-015-0122-126012578