
Abstract
Purpose
Micheliolide (MCL) is an effector compound of the flower which has been traditionally used to treat inflammation and cancer patients in oriental medicine. MCL has killing effects on several cancer and immune cells by modulating apoptosis, cell cycle, and metabolism. However, the detail of the mechanisms of anti-cancer activity remains to be elucidated and the effect on liver cancer cells is unknown.
Methods
Cell proliferation was determined by CCK8 and clone formation assay. The xenograft liver cancer model formed by injecting Huh7 cells into NUDE mice was used to evaluate the effects of MCL on liver cancer cells in vivo. We evaluated the stemness of cells with spheroid formation assay and flow cytometry assay. The apoptosis was determined by Annexin V assay. F-actin staining and ROS were performed to detect the impairment of the F-actin cytoskeleton and mitochondria.
Results
Here, we first show that MCL inhibits liver cancer cells both in vivo and in vitro by triggering apoptosis which was reduced by anti-oxidant, but not cell-cycle arrest. In addition, MCL induces mitochondrial ROS and caspase-3 activation. Also, we found that the aggregation of mitochondria and the perturbation of F-actin fibers in the MCL-treated liver cancer cells coincidently occurred before the induction of apoptosis and mitochondrial ROS.
Conclusion
These results suggest that F-actin perturbation is involved in impaired mitochondria and apoptosis. Therefore, MCL can be a potent therapeutic reagent for liver cancer, primarily targeting the actin cytoskeleton.
Introduction
Hepatocellular carcinoma (HCC) is the dominant type of primary carcinoma of the liver, which is one of the most aggressive malignancies and the second leading cause of cancer-related deaths worldwide.Citation1 Although surgical resection still serves as the most reliable treatment,Citation2 over half of the patients were at the mid to late stage, which cannot be resolved by surgery, because of the lack of efficient early diagnostic markers.Citation3 In addition, the postoperative patients have a high rate of recurrence and metastasis.Citation4 To improve the treatments of HCC on the limited condition of a few therapeutic options, and the different condition of patients, multidisciplinary and multifaceted interventions combined with surgical resection, local radiotherapy, molecular targeted drug therapy, and biological immunity have been considered as a rational choice.Citation5 Among them, molecular targeted drug therapy can be improved efficiently compared to other therapeutic options. For example, many reports showed that small molecular compounds from traditional Chinese medicine (TCM) could be the effective anti-cancer drug.Citation6–Citation9
While Parthenolide, a germacrane sesquiterpene lactone, is one of the TCM compounds showing high potent anti-tumor activity, it has evident drawbacks, such as high toxicity and instability. Micheliolide (MCL), a guaianolide sesquiterpene lactone isolated from Magnoliaceae has been given attention because it shows stronger plasma stability and low toxicity as well as a potent anti-tumor effect for leukemia, ovarian cancer, breast cancer, and glioma.Citation10–Citation12 In addition, MCL is cost-efficiently produced because it is directly isolated from Michelia compressa (Magnoliaceae) or semi-synthesized from parthenolide.Citation13 To our knowledge, there is no report about the effects of MCL on HCC. Therefore, in the present study, we evaluated the anti-tumor effects of MCL on HCC both in vivo and in vitro.
Materials And Methods
Cell Culture And Drug Treatment
The human HCC cell lines (Huh7, HepG2, QGY-7703, Bel-7404, Hep3B, PLC/PRF/5) were obtained from ATCC (American Type Culture Collection) and Cell Resource Center of Chinese Academy of Science. All the cells were cultured in Dulbecco’s Modified Eagle’s Medium (DMEM, Gibco, Grand Island, NY, USA) containing 10% fetal bovine serum (FBS) at 37°C in a humidified atmosphere containing 5% CO2. Micheliolide (MCL, purity 98%, Chunqiu biology, China) was dissolved in dimethylsulfoxide (DMSO) at a stock concentration of 10 mM. N-acetyl-L-cysteine (NAC, Sigma) was prepared at 1M.
Cell Growth Assay And Trans-Well Assay
Huh7 cells were treated with MCL at different concentrations (0, 10, 30, 60, 90 µM) for 8 hr and further incubated with fresh medium for 24 hr. Subsequently, cells were collected and re-seeded in a 96-well plate at a density of 3000 cells/well. After 12 hr, cells were incubated with Cell Counting Kit-8 (CCK-8, Dojindo Molecular Technologies) for 1 hr and measured at an optical density (OD) of 450 nm. For other HCC cells, a single concentration of MCL (30 µM) was used to confirm the result from the Huh7 cells. For the colony formation assay, Huh7 cells were seeded in 6-well plates at a density of 500 cells/well. After 14 days, the cells were fixed with cold methanol and stained with crystal violet to count the number of colonies.
For the trans-well assay, Huh7 cells were treated with MCL at different concentrations (0, 30 60, 90 µM) for 8 hr and further incubated with fresh medium for 24 hr. Subsequently, cells were collected and suspended (1×10⁵/mL) in serum-free DMEM. One hundred microliters of the cell suspension were seeded onto the 8-mm pore size membrane trans-well filters (Corning, USA). The trans-wells were placed in the 24-well tissue culture plate filled with 600 µL DMEM containing 10% FBS and incubated for 24 hr. Then, cells were stained with crystal violet dye and the number of migrations was counted.
Stemness Assay And Flow Cytometry Assay
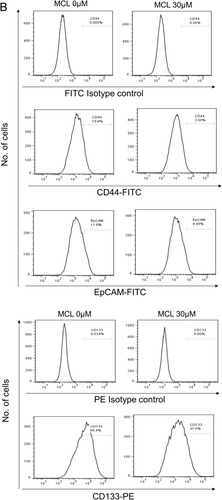
For the spheroid formation assays, Huh7 cells were treated with MCL (30 µM) or DMSO for 8 hr and further incubated with fresh medium for 24 hr. Subsequently, 1000 cells were collected, suspended in DMEM/F12 medium containing 20 ng/mL EGF, 20 ng/mL basic FGF and B27 supplements, and seeded on a Costar® Ultra Low Attachment 6-well plate (Corning) for 14 days. Spheroids were counted to measure the spheroid-forming index when larger than 100 µm. To evaluate the expression of the stemness marker, HCC cells were preformed to fluorescence-activated cell-sorting cytometry (FACS) analysis. After treatment of MCL as above, 1×10⁶ cells were collected, washed, incubated for 30 min at 4 °C with respective fluorescence-conjugated antibodies including CD44-FITC, EpCAM-FITC, and CD133-PE (BD, Biosciences, San Jose, CA, USA). The appropriate fluorochrome-conjugated, isotype-matched antibodies were used as a control to establish background staining. Samples were acquired on a FACS Forte and data were analyzed with DIVA software (BD, Biosciences, San Diego, CA).
Analysis Of Apoptosis, Cell Cycle, And Mitochondria
Huh7 cells were treated with the indicated concentrations of MCL and collected for analysis of apoptosis using Annexin V/propidium iodide (PI) kit (BD Biosciences, Franklin Lakes, NJ, USA) according to the manufacturer’s instruction. After washing with binding buffer, the staining was performed to measure cell apoptosis according to the instructions. To evaluate the role of reactive oxygen species (ROS) in the apoptosis induced by MCL, Huh7 cells were pre-treated with 5 mM NAC 24 hr prior to the MCL treatment. To evaluate cell cycle, the nuclei were fixed and stained with DNA staining buffer for 30 min at room temperature according to the manufacturer’s instruction for the cell-cycle analysis kit (Multi Science, China). The DNA content was analyzed using FACS. To support the observation on apoptosis, Western blotting for apoptosis markers such as caspase3 and PARP were performed from the cells treated in the indicated concentrations of MCL. Western blotting analysis was performed as previously described.Citation14 Huh7 cells were harvested and lysed in protein lysis buffer (Thermo) on ice. After centrifugation at 12,000 rpm, 20 µg of protein of lysates from each group was subjected to Western blotting to measure the expression level of cleaved caspase3, cleaved PARP, and tubulin (Cell Signaling Technology, Inc., Danvers, MA, USA). To measure the mitochondrial ROS level of HCC cells, cells treated with the indicated conditions were harvested and resuspended in HBSS with 3 μM MitoSOX Red (Thermo) for 20 min at 37°C. After washing with phosphate-buffered saline (PBS), cells were analyzed on FACS with PE filter.
F-Actin Cytoskeleton Staining
Cells treated with the indicated conditions were seeded on the coverslip coated with Matrigel (Corning). To visualize mitochondria, cells were stained with MitoTracker Green (Thermo) for 20 min and washed with PBS for 3 times. Subsequently, cells were stained with 100 nM Alexa Fluor™ 568 phalloidin (Thermo) according to the manufacturer’s instruction. Briefly, cells were fixed with 4% paraformaldehyde (PFA) for 10 min at room temperature, permeabilized in 0.1% Triton X-100 in PBS for 15 min, stained with 5 µL stock solution into 200 µL PBS with 1% bovine serum albumin (BSA) for each coverslip at room temperature for 30 min. After washing with PBS 3 times, the coverslips were mounted with VECTASHIED solution (Vector) with 4’,6-diamidino-2-phenylindole, dihydrochloride (DAPI, Thermo), and processed to fluorescent microscopy analysis.
Anti-Tumor Effect Of MCL In Xenograft Model
Animal experiments were approved by the Institutional Animal Care and Use Committee in SMU. Huh cells (5x10⁶) were inoculated subcutaneously into the flanks of mice with Matrigel. Mice were divided into two groups when the tumor size reached 1 cm3 and tumor size was measured bi-dimensionally and calculated with the formula (length x width2)/2. Then, the MCL-treated group was treated with 20 mg/kg body weight per day through intraperitoneal injection (i.p.). The control group was treated with DMSO at the same volume simultaneously. Then, body weights and tumor size were measured until the tumor xenografts were harvested.
All animal studies were carried out in accordance with the UK Animal (Scientific Procedures) Act, 1986 and associated guidelines.
Statistical Analysis
SPSS 22.0 and GraphPad Prism 5.0 software were used for the statistical analysis of this study. All data were demonstrated with means ± standard deviation. The comparisons between two groups were performed using Student’s t-test (two-tailed). One-way analysis of variance (ANOVA) was used to analyze the difference among multiple groups. A result of p<0.05 was considered statistically significant.
Results
MCL Inhibited The Proliferation, Migration, And Stemness Of HCC Cells In Vitro And In Vivo
We first tested if MCL treatment impacted the growth of a liver cancer cell, Huh7 cell by CCK assay in different concentrations. The results indicated that MCL reduced the cell growth rate in a dose- and time-dependent manner (). Especially, more than 30 µM of MCL showed an evident impact on cancer cell growth and that concentration is consistently effective on a variety of hepatocellular carcinoma (HCC) lines such as HepG2, QGY-7703, Bel-7404, Hep3B, and PLC/PRF/5 (). In addition, MCL treatment suppressed the malignant characteristics of Huh7 cells such as colony-forming ability and mobility in a dose-dependent manner, assessed by colony-forming assay and trans-well assay, respectively ( and ). Compared to the cells treated with DMSO, the cells treated with different concentrations of MCL showed reduced colony-forming ability in a dose-dependent manner. The number of migrated cells was significantly reduced after treating with MCL compared to the non-treated cells. Notably, MCL is effective on colony formation at a lower concentration (30 µM) compared to migration (60 µM), suggesting that MCL is effective on primary liver cancer rather than metastasis.
Figure 1 MCL impact on the HCC growth in vivo and in vitro. (A) Huh7 cells treated with the indicated dose of MCL were analyzed for proliferation using the CCK8 assay from 24 hr to 72 hr. n = 3. Values represent means ± standard deviation (s.d.). Repeated measures ANOVA, followed by Bonferroni post-tests. p<0.001. (B) Several liver cancer cells such as Huh7, HepG2, QGY-7703, Bel-7404, Hep3B, and PLC/PRF/5 treated with 30 µM MCL were analyzed for proliferation using the CCK8 assay at 24 hr. (C) Colony formation assay in Huh7 cells treated with the indicated dose of MCL. Representative images showed colonies stained with crystal violet. The number of colonies in each well was counted. n= 3. Values represent the mean ± s.d. ANOVA. p<0.01 (D) Trans-well assay in Huh7 cells treated with the indicated dose of MCL. Representative images showed colonies stained with crystal violet. The number of cells in each well was counted. n= 3. Values represent the mean ± s.d. ANOVA. p<0.001. (E, F) Measurement size (E) and weight (F) of tumors formed from Huh7 cells injected in NUDE mice. Huh7 cells were injected into NUDE mice. When tumors were grown to 1 cm3, MCL was injected daily for the indicated number of days. Individual tumor volumes were measured every day. Repeated measures ANOVA, followed by Bonferroni post-tests. At the end of the MCL treatment, all tumors were weighed and photographed. Mann–Whitney test. *p<0.05. **p< 0.01.
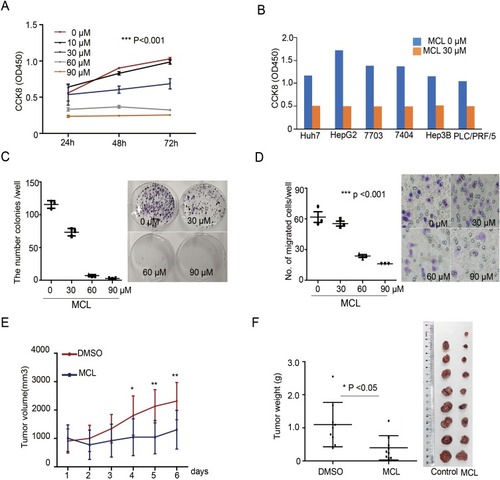
To evaluate the effects of MCL on liver cancer cells in vivo, we used a xenograft HCC model formed by subcutaneously injecting Huh7 cells into NUDE mice. After the tumors were grown to a size of 1 cm3, the mice were treated with MCL in 20 mg/kg per day or DMSO as the control and the volume of tumors was measured daily. After 6 days, tumor xenografts were harvested and weighed ( and ). The size of isolated xenografts from the control was larger than the MCL-treated group. Compared to the DMSO-treated group, statistical analysis indicated the volume and weight of the isolated tumor from the MCL-treated group were significantly decreased. Altogether, MCL is an efficient anti-tumorigenesis reagent for HCC both in vitro and in vivo, although probably less efficient on the metastasis of HCC.
Because stemness of HCC is important for tumor growth (reference), we next tested whether the level of HCC stemness markers and number of tumor spheres are affected by MCL. A minimum effective concentration of MCL based on the growth assay was considered to be 30 µM, and after treatment with MCL in 30 µM, the HCC cells yielded a smaller as well as a lower number of spheres (15±1.2 vs. 1±0.2, p<0.05) (). Moreover, the expression of several HCC stemness markers such as CD44, CD133, and EpCAM in the Huh7 cells treated with MCL were clearly decreased compared to cells treated only with DMSO (). These results demonstrated that MCL could reduce the stemness of HCC cells.
Figure 2 MCL impact on the HCC stemness. (A) Tumor sphere assay in suspension culture. By counting the number of spheroids in the condition of either 30 µM MCL treatment or DMSO only (0 µM), spheroid formation ability was evaluated. n= 3. Values represent the mean ± s.d. Unpaired t-test. p< 0.001. (B) FACS analysis for liver cancer cell stemness markers. Cells highly expressing liver cancer cell stemness markers such as CD44, EpCAM, and CD133 were analyzed in the condition of either 30 µM MCL treatment or DMSO only.
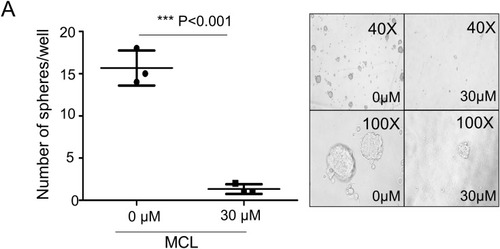
Figure 2 (Continued).
MCL Induced Perturbation Of F-Actin And Mitochondria Aggregation Before Apoptosis
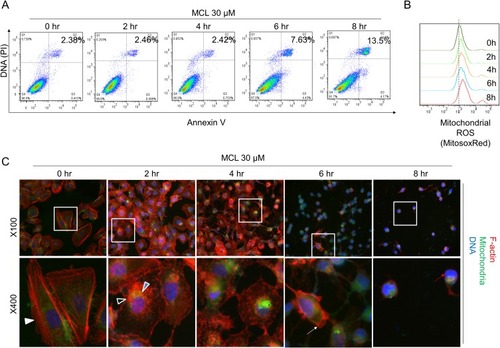
Because apoptosis is a major observation in cells treated with MCL, apoptosis was monitored in the Huh7 cells treated with 30 µM MCL in the time-dependent manner (). Although apoptosis was highly triggered at 8 hr after treatment with MCL (13.5%), it was apparently induced at 6 hr after treatment with MCL (about 7%). Consistently, mitochondrial ROS monitored using a mitochondria-specific ROS marker, mitoSOX, was increased from 4 hr after treatment (), suggesting that mitochondrial impairment is a cause of apoptosis. Interestingly, we found that the cells treated with MCL showed abnormal morphology. Therefore, we visualized the cellular morphology and cytoskeleton structure by staining F-actin on Huh7 in the treatment of 30 µM MCL at different time points, including 0, 2, 4, 6, and 8 hr (). The normal Huh7 cells displayed the stretched filamentous F-actin strings and evenly distributed mitochondria (0 hr). However, F-actin fibers became shorter and irregularly destructured after 2 hr, accompanied by aggregated mitochondria. Also, F-actin staining showed membrane blebbing, an apoptotic marker which is consistent with the induction of apoptosis at 6 hr after treatment (). In addition, nuclear condensation showed a late state of apoptosis at 8 hr. These data indicated that MCL treatment disturbed the F-actin cytoskeleton and induced abnormal aggregated mitochondria, leading to mitochondria dysfunction and apoptosis.
Figure 3 Impairment of both the F-actin cytoskeleton and mitochondria is an earlier event than apoptosis in the liver cancer cells treated with MCL. (A) Huh7 cells treated with 30 µM MCL for the indicated time were analyzed for apoptosis using FACS with Annexin V assay. (B) Huh7 cells treated with 30 µM MCL for the indicated time were analyzed for mitochondrial ROS using FACS with mitochondrial ROS indicator, mitoSox. (C) Huh7 cells treated with 30 µM MCL for the indicated time were analyzed for the structure of both cytoskeleton and mitochondria under fluoromicroscope. The arrows indicated the destructuring F-actin fibers. Phalloidin and MitoTracker Green FM were used for the staining of the actin cytoskeleton and the mitochondria, respectively.
MCL Effectively Induced Apoptosis In Liver Cancer Cell But Not Cell Cycle
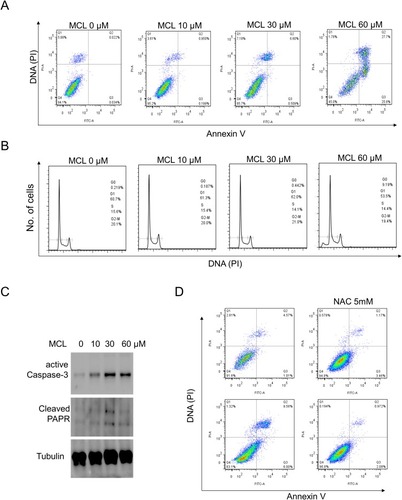
As a mechanistic study on the anti-tumor efficacy of MCL against Huh7 cell, apoptosis, and the cell cycle were investigated in a dose-dependent manner since both cell fate determination was a well-known MCL impact. MCL induced the apoptosis of HCC cells. The flow cytometric analysis indicated that the apoptosis rate of Huh7 cells treated with MCL was triggered even in at a dose as low as 10 µM (0.95%) and was obviously induced at a dose of more than 30 µM (about 6%), which are the concentrations showing anti-cancer activity (). However, the cell cycle of MCL-treated Huh7 cells was not distinguishable from normal cells unless treated with more than 60 µM (). Consistent with the result that apoptosis is obvious from the treatment of 30 µM MCL, the level of both cleaved caspase-3 and cleaved PARP, apoptosis-related markers, were increased in the cells treated with 30 µM MCL (). Because mitochondrial ROS was increased in the cells treated with MCL (), we tested if the ROS is involved in the induction of apoptosis. To do this, Huh7 cells were pre-treated with 5 mM NAC (ROS scavengers) before treatment with MCL (). Cells treated with anti-oxidant largely alleviated the apoptosis rate of HCC cells induced by MCL (9.5% vs. 0.9%), demonstrating that mitochondrial ROS induced by MCL is involved in MCL-induced apoptosis.
Figure 4 MCL is more effective for apoptosis in liver cancer cells than the cell cycle. (A) Huh7 cells treated with the indicated doses of MCL were analyzed for apoptosis using FACS with Annexin V assay. (B) Huh7 cells treated with the indicated doses of MCL were analyzed for cell cycle using FACS with PI staining. (C) Huh7 cells treated with the indicated doses of MCL were analyzed for the level of apoptosis markers such as caspase and PARP using Western blotting with anti-active caspase 3 and anti-PARP, respectively. Tubulin was used as an internal control. (D) The impact of ROS on the MCL-triggered apoptosis in liver cancer cells was evaluated by Annexin V assay using a ROS scavenger, NAC. NAC was pre-treated to Huh7 cells before MCL treatedment.
Discussion
Although improvement in clinical treatments for HCC has been made for a long time, the prognosis remains extremely poor because of the high frequency of recurrence and metastasis.Citation15 Therefore, new targeted therapy is urgently sought. Natural products play a critical role in the discovery and development of numerous drugs for the treatment of various types of deadly diseases including cancer via different mechanisms.Citation16–Citation18 In the present study, the potent anti-tumor activity of MCL for hepatocellular carcinoma (HCC) was revealed. Notably, the effective concentration of MCL on liver cancer cell growth and migration was different. While liver cancer cell growth was inhibited by treatment with more than 30 µM MCL, migration was reduced by more than 60 µM MCL. With this observation, we expected that MCL could be more effective on primary liver cancer than metastasis.
It is well-known cancer stem cells (CSCs) are responsible for drug resistance and tumor recurrence, suggesting that eliminating the CSCs may be a crucial element for oncotherapy.Citation19 A positive population for the expression of liver cancer cell stemness markers such as CD44+, CD133+, and EpCAM+ has been proved to be involved in tumor progression of human malignancy including HCC.Citation20–Citation22 CD44 has been indicated to be associatied with HCC susceptibility, interactions with environmental risk factors as well as clinicopathologic statuses, the progressive genomic changes of which are capable of causing the cellular phenotype of HCC from preneoplastic stage to progress.Citation23 Previous reports introduced CD44 together with CD133, EpCAM was observed to be the most frequent tumor-initiating cell marker. In addition, recent studies suggested CSCs are highly connected to the EMT phenotype and poor prognosis of HCC patients.Citation21 Thus, the CSC population is important for driving pathogenesis. Interestingly, the results of our study showed that the stemness-related markers including CD44, CD133, and EpCAM were clearly decreased of MCL-treated HCC cell lines.
MCL has a variety of roles in cell fate determination, such as apoptosis and cell-cycle arrest. It has been reported that MCL inhibits gastric cancer growth in vitro and in vivo via blockade of the IL-6/STAT3 pathway.Citation24 Tong et al. found thatMCL induced apoptosis in breast cancer cells with mitochondrial fission and upregulation of Drp1 protein.Citation11 In our results, we found that MCL is more effective for apoptosis than cell cycle and this induction of apoptosis is ROS-dependent. Probably, the source of ROS accumulated in the liver cancer cell treated with MCL treatment is mitochondria, as mitochondrial ROS is quickly increased by MCL treatment. Notably, this explanation based on ROS-apoptosis is common for anti-cancer drugs. For example, early studies have demonstrated that anti-cancer agents could increase intracellular ROS as well as mitochondrial ROS levels.Citation25,Citation26 Qu et al. previously reported that reduced anti-oxidant capacity and increased intracellular ROS, especially mitochondrial ROS, were involved in improving drug susceptibility.
Although we need to study the detail, impaired actin cytoskeleton in MCL-treated liver cancer cells may be in part involved in mitochondrial aggregation and ROS accumulation. Notably, we found that perturbation of F-actin was observed before the cell apoptosis triggered by MCL, which is consistent with a previous report in the context of apoptosis triggered by the F-actin reorganization.Citation27 Also, the actin cytoskeleton interacts with mitochondria to impact mitochondrial morphology, movement, and intracellular distribution. Mutations in actin-related proteins can impact the mitochondrial physiology, triggering cell death. Consistently, we found that mitochondria were aggregated with destructured F-actin fibers in the liver cancer cell after MCL treatment. We suspected that the MCL-related influence on the interaction between the actin cytoskeleton and mitochondria is involved in ROS accumulation as in a previous report that decreased actin dynamics causes an increase in ROS production, resulting in cell death. In addition, accumulating evidence suggested the role of the actin cytoskeleton in mitochondrial recruitment of various pro-apoptotic proteins.Citation28 Tang et al. found the mitochondrial accumulation of β-actin was detected before the insertion of Bax and cytochrome C release. It still remains to explain how MCL affects the actin cytoskeleton.
Conclusion
In conclusion, we demonstrated that MCL inhibited the HCC cell proliferation in vitro and in vivo via the induction of apoptosis. Also, MCL was capable of reducing the stemness of HCC. As the mechanism studies, we clarified that MCL deregulated F-actin organization, leading to mitochondria dysfunction. These novel observations on liver cancer cells will be helpful not only for seeking new therapeutic drugs for liver cancer but also studying the interaction of actin structure and mitochondria physiology.
Author Contributions
All authors contributed to data analysis, drafting or revising the article, gave final approval of the version to be published, and agree to be accountable for all aspects of the work.
Disclosure
The authors report no conflicts of interest in this work.
Acknowledgments
We thank Yang Xu and Jinchul Kim for assisting in the preparation of this manuscript. The paper was supported by the National Natural Science Foundation of China (NSFC) (No. 81703092).
References
- Singh AK, Kumar R, Pandey AK. Hepatocellular carcinoma: causes, mechanism of progression and biomarkers. Curr Chem Genom Transl Med. 2018;12:9–26. doi:10.2174/221398850181201000930069430
- Ilamathi M, Santhosh S, Sivaramakrishnan V. Artesunate as an anti-cancer agent targets stat-3 and favorably suppresses hepatocellular carcinoma. Curr Top Med Chem. 2016;16(22):2453–2463. doi:10.2174/156802661666616021212282026873192
- Sun Q, Wang J, Li Y, et al. Synthesis and evaluation of cytotoxic activities of artemisinin derivatives. Chem Biol Drug Des. 2017;90(5):1019–1028. doi:10.1111/cbdd.1301628489280
- Zou X, Liang J, Sun J, et al. Allicin sensitizes hepatocellular cancer cells to anti-tumor activity of 5-fluorouracil through ROS-mediated mitochondrial pathway. J Pharmacol Sci. 2016;131(4):233–240. doi:10.1016/j.jphs.2016.04.01727177453
- Tan J, Song M, Zhou M, Hu Y. Antibiotic tigecycline enhances cisplatin activity against human hepatocellular carcinoma through inducing mitochondrial dysfunction and oxidative damage. Biochem Biophys Res Commun. 2017;483(1):17–23. doi:10.1016/j.bbrc.2017.01.02128069382
- Vilgrain V, Pereira H, Assenat E, et al. Efficacy and safety of selective internal radiotherapy with yttrium-90 resin microspheres compared with sorafenib in locally advanced and inoperable hepatocellular carcinoma (SARAH): an open-label randomised controlled phase 3 trial. Lancet Oncol. 2017;18(12):1624–1636. doi:10.1016/S1470-2045(17)30683-629107679
- He L, Yang X, Cao X, Liu F, Quan M, Cao J. Casticin induces growth suppression and cell cycle arrest through activation of FOXO3a in hepatocellular carcinoma. Oncol Rep. 2013;29(1):103–108. doi:10.3892/or.2012.207623064420
- Chaijaroenkul W, Viyanant V, Mahavorasirikul W, Na-Bangchang K. Cytotoxic activity of artemisinin derivatives against cholangiocarcinoma (CL-6) and hepatocarcinoma (Hep-G2) cell lines. Asian Pac J Cancer Prev. 2011;12(1):55–59.21517231
- Kim DG, You KR, Liu MJ, Choi YK, Won YS. GADD153-mediated anticancer effects of N-(4-hydroxyphenyl)retinamide on human hepatoma cells. J Biol Chem. 2002;277(41):38930–38938. doi:10.1074/jbc.M20594120012138118
- Gach K, Janecka A. alpha-Methylene-gamma-lactones as a novel class of anti-leukemic agents. Anticancer Agents Med Chem. 2014;14(5):688–694.24628266
- Jia Y, Zhou L, Tian C, Shi Y, Wang C, Tong Z. Dynamin-related protein 1 is involved in micheliolide-induced breast cancer cell death. Onco Targets Ther. 2015;8:3371–3381. doi:10.2147/OTT.S9180526622184
- An Y, Guo W, Li L, et al. Micheliolide derivative DMAMCL inhibits glioma cell growth in vitro and in vivo. PLoS One. 2015;10(2):e116202.
- Bommagani S, Penthala NR, Janganati V, Parkin S, Crooks PA. 13-(N,N-Di-methyl-amino)-micheliolide 0.08-hydrate. Acta Crystallogr Sect E Struct Rep Online. 2013;69(Pt 12):o1789–o1790. doi:10.1107/S1600536813030304
- Kim J, Yu L, Chen W, et al. Wild-type p53 promotes cancer metabolic switch by inducing PUMA-dependent suppression of oxidative phosphorylation. Cancer Cell. 2019;35(2):191–203. doi:10.1016/j.ccell.2018.12.01230712844
- Wang J, Sun P, Chen Y, Yao H, Novel WS. 2-phenyloxypyrimidine derivative induces apoptosis and autophagy via inhibiting PI3K pathway and activating MAPK/ERK signaling in hepatocellular carcinoma cells. Sci Rep. 2018;8(1):10923. doi:10.1038/s41598-018-29199-830026540
- Muhammad N, Steele R, Isbell TS, Philips N, Ray RB. Bitter melon extract inhibits breast cancer growth in preclinical model by inducing autophagic cell death. Oncotarget. 2017;8(39):66226–66236. doi:10.18632/oncotarget.1988729029506
- Bhattacharya S, Muhammad N, Steele R, Kornbluth J, Ray RB. Bitter melon enhances natural killer-mediated toxicity against head and neck cancer cells. Cancer Prev Res (Phila). 2017;10(6):337–344. doi:10.1158/1940-6207.CAPR-17-004628465362
- Bhattacharya S, Muhammad N, Steele R, Peng G, Ray RB. Immunomodulatory role of bitter melon extract in inhibition of head and neck squamous cell carcinoma growth. Oncotarget. 2016;7(22):33202–33209. doi:10.18632/oncotarget.889827120805
- Wang L, Li Y, Xu J, et al. Quantified postsurgical small cell size CTCs and EpCAM(+) circulating tumor stem cells with cytogenetic abnormalities in hepatocellular carcinoma patients determine cancer relapse. Cancer Lett. 2018;412:99–107. doi:10.1016/j.canlet.2017.10.00429031565
- Noh CK, Wang HJ, Kim CM, et al. EpCAM as a predictive marker of tumor recurrence and survival in patients who underwent surgical resection for hepatocellular carcinoma. Anticancer Res. 2018;38(7):4101–4109. doi:10.21873/anticanres.1270029970536
- Dai XM, Yang SL, Zheng XM, Chen GG, Chen J, Zhang T. CD133 expression and alpha-fetoprotein levels define novel prognostic subtypes of HBV-associated hepatocellular carcinoma: a long-term follow-up analysis. Oncol Lett. 2018;15(3):2985–2991. doi:10.3892/ol.2017.770429435028
- Gao Y, Ruan B, Liu W, et al. Knockdown of CD44 inhibits the invasion and metastasis of hepatocellular carcinoma both in vitro and in vivo by reversing epithelial-mesenchymal transition. Oncotarget. 2015;6(10):7828–7837. doi:10.18632/oncotarget.348825797261
- Chou YE, Hsieh MJ, Chiou HL, Lee HL, Yang SF, Chen TY. CD44 gene polymorphisms on hepatocellular carcinoma susceptibility and clinicopathologic features. Biomed Res Int. 2014;2014:231474. doi:10.1155/2014/23147424971320
- Tang X, Ding Q, Chen C, et al. Micheliolide inhibits gastric cancer growth in vitro and in vivo via blockade of the IL-6/STAT3 pathway. Pharmazie. 2019;74(3):175–178. doi:10.1691/ph.2019.881630961685
- Li J, Wu DD, Zhang JX, et al. Mitochondrial pathway mediated by reactive oxygen species involvement in alpha-hederin-induced apoptosis in hepatocellular carcinoma cells. World J Gastroenterol. 2018;24(17):1901–1910. doi:10.3748/wjg.v24.i17.190129740205
- Lan L, Wei W, Zheng Y, et al. Deferoxamine suppresses esophageal squamous cell carcinoma cell growth via ERK1/2 mediated mitochondrial dysfunction. Cancer Lett. 2018;432:132–143. doi:10.1016/j.canlet.2018.06.01229906487
- Tang HL, Le AH, Lung HL. The increase in mitochondrial association with actin precedes bax translocation in apoptosis. Biochem J. 2006;396(1):1–5. doi:10.1042/BJ2006024116536728
- Kruppa AJ, Buss F. Actin cages isolate damaged mitochondria during mitophagy. Autophagy. 2018;14(9):1644–1645. doi:10.1080/15548627.2018.148615230058425