
Abstract
Introduction
It has been reported that lncRNA AGAP2-AS1 promotes the development of gastric cancer, lung cancer and breast cancer. This study aimed to investigate the role of AGAP2-AS1 in colon cancer.
Methods
A total of 66 patients with colon cancer were enrolled. RT-qPCR was performed to detect the differential expression of AGAP2-AS1 in tumor tissues and adjacent normal tissues. To test the interaction between AGAP2-AS1 and LINC-PINT in colon cancer, overexpression vector or inhibitor of AGAP2-AS1 and LINC-PINT were transfected into RKO and HCT 116 cells. CCK-8 assay was used to detect cell proliferation. Transwell assays were performed to evaluate cell migration and invasion. The expression of p-LATS1, p-YAP and nuclear YAP were detected by Western blot and immunofluorescence.
Results
The expression of AGAP2-AS1 was upregulated in colon cancer tissues compared with that in adjacent normal tissues, and the expression of AGAP2-AS1 in colon cancer tissues was not significantly affected by tumor stages. In addition, we found that the expression of LINC-PINT was downregulated in colon cancer tissues compared with that in adjacent normal tissues and had a reverse correlation with the expression of AGAP2-AS1 in colon cancer tissues. Moreover, overexpression of AGAP2-AS1 downregulated the expression of LINC-PINT, and overexpression of LINC-PINT also altered the expression of AGAP2-AS1 in colon cancer cells. Inhibition of AGAP2-AS1 upregulated the expression of LINC-PINT, and inhibition of LINC-PINT promoted the expression levels of AGAP2-AS1 in colon cancer cells. Furthermore, overexpression of AGAP2-AS1 could increase the proliferation, invasion and migration of colon cancer cells, while overexpression of LINC-PINT could attenuate the effects of overexpression of AGAP2-AS1 on the proliferation, migration and invasion of colon cancer cells. We also found that AGAP2-AS1 promoted colon cancer cell proliferation, migration and invasion through the Hippo signaling.
Conclusion
Upregulated expression of AGAP2-AS1 promoted proliferation, invasion and migration in colon cancer by forming a negative feedback loop with LINC-PINT.
Introduction
Colon cancer affects more than 1 million new cases every year and it is one of the major causes of cancer deaths worldwide.Citation1 Extensive efforts have been made to improve cancer diagnosis and treatment. However, survival of colon cancer patients is generally poor, especially for those at advanced stages.Citation2,Citation3 In clinical practice, about 1 out of 5 colon patients is diagnosed with the existence of cancer metastasis, in which radical therapy is applicable.Citation4 Biological target therapy, radiotherapy and chemotherapy can be used to treat advanced colon cancer patients, however, more than half of the patients die of tumor recurrence in the second year of diagnosis.Citation4,Citation5
Long (200 nt) non-coding RNAs (lncRNAs) were considered as “dark matter” or “noise” of the transcriptome without biological function.Citation6,Citation7 However, an increasing number of studies have shown that lncRNAs participate in almost all biological processes, such as cell proliferation and growth, cell differentiation and cell apoptosis through regulation of target genes.Citation8 Altered expression of lncRNAs may result in abnormal expression of disease-related genes, such as oncogenes or tumor suppressors,Citation9 indicating the potential role of lncRNAs in cancer diagnosis and therapy.Citation10 However, the functions of most lncRNAs remain unknown. It has been reported that lncRNA AGAP2-AS1 promotes the development of gastric cancer, lung cancer and breast cancer.Citation11–Citation13 However, the role of AGAP2-AS1 in colon cancer is unclear. This study was carried out to investigate the function of AGAP2-AS1 in colon cancer.
Materials and Methods
Research Subjects
A total of 66 patients with colon cancer (39 males and 27 females, 31 to 67 years old, mean age 49.8 ± 6.1 years old, ) admitted at Cancer Hospital of China Medical University from July 2015 to January 2018 were enrolled in this study. All patients were diagnosed by histopathological examinations. Inclusion criteria: 1) newly diagnosed cases; 2) no therapy was carried out before admission; 3) patients signed the informed consent. Exclusion criteria: 1) patients transferred from other institutes; 2) patients complicated with other clinical conditions besides colon cancer; 3) therapies were initiated. All patients were staged according to AJCC criteria, and there were 16, 14, 20 and 18 cases at stage I–IV, respectively. This study was approved by the Ethics Committee of the aforementioned hospital. Experiments were conducted in accordance with the Declaration of Helsinki. All patients signed the written informed consent.
Table 1 The Clinical Characteristics of Colorectal Cancer
Tissue Specimens and Cell Lines
Prior to therapy, colon biopsy was carried out under the guidance of MRI to collect tumor and adjacent (3 cm around tumors) non-tumor tissues from all patients. All tissue samples were confirmed by histopathological exams. Colon carcinoma cell lines (ATCC, USA) RKO and HCT 116 were used. Cells were cultivated in a cell culture medium composed of 10% FBS and 90% Eagle’s Minimum Essential Medium at 37 °C with 95% humidity and 5% CO2.
Cell Transfections
Full length of the genomic DNA AGAP2-AS1 or LINC-PINT was inserted into pcDNA 3.1 vector (Sangon, Shanghai, China) to construct AGAP2-AS1 or LINC-PINT expression vector. Lipofectamine 2000 (Thermo Fisher Scientific) was used to transfect 10 nM vector (empty vector was negative control, NC) into 106 cells. Untransfected cells were used as the Control (C) cells. Cells were collected at 24 h post transfection for the subsequent experiments.
Real-Time Quantitative PCR (RT-qPCR)
Total RNAs were extracted from tissues or RKO and HCT 116 cells using RNAzol reagent (Sigma-Aldrich, St. Louis, MO, USA). Total RNAs were reverse transcribed into cDNA using GoScript™ Reverse Transcription System (Promega). To detect the expression of AGAP2-AS1 and LINC-PINT, SYBR Green Master Mix (Bio-Rad) was used to prepare qPCR reaction mixtures. The expression levels of AGAP2-AS1 and LINC-PINT were normalized to 18S RNA using 2−ΔΔCT method.
Cell Proliferation Assay
Cell proliferation assay was carried out using Cell Counting Kit-8 (CCK-8), (ab228554, Abcam, Cambridge, UK) at 24 h post transfection. Briefly, cell density was adjusted to 5 × 10⁴ cells/mL. Cells were cultivated in a 96-well plate with 100 μL cell suspension per well at 37 °C with 5% CO2. CCK-8 solution (10 μL) was added at 24, 48, 72 and 96 h after the beginning of cell culture. After that, cells were cultivated for an additional 4 h and 10 μL dimethyl sulfoxide (DMSO) was added. OD values at 450 nm were measured to reflect cell proliferation abilities.
Transwell Assay
Cell migration and invasion abilities were measured by Transwell migration and invasion assays at 24 h post transfection. Briefly, 1 mL serum-free Eagle’s Minimum Essential Medium was used to resuspend cell pellets containing 3 × 10⁴ cells to make cell suspensions. The upper Transwell chamber was used to cultivate cells (0.1 mL per well) and the lower chamber was filled with a mixture of 80% Eagle’s Minimum Essential Medium and 20% FBS. Matrigel (356,234, Millipore, USA) was used to coat the membrane before the invasion assay. Cells were cultivated under the aforementioned conditions for 12 h, followed by staining the lower surface of membranes using 0.1% crystal violet (Sigma-Aldrich). Stained cells were observed under a light microscope. All groups were normalized to the C group.
Western Blot
Total proteins were isolated from cells using RIPA buffer reagent (Thermo Fisher Scientific, Inc., Waltham, MA, USA) containing protease inhibitor (Cocktail, Roche, Basel, Switzerland). The same amount (30 μg) of protein samples was separated by 10% SDS-PAGE (Mlbio, Shanghai, China) and transferred to nitrocellulose membranes (GE Healthcare, Westborough, MA). The membranes were blocked with 5% BSA at room temperature for 2 h, followed by incubation with primary antibodies: anti-p-LATS1 (1:1000, ab111344, Abcam), ANTI-LATS1 (1:1000, ab243656, Abcam), anti-p-YAP (1:1000, ab76252, Abcam), anti-YAP (1:1000, ab52771, Abcam) and anti-GAPDH (1:1000, ab8245, Abcam) at 4 °C overnight. TBST buffer was used to elute the membrane for two times. The membranes were then incubated with the secondary antibody for 2 h at 37 °C. The ECL detection system (Thermo Fisher Scientific, Waltham, MA, USA) was used to image the protein bands.
Immunofluorescence Staining
RKO and HCT 116 cells were fixed in 4% paraformaldehyde for 15 min and permeabilized in 0.1% Triton X-100 at room temperature for 20 min. Cardiomyocytes were then blocked in PBS containing 0.5% bovine serum albumin for 60 min and incubated with primary rabbit antibody against YAP (1:200, abcam) at 4 °C overnight, followed by incubation with Alexa Fluor 488-conjugated anti-rabbit IgG secondary antibody. Finally, the nuclei were stained with DAPI. Images were visualized and captured with a Leica SP8 confocal microscopy.
Nuclear/Cytoplasmic Fractionation
For nuclear YAP accumulation assay, RKO and HCT 116 cells were harvested and lysed to obtain cytoplasmic and nuclear lysates using the Keygen Nuclear-Cytosol Protein Extraction Kit from Nanjing KeyGen Biotech. Co., Ltd. (Nanjing, China). The cytoplasmic and nuclear lysates were performed with Western blotting.
Statistical Analyses
Three biological replicates were included in each experiment and mean values were used in all data analyses. Paired t-test was used to explore differences between two types of tissue. ANOVA Tukey’s test was used to compare differences among multiple patients and cell groups. Correlations were analyzed by linear regression. P < 0.05 was considered as statistically significant.
Results
AGAP2-AS1 Was Upregulated in Colon Cancer Patients but Not Affect by Clinical Stage
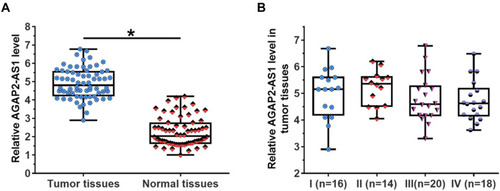
RT-qPCR was performed to detect the expression of AGAP2-AS1 in tumor and adjacent normal tissue specimens. It was observed that AGAP2-AS1 was upregulated in tumor tissues compared to that in adjacent normal tissues (, p < 0.05), indicating the upregulation of AGAP2-AS1 in colon cancer. In addition, no significant difference was observed in the expression levels of AGAP2-AS1 in tumor tissue specimens among four clinical stages ().
Figure 1 AGAP2-AS1 was upregulated in tumor tissues of colon cancer patients but was not affected by clinical stage. RT-qPCR results revealed that AGAP2-AS1 was upregulated in tumor tissues comparing to that in adjacent normal tissues (A), (*p < 0.05), and the expression levels of AGAP2-AS1 in tumor tissue specimens were not significantly affected by clinical stages (B).
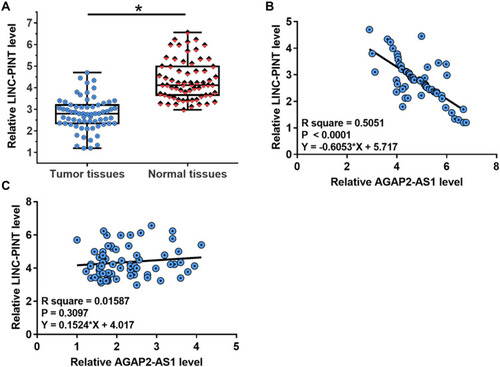
The Expression of LINC-PINT Was Inversely Correlated with the Expression of AGAP2-AS1 in Colon Cancer
The expression levels of LINC-PINT were also measured by qPCR. LINC-PINT was significantly downregulated in tumor tissues compared to that in adjacent normal tissues (, p < 0.05). In addition, correlation analysis results showed that the expression of LINC-PINT was significantly and inversely correlated with the expression of AGAP2-AS1 across tumor tissues (). However, the expression of AGAP2-AS1 and LINC-PINT were not correlated with each other in adjacent normal tissues (). Moreover, we found that the expression of AGAP2-AS1 (Supplementary Figure 1A, p = 0.26) and LINC-PINT (Supplementary Figure 1B, p = 0.046) were not correlated with the overall survival of colon cancer patients.
Figure 2 LINC-PINT was inversely correlated with AGAP2-AS1. Results of RT-qPCR revealed that LINC-PINT was significantly downregulated in tumor tissues compared with adjacent normal tissues (A) (*p < 0.05). Linear regression was performed to analyze the correlation between LINC-PINT and AGAP2-AS1 across tumor tissues (B) and normal tissues (C).
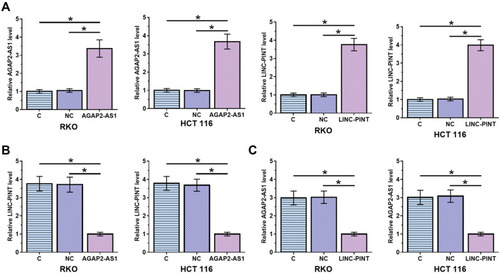
AGAP2-AS1 and LINC-PINT Downregulated Each Other in Colon Cancer Cell Lines
To analyze the interaction between AGAP2-AS1 and LINC-PINT in colon cancer, a vector expressing AGAP2-AS1 or LINC-PINT was transfected into RKO and HCT 116 cells. It was observed that, compared to the C and NC groups, AGAP2-AS1 and LINC-PINT were overexpressed at 24 h after transfection (, p < 0.05). Overexpression of AGAP2-AS1 resulted in significantly downregulated LINC-PINT (, p < 0.05). In addition, overexpression of LINC-PINT resulted in significantly downregulated AGAP2-AS1 (, p < 0.05).
Figure 3 AGAP2-AS1 and LINC-PINT downregulated each other in cells of colon cancer cell lines. RKO and HCT 116 were overexpressed in cells of both cell lines at 24 h after transfection (A). Overexpression of AGAP2-AS1 mediated the downregulation of LINC-PINT (B), while overexpression of LINC-PINT also inhibited the expression of AGAP2-AS1 (C), (*p < 0.05).
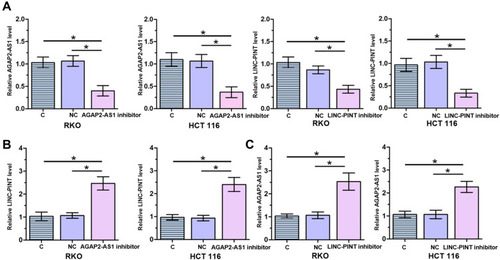
AGAP2-AS1 and LINC-PINT Inhibitor Upregulated Each Other in Cells of Colon Cancer Cell Lines
To further test the interaction between AGAP2-AS1 and LINC-PINT in colon cancer, AGAP2-AS1 or LINC-PINT inhibitor was transfected into RKO and HCT 116 cells. Compared to the C and NC groups, the expression of AGAP2-AS1 and LINC-PINT were inhibited at 24 h after transfection (, p < 0.05). Inhibition of AGAP2-AS1 significantly upregulated LINC-PINT (, p < 0.05). In addition, inhibition of LINC-PINT significantly upregulated AGAP2-AS1 (, p < 0.05).
Figure 4 AGAP2-AS1 and LINC-PINT upregulated each other in cells of colon cancer cell lines. RKO and HCT 116 were inhibited in cells of both cell lines at 24 h after transfection (A). AGAP2-AS1 inhibitor mediated the upregulation of LINC-PINT (B), while LINC-PINT inhibitor also upregulated the expression of AGAP2-AS1 (C), (*p < 0.05).
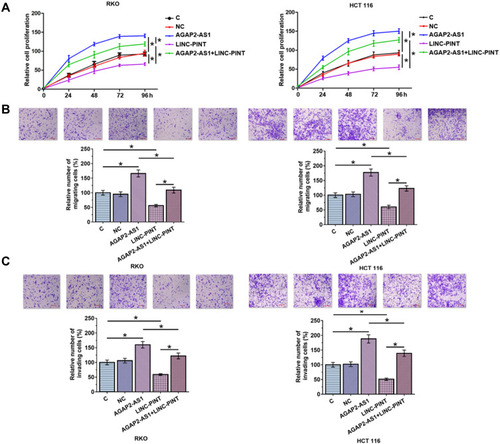
AGAP2-AS1 and LINC-PINT Regulate Colon Cancer Cell Proliferation, Migration and Invasion
Next, the role of AGAP2-AS1 and LINC-PINT in colon cancer cell proliferation, migration and invasion was investigated. Overexpression of AGAP2-AS1 and LINC-PINT were verified (, p < 0.05). Cell proliferation was detected by CCK-8 assay. Overexpression of AGAP2-AS1 increased the cell proliferation rate, while overexpression of AGAP2-AS1 and LINC-PINT together decreased the cell proliferation rate compared with the overexpression of AGAP2-AS1 alone, and increased the cell proliferation rate compared with the overexpression of LINC-PINT alone in RKO and HCT 116 cells (, p < 0.05). In addition, Transwell assay showed that AGAP2-AS1 promoted cell migration and invasion, while LINC-PINT had the opposite effect on RKO and HCT 116 cells. Moreover, cells with the overexpression of both AGAP2-AS1 and LINC-PINT showed significantly inhibited migration and invasion compared with the overexpression of AGAP2-AS1 alone, and the co-transfection also significantly promoted migration and invasion compared to cells with the overexpression of LINC-PINT alone in both RKO and HCT 116 cells (, p < 0.05).
Figure 5 AGAP2-AS1 and LINC-PINT regulated colon cancer cell proliferation, migration and invasion. Overexpression of AGAP2-AS1 increased cell proliferation, while overexpression of LINC-PINT decreased the proliferation (A) of RKO and HCT 116 cells. In addition, cells with overexpression of both AGAP2-AS1 and LINC-PINT showed significantly inhibited proliferation compared with cells with overexpression of AGAP2-AS1 alone, and the co-transfection significantly promoted proliferation compared with cells with overexpression of LINC-PINT alone. Overexpression of AGAP2-AS1 increased cell migration and invasion, while overexpression of LINC-PINT decreased the migration (B) and invasion (C) of RKO and HCT 116 cells. In addition, cells with overexpression of both AGAP2-AS1 and LINC-PINT showed significantly inhibited migration and invasion compared with cells with overexpression of AGAP2-AS1 alone, and the co-transfection significantly promoted migration and invasion compared with cells with overexpression of LINC-PINT alone. Scale bars, 100 μm. (*p < 0.05).
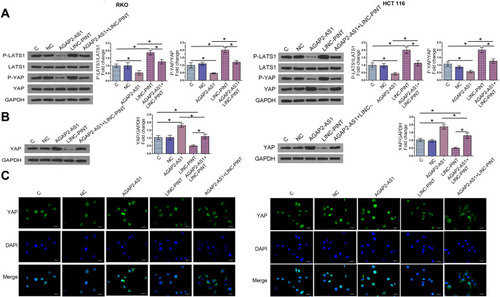
AGAP2-AS1 Promoted Colon Cancer Cell Proliferation, Migration and Invasion Through the Hippo Signaling
The Hippo signaling pathway plays a key role in cancer progression. The involvement of the Hippo signaling pathway was tested in colon cancer cell lines. Immunoblotting exhibited that overexpression of AGAP2-AS1 inhibited LAST1 phosphorylation and YAP reduction in RKO and HCT 116 cells (, p < 0.05). In addition, overexpression of AGAP2-AS1 resulted in decreased nuclear expression of YAP, indicated by immunofluorescence and nuclei-cytoplasm fractionation in RKO and HCT 116 cells. Moreover, all the effects of AGAP2-AS1 on the Hippo signaling pathway were almost abolished by overexpression of LINC-PINT (, p < 0.05).
Figure 6 AGAP2-AS1 promoted proliferation, migration and invasion of colon cancer cell through Hippo signaling. Western blot analysis showed that overexpression of AGAP2-AS1 led to the decrease of p-Yap/Yap, p-LATS1/LATS1, while overexpression of LINC-PINT led to promoted expression of p-Yap/Yap, p-LATS1/LATS1 in RKO and HCT 116 cell lines (A). In addition, overexpression of AGAP2-AS1 attenuated the effects of overexpression of LINC-PINT on protein level. Overexpression of LINC-PINT attenuated the effects of overexpression of AGAP2-AS1 on protein level. Cell nucleus/cytoplasm fractionation and Western blot analysis to show the YAP translocation in RKO and HCT 116 cell lines (B). Immunofluorescence assays showed the localization of YAP after overexpressed with AGAP2-AS1 or LINC-PINT in RKO and HCT 116 cell lines (C). Scale bars, 30 μm (*p < 0.05).
Discussion
AGAP2-AS1 has been reported to promote the development and progression of several cancers.Citation11–Citation13 The role of AGAP2-AS1 in colon cancer is unknown. Our study is the first to report the oncogenic function of AGAP2-AS1 in colon cancer and we also proved that the function of AGAP2-AS1 in colon cancer is likely achieved through the interaction with tumor suppressor LINC-PINT.
A recent large-scale expressional and functional study has revealed that LINC-PINT, a p53-regulated lncRNA, is downregulated in many types of cancer including colon cancer,Citation14 and LINC-PINT may inhibit tumor cell invasion to suppress cancer development.Citation14 Another study reported that reduced expression levels of LINC-PINT could serve as potential prognostic and diagnostic biomarkers for pancreatic cancer.Citation15 We also observed downregulated expression of LINC-PINT in colon cancer tissues compared to that in adjacent normal tissues. In addition, overexpression of LINC-PINT resulted in decreased proliferation, migration and invasion of colon cancer cells. Therefore, our study confirmed the oncogenic role of LINC-PINT in colon cancer.
A conserved sequence of LINC-PINT mediates its interaction with PRC2, which is a key player in cancer cell invasion, to suppress the invasive phenotype of cancer cells.Citation16 It is known that lncRNAs cancer interacts with tumor-suppressive or oncogenic pathways to participate in cancer biology.Citation17 Interestingly, our study proved that LINC-PINT and AGAP2-AS1 can form a negative feedback regulation loop to participate in the regulation of colon cancer cell proliferation, migration and invasion.
AGAP2-AS1 and LINC-PINT interact with multiple oncogenic or tumor-suppressive factors. AGAP2-AS1 is upregulated in lung cancer and can interact with EZH2 and LSD1 to suppress the expression of LATS2 and KLF2, thereby promoting tumor growth.Citation11 In gastric cancer, SP1 activates AGAP2-AS1 to increase cancer cell migration and proliferation.Citation12 In breast cancer, overexpression of AGAP2-AS1 regulates the methylation of MyD88 to promote the development of chemoresistance.Citation13 In contrast, LINC-PINT is downregulated in many cancers and interacts with PRC2 through a highly conserved sequence element to inhibit tumor cell invasion.Citation14 Therefore, AGAP2-AS1 and LINC-PINT may form a complex gene expression regulation network to regulate the development and progression of colon cancer. More studies are needed to identify other players in this process.
It was reported that Hippo signaling pathway exerts an important role in cancer. Yes-associated protein (YAP), a downstream regulator of the Hippo pathway, is upregulated in cancers and is involved in proliferation, apoptosis, migration, invasion.Citation18 The decreased phosphorylation level of LATS1, YAP was found after the overexpression of AGAP2-AS1, while LINC-PINT has the opposite effect. Furthermore, overexpression of AGAP2-AS1 improved the YAP translocation, while LINC-PINT decreased the nuclear level of YAP. These data demonstrated that the Hippo signaling pathway is required for the proliferation, migration and invasion effects of AGAP2-AS1.
Conclusion
In conclusion, AGAP2-AS1 is an oncogene, and LINC-PINT is a tumor suppressor in colon cancer. AGAP2-AS1 and LINC-PINT may form a negative feedback regulation loop to participate in colon cancer.
Disclosure
The authors declare that they have no conflicts of interest.
References
- Siegel RL, Miller KD, Jemal A. Cancer statistics, 2017. CA Cancer J Clin. 2017;67(1):7–30. doi:10.3322/caac.2138728055103
- Lemmens V, van Steenbergen L, Janssen-Heijnen M, Martijn H, Rutten H, Coebergh JW. Trends in colorectal cancer in the south of the Netherlands 1975–2007: rectal cancer survival levels with colon cancer survival. Acta Oncol. 2010;49(6):784–796. doi:10.3109/0284186100373371320429731
- De Angelis R, Sant M, Coleman MP, et al. Cancer survival in Europe 1999–2007 by country and age: results of EUROCARE–5-a population-based study. Lancet Oncol. 2014;15(1):23–34. doi:10.1016/S1470-2045(13)70546-124314615
- Hurwitz H, Fehrenbacher L, Novotny W, et al. Bevacizumab plus irinotecan, fluorouracil, and leucovorin for metastatic colorectal cancer. N Engl J Med. 2004;350(23):2335–2342. doi:10.1056/NEJMoa03269115175435
- Knoop K, Schwenk N, Schmohl K, et al. Mesenchymal stem cell-mediated, tumor stroma-targeted radioiodine therapy of metastatic colon cancer using the sodium iodide symporter as theranostic gene. J Nucl Med. 2015;56(4):600–606. doi:10.2967/jnumed.114.14666225745085
- Mercer TR, Dinger ME, Mattick JS. Long non-coding RNAs: insights into functions. Nat Rev Genet. 2009;10(3):155–159. doi:10.1038/nrg252119188922
- Hauptman N, Glavac D. Long non-coding RNA in cancer. Int J Mol Sci. 2013;14:4655–4669. doi:10.3390/ijms1403465523443164
- Gibb E, Brown C, Lam W. The functional role of long non-coding RNA in human carcinomas. Mol Cancer. 2011;10. doi:10.1186/1476-4598-10-3821276221
- Gutschner T, Diederichs S. The hallmarks of cancer. RNA Biol. 2012;9(6):703–719. doi:10.4161/rna.2048122664915
- Qi P, Du X. The long non-coding RNAs, a new cancer diagnostic and therapeutic gold mine. Mod Pathol. 2012;26. doi:10.1038/modpathol.2012.160
- Li W, Sun M, Zang C, et al. Upregulated long non-coding RNA AGAP2-AS1 represses LATS2 and KLF2 expression through interacting with EZH2 and LSD1 in non-small-cell lung cancer cells. Cell Death Dis. 2016;7:e2225. doi:10.1038/cddis.2016.12627195672
- Qi F, Liu X, Wu H, et al. Long noncoding AGAP2-AS1 is activated by SP1 and promotes cell proliferation and invasion in gastric cancer. J Hematol Oncol. 2017;10:1–4.28049484
- Dong H, Wang W, Mo S, et al. SP1-induced lncRNA AGAP2-AS1 expression promotes chemoresistance of breast cancer by epigenetic regulation of MyD88. J Exp Clin Cancer Res. 2018;37:1–5.29301578
- Marín-Béjar O, Mas A, González J, et al. The human lncRNA LINC-PINT inhibits tumor cell invasion through a highly conserved sequence element. Genome Biol. 2017;18. doi:10.1186/s13059-017-1331-y
- Li L, Zhang G-Q, Chen H, et al. Plasma and tumor levels of Linc-pint are diagnostic and prognostic biomarkers for pancreatic cancer. Oncotarget. 2016;7:71773.27708234
- Hu P, Chu J, Wu Y, et al. NBAT1 suppresses breast cancer metastasis by regulating DKK1 via PRC2. Oncotarget. 2015;6(32):32410–32425. doi:10.18632/oncotarget.560926378045
- Schmitt Adam M, Chang Howard Y. Long noncoding RNAs in cancer pathways. Cancer Cell. 2016;29(4):452–463. doi:10.1016/j.ccell.2016.03.01027070700
- Ma J, Fan Z, Tang Q, Xia H, Zhang T, Bi F. Aspirin attenuates YAP and β-catenin expression by promoting β-TrCP to overcome docetaxel and vinorelbine resistance in triple-negative breast cancer. Cell Death Dis. 2020;11(7):530. doi:10.1038/s41419-020-2719-232661222