
Abstract
Background
Osteosarcoma (OS) is a malignant bone tumour that exhibits a high mortality. While tumours thrive in a state of malnutrition, the mechanism by which OS cells adapt to metabolic stress through metabolic reprogramming remains unclear.
Methods
We analysed the expression of ROCK2 in osteosarcoma tissues by RT-qPCR and Western blot. Cell proliferation were analysed using CCK8, EdU and colony formation assays. The level of cell glycolysis was detected by glucose-6 phosphate, glucose consumption, lactate production and ATP levels.
Results
Herein, our study showed that ROCK2 expression in OS tissues was higher than in adjacent tissues. Functional assays have demonstrated that ROCK2 contributes to the growth of OS cells by inducing aerobic glycolysis. The current study revealed that ROCK2 knockdown decreased the levels of mitochondrial hexokinase II (HKII). And also indicated that ROCK2 served as a key enzyme in glycolysis and that it served an important role in tumour growth. A significant positive correlation was identified between the mRNA and protein expressions of ROCK2 and HKII, further demonstrating that ROCK2-induced glycolysis and proliferation was dependent on HKII expression in OS cells. Mechanistically, ROCK2 promotes HKII expression by activating the phospho-PI3K/AKT signalling pathway.
Conclusion
Taken together, the results of the current study linked the two drivers of OS growth and aerobic glycolysis and identified a new mechanism of ROCK2 control in OS.
Background
Osteosarcoma (OS) is the most common primary malignant tumour of the bone, with an incidence rate of ~1–3% worldwide.Citation1 And it’s particularly common in children and adolescents, followed by individuals over 50 years of age.Citation2 OS often occurs in the long bones of the limbs near the growth plate at the end of metaphyseal plateCitation3 and is composed of malignant osteoblasts that produce immature bone or osteoid tissue. Histologically, the cell types can be subdivided into conventional, low-grade central, periosteal, parotid gland cells, telangiectasia, chondrogenic cells and small cells.Citation4,Citation5 OS is highly malignant and prone to distant metastasis at early stages. Despite the rapid development of clinical laboratory technology and surgery, the long-term survival rate of patients with OS remains low, particularly in patients with chemotherapy-resistant tumours, as evidenced by a 5-year survival rate of ~20%.Citation6,Citation7 OS treatment is limited by a lack of understanding regarding the mechanism behind OS recombination and metabolism in a unique tumour microenvironment. Therefore, studies assessing the regulatory metabolic targets of OS are urgently required, and insight into this molecular mechanism may reveal novel therapies and approaches that may improve the prognosis of patients.
Rho-associated coiled-coil-containing protein kinase 2 (ROCK2) is a downstream effector of the Rho subfamily of small GTPases.Citation8 They are activated following interaction with Rho GTPases and regulate the actin cytoskeleton through a series of pathways that regulate cell migration, cell adhesion and tumour cell invasion.Citation9 Study have shown that ROCK2 could regulate the contraction, adhesion, migration, proliferation and apoptosis of tumour cells.Citation10 Previous studies have also determined that ROCK2 is highly expressed in various types of tumours, including liver,Citation11 breast,Citation12 prostateCitation13 and lung cancer,Citation14 and that high expression of ROCK2 is closely associated with poor prognosis. Overexpression of ROCK2 enhances tumour growth, while ROCK2 silencing markedly inhibits tumour growth in many types of cancer.Citation15 In addition, studies have also reported that ROCK2 acts as a protein kinase, increasing the phosphorylation of substrate proteins.Citation16,Citation17 Although current studies have confirmed the increased expression of ROCK2 in osteosarcoma tissues, the mechanism by which it regulates osteosarcoma growth has not been fully elucidated. Therefore, it is extremely important to elucidate the molecular mechanism of ROCK2 in osteosarcoma.
Aerobic glycolysis, also known as the Warburg effect, is an important feature of cancer and is characterized by an increase in glucose conversion to lactic acid, independent of oxygen.Citation18 The Warburg effect allows tumour cells to metabolise glucose to a greater extent than normal cells, providing an energy source for tumour cell growth. Glycolysis provides sufficient energy for tumour cells, which enhances the tolerance of cells to ischemia and hypoxia, allows cells to avoid apoptosis caused by the inhibition of oxidative phosphorylation and allows tumour cells to synthesize cellular constituents during rapid growth.Citation19–Citation21 Metabolism provides a rich source of material and growing evidence has indicated that aerobic glycolysis serves a critical role in the proliferation of OS cells.Citation22,Citation23 The rate-limiting enzyme in glycolysis is hexokinase II, which encodes a rate-limiting gluconeogenesis enzyme that has been reported to serve a tumour-promoting effect in many types of cancer.Citation24–Citation26 HKII overexpression is associated with poor prognosis in patients with cancer.Citation27 However, the underlying mechanism of HKII regulation in OS remains unclear. In addition, previous studies have confirmed that ROCK2 affects the glycolysis of tumour cells,Citation28 And our previous research have confirmed that ROCK2 can stabilize the expression of glycolytic rate-limiting enzyme PFKFB3, however, we have not explored the effect of ROCK2 on glycolysis in osteosarcoma, which is congruent to the results of the present study, which demonstrated that ROCK2 and HKII expression was increased in OS. The current study hypothesized that ROCK2 may affect the aerobic glycolysis of OS by regulating the expression of HKII. Previous studies have demonstrated that the HKII protein can be activated by the PI3K/AKT signalling pathwayCitation29 and other studies have reported that ROCK2 affects the phosphorylation of substrate proteins.Citation17 Therefore, the current study speculated that ROCK2 promoted HKII expression by activating PI3K/AKT signalling via phosphorylation.
The present study revealed the expression level of ROCK2 in patients with OS, indicating that ROCK2 affected the level of glycolysis and growth in OS cells by promoting the expression of HKII. In addition, ROCK2 was demonstrated to further regulate HKII expression by activating the phospho-PI3K/AKT signalling pathway. In summary, the results of the present study may provide new targets for the treatment of patients with OS.
Materials and Methods
Tissue Samples
A total of 43 OS samples and adjacent specimens were obtained from the Second Affiliated Hospital of Nanchang University and the Jiangxi Cancer Hospital (). A pathologist diagnosed all specimens as OS and samples were frozen and stored at −80°C for until further analysis. The study protocol was approved by the Medical Ethics Committee of Second Affiliated Hospital of Nanchang University. This study was performed in accordance with the ethical standards of the Declaration of Helsinki.
Table 1 Correlation Between ROCK2 Expression and the Clini-Copathological Characteristics of the Osteosarcoma Patients
Cell Lines and Cell Culture
Human osteosarcoma cells (U2-OS, Saos-2, 143B and MG-63) and the normal cell line, hfoBI-19, were purchased from The Cell Bank of Type Culture Collection of the Chinese Academy of Sciences. Cells were cultured in 10% FBS (Gibco, Grand Island, NY, USA) and maintained at 37°C with 5% CO2. Medium was changed every 1–2 days, and cells were plated at 80–90% confluency for a 1:3 passage.
Reverse Transcription-Quantitative PCR (RT-qPCR), Western Blotting and Co-Immunoprecipitation
RT-qPCR, Western blotting and co-immunoprecipitation (Co-IP) were performed as previously described.Citation9 The primer sequences for PCR were as follows: ROCK2 forward, 5ʹ-GGTATCTGTACATGGTAATGG-3ʹ and reverse, 5ʹ-GGAGTGTATTGCATCCAGAG-3ʹ; HKII forward, 5ʹ-GGCAATGAAACCAAAGCCAGGAG-3ʹ and reverse, 5ʹ-GGAAGGAGGAGCCAGAAGC-3ʹ; GAPDH forward, 5ʹ-CCTGCCGGTGACTAACCCTG-3ʹ and reverse, 5ʹ-AGTTAAAAGCAGCCCTGGTG-3ʹ. The antibodies of Western blot were as follow: ROCK2 (Abcam 1:1000 dilution), HKII (Abcam 1:1000 dilution), BCL-2 (Abcam 1:2000 dilution), BAX (Abcam 1:2500 dilution), AKT/P-AKT (Abcam 1:500 dilution) PI3K/P-PI3K (Abcam 1:1000 dilution), GAPDH (Abcam 1:5000 dilution).
Immunohistochemistry (IHC)
OS and adjacent tissues were fixed in paraffin, sectioned, deparaffinized and blocked using 5% bovine serum albumin for 30 min. Sections were then incubated with anti-ROCK2 (1:200; Abcam) and anti-HKII (1:200; Abcam) antibodies. Secondary antibodies were subsequently applied for visualization. ROCK2 and HKII are graded according to the staining intensity, and the positive intensity is determined according to the percentage of positive cells in the total cells.
Short Interfering (sh)RNA Plasmids and Construct
Plasmids encoding shRNA against ROCK2 and HKII were synthesized by Shanghai GenePharma Co., Ltd. Vectors and pcDNA3.1(+)-ROCK2 and HKII were also obtained from Shanghai GenePharma Co., Ltd. OS cells were transfected with shRNA plasmids, pcDNA3.1(+)-ROCK2 and HKII using Lipofectamine® 3000 (Invitrogen; Thermo Fisher Scientific, Inc.) in accordance with the manufacturer’s protocol.
Cell Growth Assays
Following trypsinization, OS cell lines were seeded (1.0x10⁴ cells/well) into 96-well plates with different treatment factors and counted. After a specified length of time, cell growth was assessed under different processing factors using a cell counting kit (CCK8) assay in accordance with the manufacturer’s protocol. An EdU assay was performed as previously described.Citation30
Oxygen Consumption Rate (OCR) and Extracellular Acidification Rate (ECAR)
The Extracellular Flow Analyzer XF96 (Seahorse Bioscience) was used to measure cell glycolysis. Cell mitochondrial respiration was determined using the XF Cell Mitosis Stress Test kit and the Glycolysis Stress Test kit (each, Seahorse Bioscience), respectively. Each assay was performed according to the manufacturer’s protocol.
Tumourigenicity Assay
All animal experiments were approved by the Animal Experiment Ethics Committee of Nanchang University. A total of 1x10⁷ OS cells in 100 ul PBS were counted following trypsinization and injected into the dorsal side of nude mice (male BALB/c-nu/nu; age, 5 weeks). After tumour formation, mice were observed every 5 days. Tumour volumes were measured for 35 days. After anaesthesia, tumour tissues from each group were collected and weighed, after which they were fixed in 4% neutral paraformaldehyde for subsequent experimentation. All animal experiments were approved by the Animal Experimental Ethics Committee of the Second Affiliated Hospital of Nanchang University and was performed in accordance with the “Guide for the Care and Use of Laboratory Animals” (revised 1985).
Statistical Analysis
All data obtained from the current study were expressed as the mean ± standard deviation and analysed using GraphPad Prism 7 and SPSS 19.0 software following at least 3 independent repeats. Differences between two groups were analyzed using t-tests or Student’s t-tests, Multiple groups comparisons were performed with the one-way analysis of variance (ANOVA), and the post hoc test was Student-Newman-Keuls test. P<0.05 was considered to indicate a statistically significant difference.
Results
ROCK2 is Upregulated in OS Tissue and Cells
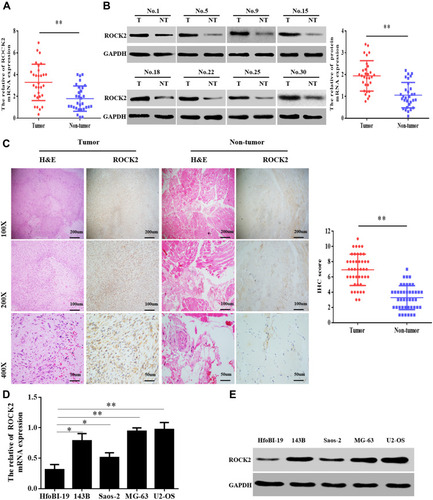
To clarify the role of ROCK2 in the development of OS, ROCK2 expression was detected in OS and corresponding adjacent tissues. Following RT-qPCR and Western blotting, the mRNA and protein levels of ROCK2 were revealed in tumour tissue (). IHC was subsequently performed, the results of which revealed an increased expression of ROCK2 in cancer tissue. As shown in , ROCK2 was overexpressed in 72.09% (31/43) of all OS tissues examined, while weak positive staining was observed in corresponding adjacent non-tumour tissues. The expression of ROCK2 in OS cell lines (MG-63, 143B, U2-OS, and Saos-2) and in the normal cell line, hfoBI-19, was determined. The results revealed an increased expression of ROCK2 in OS cells (). These data indicated that ROCK2 is overexpressed in OS tissue and cells.
Figure 1 ROCK2 is upregulated in OS tissue and cells. (A) RT-qPCR analysis of ROCK2 mRNA expression in 30 cases of OS and corresponding adjacent tissues. (B) Analysis of ROCK2 protein expression in OS and corresponding adjacent tissues, as determined via immunoblotting. GAPDH was used as a loading control. (C) Representative images of ROCK2 staining in 43 paired OS tissues (scale bar, 50 μm). (D and E) ROCK2 expression in OS cells (U2-OS, Saos-2, 143B and MG-63) and normal hfoBI-19 cells was detected via RT-qPCR and Western blotting. GAPDH was used as a loading control. *P<0.05, **P<0.01.
ROCK2 Promotes the Growth of OS in vitro and in vivo
To further explore the functional role of ROCK2 in OS, the shRNA was used to knockdown the expression of ROCK2 in U2OS and MG-63 OS cells (; Supplementary Figure. S1). As present in – and Supplementary Figure. S4 A–B, the results of the CCK8 and EdU assays revealed that ROCK2 downregulation significantly inhibited the growth of OS cells in vitro. Additionally, a colony formation assay was performed to detect OS cell clones in shROCK2- and shNC-treated cells (). The results of flow cytometry demonstrated a significant increase in apoptosis following ROCK2 downregulation ( and Supplementary Figure. S4 C). Additionally, the expression of B-cell lymphoma-2 (Bcl-2) and Bcl-2-associated protein X was analysed via Western blotting (Supplementary Figure. S2). The expression of ROCK2 following ROCK2 overexpression was subsequently evaluated (). As present in – and Supplementary Figure. S5 A–B, OS cell proliferation was significantly increased in P-ROCK2 cells. Consistent with the aforementioned results, the colony formation assay revealed that ROCK2 overexpression increased OS cell growth (). Furthermore, the results of flow cytometry indicated a significant decrease in apoptosis following ROCK2 upregulation ( and Supplementary Figure. S5 C).
Figure 2 Knockdown of ROCK2 expression inhibits OS growth in vitro and in vivo. (A) mRNA and (B) protein levels of ROCK2 in U2-OS and MG-63 cells following transfection with shROCK2-1, shROCK2-2 and shNC (control) were determined via reverse transcription-quantitative PCR and Western blotting. (C) Cell counting kit 8 and (D) EdU assays demonstrated a decrease in shROCK2-transfected OS cell (U2-OS and MG-63) growth compared with shNC-transfected cells (scale bars:100μM). (E) Representative images of the colony formation assay performed using OS cells transfected with shROCK2 or shNC. (F) Flow cytometry analysis of OS cell apoptosis following ROCK2 silencing. (G–I) shROCK2/U2-OS and shNC/U2-OS cells were subcutaneously injected into nude mice, after which tumour volumes were measured on the indicated days. At the endpoint, tumours were dissected, imaged and weighed (n=5). *P<0.05, **P<0.01 and ***P<0.001.
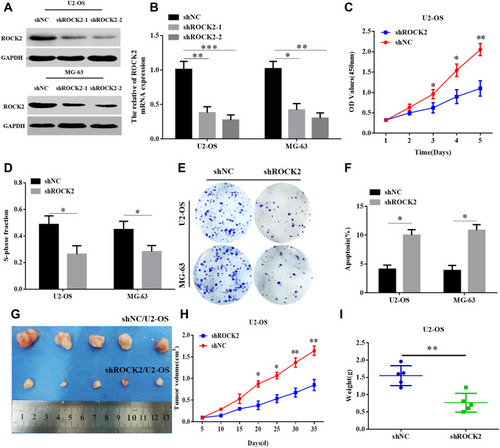
Figure 3 Overexpression of ROCK2 promotes the growth of OS in vitro and in vivo. (A and B) Saos-2 and 143B OS cell lines were transfected with pcDNA3.1(+)-ROCK2 and vectors. ROCK2 mRNA and protein expressions were subsequently determined via reverse transcription-quantitative PCR and Western blotting, respectively. Following ROCK2 overexpression, (C) CCK8 and (D) EdU assays confirmed that the proliferation of OS cells was significantly increased (scale bars:100μM). (E) Representative images obtained from the colony formation assay of OS cells transfected with p-ROCK2 and vectors. (F) following ROCK2 overexpression, flow cytometry was performed to determine the apoptosis rate of OS cells. (G–I), p-ROCK2/143B and vector/143B cells were subcutaneously injected into nude mice, and tumour volumes were measured on the indicated days. At the endpoint, tumours were dissected, imaged and weighed (n=5). *P<0.05 and **P<0.01.
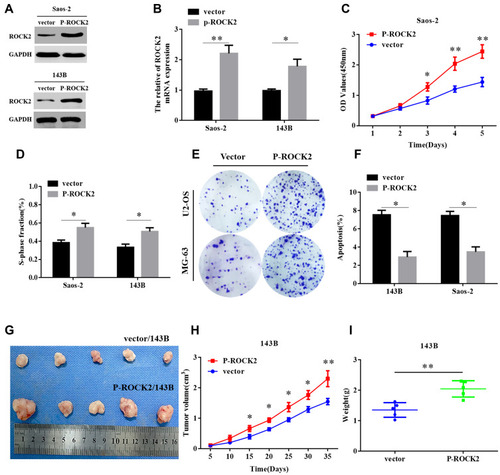
To confirm the role of ROCK2 in tumour formation in vivo, OS cells (U2-OS and 143B) were over- and under-expressed with ROCK2. The effect of ROCK2 on tumour formation in nude mice was subsequently established. After 5 weeks of growth, ROCK2-knockdown U2-OS cells (U2-OS/shROCK2) exhibited reduced tumour growth in nude mice (). Consistent with this result, the average tumour weights of mice bearing U2-OS/shROCK2 cells were significantly decreased (), and the expression of Ki-67 was also decreased in ROCK2-knockdown group (Supplementary Figure. S3), while ROCK2-overexpressing 143B cells (143B/p-ROCK2) resulted in significantly increased tumour growth compared with respective control cells (). Tumours in mice bearing 143B/p-ROCK2 cells were markedly increased in size compared with those of their respective controls (). In summary, these data indicated that ROCK2 regulated the growth of OS in vivo and in vitro.
ROCK2 Affects the Level of Glycolysis in OS Cells
Given that aerobic glycolysis is indicative of changes to cellular metabolism, this shift is ubiquitous in tumour cells. Therefore, the current study investigated whether ROCK2 affected the metabolism OS cells. As presented in –, glucose-6 phosphate levels, glucose consumption, lactate production and ATP levels were all significantly reduced in OS cells where ROCK2 expression was downregulated. In contrast, ROCK2 overexpression produced the opposite affects in Saos-2 cells (–).
Figure 4 ROCK2 affects the level of glycolysis in OS cells. (A) Cellular G6P levels, (B) glucose consumption, (C) lactate production and (D) ATP levels were analysed in shROCK2 and shNC-treated cells. (E–H) Cellular G6P levels, glucose consumption, lactate production and ATP levels were analysed in OS cells after transfection with p-ROCK2 or vectors. Extracellular acidification rate data revealed the glycolytic rate and capacity in (I) shROCK2 or (J) p-ROCK2 cells. Glucose (10 mM), the oxidative phosphorylation inhibitor oligomycin (1 µM) and the glycolytic inhibitor 2-deoxyglucose (50 mM) were sequentially added to each well at the indicated time point. All measurements were normalized to the cell number calculated using crystal violet at the end of the experiment. Oxygen consumption rate results revealed the basal respiration and maximum respiration of (K) shROCK2 cells and (L) p-ROCK2 cells. Oligomycin (1 µM), the mitochondrial uncoupler carbonyl cyanide p-trifluoromethoxy phenylhydrazone (1.0 µM) and the mitochondrial complex I inhibitor rotenone in addition to the mitochondrial complex III inhibitor antimycin A (0.5 µM) were sequentially added. All measurements were normalized to the cell number calculated using crystal violet at the end of the experiment. *P<0.05 and **P<0.01.
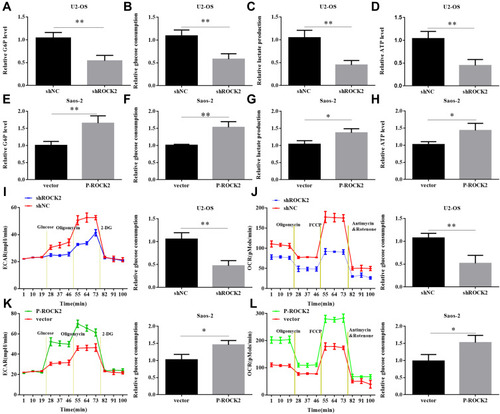
To further confirm the role of ROCK2 in the glycolytic hydrolysis of OS, OS cell glycolysis was determined via ECAR. As presented in , ROCK2 knockdown significantly decreased the glycolytic rate and capacity of U2-OS cells, whereas ROCK2 overexpression increased ECAR in Saos-2 cells (). The current study assessed OCR, an indicator of mitochondrial respiration. The results revealed that U2-OS/shROCK2 cells exhibited an increased OCR (), whereas ROCK2 overexpression produced the opposite effect in Saos-2 cells (). In summary, the results indicated that ROCK2 may promote aerobic glycolysis and inhibit mitochondrial respiration in OS cells.
ROCK2 Positively Regulates HKII Expression
Hexokinase, a key enzyme in glycolysis, has been revealed to serve a crucial role in the regulation of glycolysis. Among the enzymes that participate in glycolysis, HKII is of particularly importance. Previous studies have confirmed that HKII is upregulated in liver,Citation31 colorectalCitation32 and lung cancer.Citation33 Since HKII is closely associated with the proliferation of tumour cells and in order to confirm the expression of HKII in OS, the current study detected the expression of HKII in OS tissues via RT-qPCR and Western blotting (–). The results of IHC confirmed the increased expression of HKII in OS (). Scatter plots revealed that ROCK2 and HKII mRNA and protein levels were positively correlated with OS tissues (). The expression of HKII in OS cells was further confirmed via RT-qPCR and Western blotting (–).
Figure 5 ROCK2 positively regulates HKII protein levels. (A–C) RT-qPCR and Western blot analysis were performed to detect the mRNA and protein expression of HKII in 30 patients with OS and their corresponding adjacent tissues, respectively. (D and E) Scatter plots of ROCK2 and HKII mRNA and protein expression in OS tissue. (F) Representative images of HKII staining in 43 paired OS tissues (scale bar, 50 μm). (G) RT-qPCR and (H) Western blotting were performed to detect the mRNA and protein expression of HKII, respectively, in OS cells (U2-OS, Saos-2, 143B and MG-63) and normal hfoBI-19 cells. (I) Western blotting and (J) RT-qPCR analyses of HKII levels in U2-OS cells stably transfected with shNC or shROCK2 plasmids and in Saos-2 cells stably transfected with the vector or p-ROCK2 plasmid. *P<0.05 and **P<0.01.
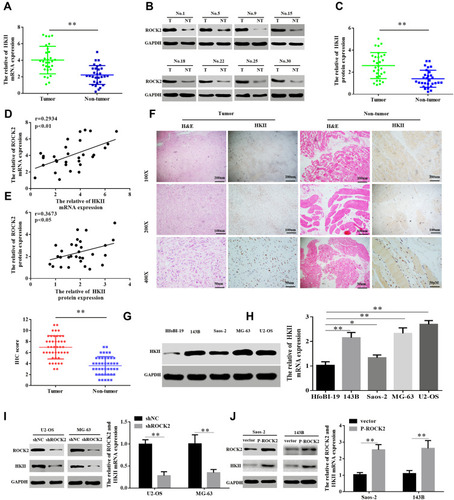
To verify whether ROCK2 regulates HKII expression, ROCK2 was up- and down-regulated in OS cells, the results of which demonstrated that ROCK2 knockdown significantly reduced the mRNA and protein expression of HKII in U2-OS and MG-63 cells. In contrast, ROCK2 overexpression significantly increased HKII protein and mRNA levels in Saos-2 and 143B cells (). Taken together, these results indicated that ROCK2 positively regulates the expression of HKII in OS cells.
ROCK2 Regulates Glycolysis and Cell Proliferation Depending on the Expression of HKII
As aforementioned, HKII was determined to be a downstream gene of glycolysis. The current study therefore upregulated the expression of HKII in U2-OS cells that were previously treated to knockdown ROCK2. Successful HKII overexpression was confirmed via immunoblotting (). The results of CCK8 and EdU assays revealed that HKII overexpression restored the proliferation of shROCK2-treated cells (– and Supplementary Figure. S6 A). The results also demonstrated that HKII overexpression restored glucose-6 phosphate levels, glucose consumption, lactate production and ATP levels in shROCK2-treated cells (–).
Figure 6 ROCK2 regulates glycolysis and cell proliferation depending on the expression of HKII. (A) Western blotting was performed to detect the expression of ROCK2 and HKII in P-HKII-transfected shROCK2/U2-OS cells. (B) Cell counting kit 8 and (C) EdU results demonstrated the proliferation of U2-OS shROCK2 cells stably transfected with P-HKII. (D) Cellular G6P levels, (E) glucose consumption, (F) lactate production and (G) ATP levels in P-HKII-transfected U2-OS shROCK2 cells. (H) Western blotting was performed to detect ROCK2 and HKII expression in p-ROCK2-transfected Saos-2 cells in the presence or absence of shHKII treatment. (I) CCK8 and (J) EdU results demonstrated the proliferation of Saos-2 cells transfected with p-ROCK2 in the presence or absence of shHKII. (K) Cellular G6P levels, (L) glucose consumption, (M) lactate production and (N) ATP levels were detected in p-ROCK2-transfected Saos-2 cells in the presence or absence of shHKII. *P<0.05 and **P<0.01.
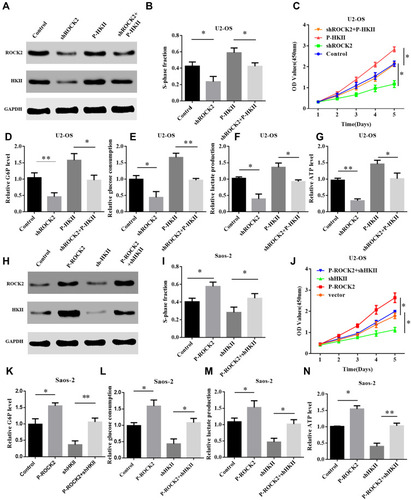
The expression of HKII was silenced in p-ROCK2 OS cells. Western blot analysis confirmed that HKII expression was increased in P-ROCK2 cells and that its expression was inhibited following HKII silencing (). Similarly, OS cell proliferation was also inhibited (– and Supplementary Figure. S6 B). Further studies confirmed that silencing HKII in P-ROCK2 inhibited glucose-6 phosphate levels, glucose consumption, lactate production and ATP levels (–). In conclusion, ROCK2 regulated glucose metabolism and proliferation in OS cells depending on the expression of HKII.
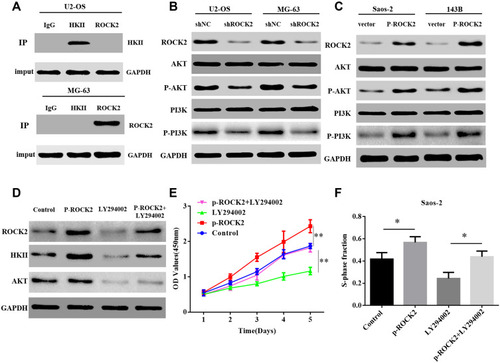
ROCK2 Regulates HKII Expression by Activating the Phosphorylated PI3K/AKT Signalling Pathway
To further investigate the mechanism by which ROCK2 regulates HKII expression, it was determined whether ROCK2 and HKII could be intrinsically bound. However, the results of Co-IP revealed no intrinsic link between them (). Additionally, it has been reported that HKII is affected by PI3K/AKT signalling pathwaysCitation29 and that AKT phosphorylates HKII at Thr-473.Citation34 Previous studies have also confirmed that ROCK2 acts as a protein kinase that affects the phosphorylation of substrate proteins.Citation16,Citation17 Therefore, the current study hypothesized that ROCK2 may promote HKII expression by activating the PI3K/AKT signalling pathway. To verify this hypothesis, ROCK2 expression was reduced and immunoblotting revealed that total AKT and PI3K levels did not change. However, levels of phosphorylated AKT and PI3K decreased significantly (). Furthermore, AKT and PI3K phosphorylation was significantly increased in cells in which ROCK2 was upregulated (). To further verify whether ROCK2 regulates the expression of HKII by activating phosphorylated PI3K/AKT and whether it affects OS growth, ROCK2 was overexpressed and OS cells were treated with the PI3K inhibitor LY294002 (10 μM). Western blot analysis confirmed that HKII expression was inhibited (). The results of the CCK8 and EdU assay also indicated that OS growth was inhibited (; Supplementary Figure. S7). The results indicated that ROCK2 activated AKT and PI3K via phosphorylation, which induced HKII expression and further promoted the growth of OS cells.
Figure 7 ROCK2 regulates HKII expression by activating the PI3K/AKT signalling pathway via phosphorylation. (A) The results of co-immunoprecipitation indicated that endogenous ROCK2 and HKII were not directly bound. (B) Western blotting was performed to determine the expression of PI3K/AKT and p-PI3K/p-AKT protein in shROCK2 or shNC cells. (C) Western blotting was additionally performed to determine PI3K/AKT and p-PI3K/p-AKT protein expression in p-ROCK2 or vector cells. (D) Western blotting was applied to analyse HKII expression in p-ROCK2 cells after the inhibition of PI3K/AKT signalling. (E) CCK8 and (F) EdU results demonstrated the proliferation of p-ROCK2 cells after PI3K/AKT signalling inhibition (scale bars:100μM). *P<0.05 and **P<0.01.
Discussion
Although the prognosis and treatment of OS has improved, patient survival rates remain poor.Citation35 Therefore, a better understanding of the biological properties of OS is essential. In recent years, the importance of metabolic reprogramming in tumorigenesis and progression has been confirmed. Metabolic reprogramming is considered one of the important features of cancer. OS seriously affects adolescent health and due to OS exhibiting varying degrees of metabolic dependence, survival rates are extremely low. Therefore, understanding the basis of OS from a metabolic perspective may provide novel insights into this disease. The current study demonstrated that ROCK2 expression was upregulated in OS and that it serves a key role in the reprogramming of glucose metabolism in this type of cancer. Therefore, studying the molecular and regulatory mechanisms of glucose metabolism reprogramming may provide more evidence for OS targeted therapy.
Members of the Rho GTPase family are important regulators of cell migration, proliferation and apoptosis.Citation10 The stimulation of contraction and adhesion is achieved by inducing the formation of actin stress fibres and focal adhesions of fibroblasts, as well as by modulating surface integrins to aggregate platelets and lymphocytes. Recent research has confirmed that ROCK2 is highly expressed in liver, colon and kidney cancer, and that its expression is closely associated with poor patient prognosis.Citation36,Citation37 And ROCK2 silencing significantly inhibits tumour cell growth and metastasis, and promotes cell apoptosis. Our previous studies have also confirmed that ROCK2 was significantly up-regulated in OS, Interestingly, our research also confirmed that after down-regulating the expression of ROCK2, its metastasis was significantly reduced in vivo and in vitro. On the contrary, after overexpression, it significantly promoted its invasion and migration (Supplementary Figure. S7). The current study revealed a novel mechanism by which OS promotes glycolysis and cell proliferation. The study confirmed that ROCK2 and HKII were upregulated in OS tissues and cells, and that these two proteins were positively correlated. Furthermore, experimental data also demonstrated that HKII expression was significantly reduced after ROCK2 expression was silenced and that aerobic glycolysis and OS cell proliferation were also inhibited. HKII upregulation via ROCK2 knockdown reversed the decrease in OS cell proliferation and aerobic glycolysis, whereas HKII downregulation significantly attenuated the increase in cell proliferation and aerobic glycolysis induced by ROCK2 overexpression. Overall, the results revealed a novel mechanism whereby ROCK2 regulates HKII and thus affects the growth and glycolysis of OS cells.
The present study evaluated the molecular mechanism by which ROCK2 regulates HKII. Since ROCK2 stabilizes the expression of substrate proteins, the results of Co-IP confirmed that ROCK2 and HKII cannot bind. However, previous studies have reported that HKII is regulated by the PI3K/AKT signalling pathway.Citation29 ROCK2 activates substrate proteins via phosphorylation. The present study silenced the expression of ROCK2 and demonstrated that total levels of PI3K and AKT did not change following treatment. In addition, the level of PI3K/AKT phosphorylation was significantly inhibited. In contrast, ROCK2 overexpression activated PI3K and AKT phosphorylation. Following ROCK2 overexpression and subsequent treatment with the PI3K inhibitor, LY294002, it was demonstrated that HKII expression was inhibited. The results revealed a novel mechanism for ROCK2 in the regulation of HKII expression via the activation of PI3K/AKT by means of phosphorylation.
Conclusions
The current study demonstrated that ROCK2 is upregulated in OS. The results also revealed that ROCK2 may promote OS cell growth and aerobic glycolysis. Furthermore, the aerobic glycolysis and proliferation of OS cells was demonstrated to rely on HKII. The results also indicated that ROCK2 activated phosphorylated PI3K/AKT and regulated HKII expression. Based on the current results, ROCK2 may be used as a potential biomarker for the future diagnosis and treatment of OS.
Abbreviations
ROCK2, Rho-associated coiled-coil-containing protein kinase 2; HKII, hexokinase II; OS, osteosarcoma; RT-qPCR, reverse transcription-quantitative PCR; shRNA, short interfering RNA; OCR, oxygen consumption rate; ECAR, extracellular acidification rate.
Data Sharing Statement
All the data in the manuscript are available upon reasonable request.
Ethics Approval and Consent to Participate
In the study, the use of human data and human tissue was clearly approved by the Ethics Committee of the Second Affiliated Hospital of Nanchang University, and informed consents were obtained from each patient. The use of All animal experiments were approved by the Animal Experimental Ethics Committee of the Second Affiliated Hospital of Nanchang University and was performed in accordance with the “Guide for the Care and Use of Laboratory Animals” (revised 1985).
Consent for Publication
Not applicable.
Author Contributions
All authors made a significant contribution to the work reported, whether that is in the conception, study design, execution, acquisition of data, analysis and interpretation, or in all these areas; took part in drafting, revising or critically reviewing the article; gave final approval of the version to be published; have agreed on the journal to which the article has been submitted; and agree to be accountable for all aspects of the work.
Disclosure
All the authors declare that they have no conflict of interest.
Acknowledgments
We thank Elsevier’s English Language Editing service for editing the manuscript.
References
- Matsuda K, Miyoshi H, Hiraoka K, et al. Elevated expression of transforming acidic coiled-coil containing protein 3 (TACC3) is associated with a poor prognosis in osteosarcoma. Clin Orthop Relat Res. 2018;476(9):1848–1855. doi:10.1097/CORR.000000000000037930024460
- Lu Y, Wang Q, Zhou Y, et al. Overexpression of p62 is associated with poor prognosis and aggressive phenotypes in osteosarcoma. Oncol Lett. 2018;15(6):9889–9895. doi:10.3892/ol.2018.857929928361
- Dekkers IA, Cleven A, Lamb HJ, Kroon HM. Primary osteosarcoma of the breast. Radiographics. 2019;39(3):626–629. doi:10.1148/rg.201918018131059400
- Li Y, Ye T, Gu Q, Dong L, Chen G, Lu S. Primary, cardiac, fibroblastic osteosarcoma: a case report. Medicine (Baltimore). 2018;97(1):e9543. doi:10.1097/MD.000000000000954329505531
- Turner H, Seguin B, Worley DR, et al. Prognosis for dogs with stage III osteosarcoma following treatment with amputation and chemotherapy with and without metastasectomy. J Am Vet Med Assoc. 2017;251(11):1293–1305. doi:10.2460/javma.251.11.129329154712
- Yu D, Zhang S, Feng A, et al. Methotrexate, doxorubicin, and cisplatinum regimen is still the preferred option for osteosarcoma chemotherapy: a meta-analysis and clinical observation. Medicine (Baltimore). 2019;98(19):e15582. doi:10.1097/MD.000000000001558231083238
- Zhang Y, Zhao H, Xu W, Jiang D, Huang L, Li L. High expression of PQBP1 and low expression of PCK2 are associated with metastasis and recurrence of osteosarcoma and unfavorable survival outcomes of the patients. J Cancer. 2019;10(9):2091–2101. doi:10.7150/jca.2848031205570
- Zaim M, Isik S. DNA topoisomerase iIbeta stimulates neurite outgrowth in neural differentiated human mesenchymal stem cells through regulation of Rho-GTPases (RhoA/Rock2 pathway) and nurr1 expression. Stem Cell Res Ther. 2018;9(1):114. doi:10.1186/s13287-018-0859-429695291
- Qiu Y, Yuan R, Zhang S, et al. Rock2 stabilizes beta-catenin to promote tumor invasion and metastasis in colorectal cancer. Biochem Biophys Res Commun. 2015;467(4):629–637. doi:10.1016/j.bbrc.2015.10.10326505794
- Loirand G, Touyz RM. Rho kinases in health and disease: from basic science to translational research. Pharmacol Rev. 2015;67(4):1074–1095. doi:10.1124/pr.115.01059526419448
- Hu K, Wang Z, Tao Y. [Suppression of hepatocellular carcinoma invasion and metastasis by Rho-kinase inhibitor Fasudil through inhibition of BTBD7-ROCK2 signaling pathway]. Zhong Nan Da Xue Xue Bao Yi Xue Ban. 2014;39(12):1221–1227. Chinese. doi:10.11817/j.issn.1672-7347.2014.12.00125544168
- Wang HF, Takenaka K, Nakanishi A, Miki Y. BRCA2 and nucleophosmin coregulate centrosome amplification and form a complex with the Rho effector kinase ROCK2. Cancer Res. 2011;71(1):68–77. doi:10.1158/0008-5472.CAN-10-003021084279
- Kroiss A, Vincent S, Decaussin-Petrucci M, et al. Androgen-regulated microRNA-135a decreases prostate cancer cell migration and invasion through downregulating ROCK1 and ROCK2. Oncogene. 2015;34(22):2846–2855. doi:10.1038/onc.2014.22225065599
- Vigil D, Kim TY, Plachco A, et al. ROCK1 and ROCK2 are required for non-small cell lung cancer anchorage-independent growth and invasion. Cancer Res. 2012;72(20):5338–5347. doi:10.1158/0008-5472.CAN-11-237322942252
- Zhang X, Liu X, Zhou W, et al. Fasudil increases temozolomide sensitivity and suppresses temozolomide-resistant glioma growth via inhibiting ROCK2/ABCG2. Cell Death Dis. 2018;9(2):190. doi:10.1038/s41419-017-0251-929416017
- Nagai Y, Matoba K, Kawanami D, et al. ROCK2 regulates TGF-beta-induced expression of CTGF and profibrotic genes via NF-kappaB and cytoskeleton dynamics in mesangial cells. Am J Physiol Renal Physiol. 2019;317(4):F839–F851. doi:10.1152/ajprenal.00596.201831364374
- Soliman H, Nyamandi V, Garcia-Patino M, et al. ROCK2 promotes ryanodine receptor phosphorylation and arrhythmic calcium release in diabetic cardiomyocytes. Int J Cardiol. 2019;281:90–98. doi:10.1016/j.ijcard.2019.01.07530728103
- Kobayashi Y, Banno K, Kunitomi H, et al. Warburg effect in gynecologic cancers. J Obstet Gynaecol Res. 2019;45(3):542–548. doi:10.1111/jog.1386730511455
- Li H, Xu H, Xing R, et al. Pyruvate kinase M2 contributes to cell growth in gastric cancer via aerobic glycolysis. Pathol Res Pract. 2019;215(6):152409. doi:10.1016/j.prp.2019.04.00131000383
- Lim SO, Li CW, Xia W, et al. EGFR signaling enhances aerobic glycolysis in triple-negative breast cancer cells to promote tumor growth and immune escape. Cancer Res. 2016;76(5):1284–1296. doi:10.1158/0008-5472.CAN-15-247826759242
- Pavlides S, Vera I, Gandara R, et al. Warburg meets autophagy: cancer-associated fibroblasts accelerate tumor growth and metastasis via oxidative stress, mitophagy, and aerobic glycolysis. Antioxid Redox Signal. 2012;16(11):1264–1284. doi:10.1089/ars.2011.424321883043
- Shen Y, Zhao S, Wang S, et al. S1P/S1PR3 axis promotes aerobic glycolysis by YAP/c-MYC/PGAM1 axis in osteosarcoma. EBioMedicine. 2019;40:210–223. doi:10.1016/j.ebiom.2018.12.03830587459
- Xiao Q, Wei Z, Li Y, et al. miR186 functions as a tumor suppressor in osteosarcoma cells by suppressing the malignant phenotype and aerobic glycolysis. Oncol Rep. 2018;39(6):2703–2710. doi:10.3892/or.2018.639429693191
- Zhao X, Lu C, Chu W, et al. MicroRNA-124 suppresses proliferation and glycolysis in non-small cell lung cancer cells by targeting AKT-GLUT1/HKII. Tumour Biol. 2017;39(5):1010428317706215. doi:10.1177/101042831770621528488541
- Liu C, Wang X, Zhang Y. The roles of HK2 on tumorigenesis of cervical cancer. Technol Cancer Res Treat. 2019;18:1533033819871306. doi:10.1177/153303381987130631530094
- Liu CC, Chou KT, Hsu JW, et al. High metabolic rate and stem cell characteristics of esophageal cancer stem-like cells depend on the Hsp27-AKT-HK2 pathway. Int J Cancer. 2019;145(8):2144–2156. doi:10.1002/ijc.3230130920655
- Jiang X, Zhang Z, Song C, et al. Glaucocalyxin A reverses EMT and TGF-beta1-induced EMT by inhibiting TGF-beta1/Smad2/3 signaling pathway in osteosarcoma. Chem Biol Interact. 2019;307:158–166. doi:10.1016/j.cbi.2019.05.00531059706
- Chen W, Gong P, Guo J, et al. Glycolysis regulates pollen tube polarity via Rho GTPase signaling. PLoS Genet. 2018;14(4):e1007373. doi:10.1371/journal.pgen.100737329702701
- Zhang T, Zhu X, Wu H, et al. Targeting the ROS/PI3K/AKT/HIF-1alpha/HK2 axis of breast cancer cells: combined administration of polydatin and 2-Deoxy-d-glucose. J Cell Mol Med. 2019;23(5):3711–3723. doi:10.1111/jcmm.1427630920152
- Deng X, Yi X, Deng J, et al. ROCK2 promotes osteosarcoma growth and metastasis by modifying PFKFB3 ubiquitination and degradation. Exp Cell Res. 2019;385(2):111689. doi:10.1016/j.yexcr.2019.11168931678169
- Jiao L, Zhang HL, Li DD, et al. Regulation of glycolytic metabolism by autophagy in liver cancer involves selective autophagic degradation of HK2 (hexokinase 2). Autophagy. 2018;14(4):671–684. doi:10.1080/15548627.2017.138180428980855
- Wang H, Peng R, Chen X, et al. Effect of HK2, PKM2 and LDHA on cetuximab efficacy in metastatic colorectal cancer. Oncol Lett. 2018;15(4):5553–5560. doi:10.3892/ol.2018.800529552193
- Lu Z, Guo Y, Zhang X, et al. ORY-1001 suppresses cell growth and induces apoptosis in lung cancer through triggering HK2 mediated warburg effect. Front Pharmacol. 2018;9:1411. doi:10.3389/fphar.2018.0141130568590
- Song W, Wang Z, Gu X, et al. TRIM11 promotes proliferation and glycolysis of breast cancer cells via targeting AKT/GLUT1 pathway. Onco Targets Ther. 2019;12:4975–4984. doi:10.2147/OTT.S20772331388304
- Song K, Song J, Lin K, et al. Survival analysis of patients with metastatic osteosarcoma: a surveillance, epidemiology, and end results population-based study. Int Orthop. 2019;43(8):1983–1991. doi:10.1007/s00264-019-04348-431127366
- Kalender ME, Demiryurek S, Oztuzcu S, et al. Association between the Thr431Asn polymorphism of the ROCK2 gene and risk of developing metastases of breast cancer. Oncol Res. 2009;18(11):583–591. doi:10.3727/096504010X12767359113767
- Pranatharthi A, Thomas P, Udayashankar AH, et al. RhoC regulates radioresistance via crosstalk of ROCK2 with the DNA repair machinery in cervical cancer. J Exp Clin Cancer Res. 2019;38(1):392. doi:10.1186/s13046-019-1385-731488179