
Abstract
Introduction
Hepatocellular carcinoma (HCC) is a liver cancer with a poor prognosis. Owing to the complexity and limited pathogenic mechanism research on HCC, the molecular targeted therapy has been hindered.
Methods
In this study, we categorized transcriptome data into low-Myc and high-Myc expression groups in 365 HCC samples, screened the differentially expressed RNAs, including 441 DE-lncRNAs, 99 DE-miRNAs and 612 DE-mRNAs, constructed a lncRNA-miRNA-mRNA regulatory network, and selected a hub triple regulatory network through cytoHubba analysis. Through Gene ontology and KEGG pathway, a hub regulatory network was particularly enriched in the “Wnt signaling pathway” and “Cytochrome P450-arranged by substrate type” by Metascape. The prognostic genes in the hub regulatory network were evaluated by the RNA expression analysis, Kaplan–Meier (KM) survival analysis, and correlation analysis.
Results
The results showed that miR-212-3p/SLC6A1 axis was a potential prognostic model for HCC. Furthermore, IHC analysis showed down-regulated expression of SLC6A1 in HCC tissues and Alb-Cre;Myc mouse liver cancer tissues. The genetics and epigenetic analysis indicated that SLC6A1 expression was negatively correlated with DNA methylation. Immune infiltration analysis showed a negative relation between SLC6A1 and T cell exhaustion/monocyte in liver cancer tissues.
Conclusion
In summary, the study revealed that miR-212-3p/SLC6A1 axis could serve as a crucial therapeutic target for HCC.
Introduction
Liver cancer is one of the biggest challenges among malignant tumors, and its incidence and mortality are increasing worldwide. Citation1–3 There are millions of individuals affected by liver cancer every year. Citation4 Moreover, hepatocellular carcinoma (HCC) accounts for approximately 75–85% of all primary hepatic cancer (PHC). Citation5 Liver cirrhosis confers a risk of HCC, especially for patients with hepatitis B virus (HBV), hepatitis C virus (HCV), excessive alcohol consumption, and nonalcoholic steatohepatitis (NASH). Citation6–9 Despite various medical techniques, the overall 5-year survival rate of HCC remains less than 20%, owing to low diagnosis rates at an early stage and high frequent metastasis rates in HCC. Citation10 Therefore, traditional medical therapeutics strategies, including surgical resection, liver transplantation, and radiofrequency ablation, are still inadequate for the treatment of advanced or metastatic HCC. Currently, the molecular targeted therapy and immunotherapy is a more meaningful option for HCC treatment. Molecular targeted therapy for liver cancer has strong specificity, obvious curative effect, and less damage in adjacent normal tissue. Citation11–13 Hence, it is urgent to explore significant markers for liver cancer, to achieve with multi-gene targeted therapy. Citation14,Citation15
MicroRNAs (miRNAs) are a class of endogenous small non-coding RNA molecules (~22 nucleotide), and the up/down-regulation of miRNA expression involves binding to the 3′ or 5′ untranslated region of target mRNA at the post-transcriptional level. Citation16,Citation17 In addition, miRNAs, as a novel biomarker, have crucial roles in cell cycle, differentiation, and cell apoptosis in cancer cells. Citation18 The effect of miRNA-mRNA pairs on carcinogenesis is of vital research interest. With the development of high-throughput microarray and bioinformatics analysis, increasing miRNA/mRNA pairs are found to play crucial roles in liver cancers. For example, Hou et al performed a comprehensive analysis of miRNomes in human HCC and found that miR-199a/b-3p can suppress HCC growth by targeting PAK4. Citation19 Zhou et al explored target SOX6 repressed proliferation of HCC cells by regulating miR-21-5p through an analysis of the effect of curcumin in HCC. Citation20 miR-195-5p/CDK1, miR-5589-3p/CCNB1 and let-7c-3p/CKS2 were screened as significant miRNA-mRNA axes, suggesting unfavorable prognosis in HCC. Citation21 The progression of HCC is caused by abnormalities in genes and biological signaling pathways. However, only a fraction of miRNA/mRNA regulatory axes have been elucidated in HCC, so further study is needed.
Myc is a transcription factor that is over-expressed in more than half of human cancers, including HHC. Citation22,Citation23 In this study, the TCGA datasets of RNAs (lncRNAs, miRNAs, and mRNAs) expression profiles from the same clinical HCC samples were utilized to analyze differentially expressed RNAs between tumor tissues with low-Myc expression and high-Myc expression (according to the median value of Myc expression). A hub triple lncRNA-miRNA-mRNA regulatory network was constructed from differentially expressed RNAs. Then, functional enrichment analysis of DE-mRNAs was carried out to assess the potential functional role in HCC. Besides, a key miR-212-3p/SLC6A1 axis was detected from the hub triple regulatory axes through twelve ranked methods, respectively, in cytoHubba analysis. In the end, the effect of miR-212-3p/SLC6A1 axis on expression, survival, Immunohistochemistry, methylation, and immune infiltration in HCC were explored.
Methods
Establishment of MYC-Related Transgenic Mouse Models of HCC
In this study, we constructed an HCC model using c-Myc/Alb-Cre double-positive mouse. The H11-LSL-Myc mice were crossed with Alb-Cre transgenic mice. Cre-mediated recombination led to the expression of Myc in the liver of H11-LSL-Myc, and tumor in liver tissue was observed after 2 weeks. The wild-type (WT) mice with C57BL/6J were the control group. All experimental procedures were approved by the Institutional Animal Care and Use Committee (IACUC) guidelines at Tongji University School of Medicine (SYDW-19-215) and complied with the Guidelines for the ethical review of laboratory animal welfare People’s Republic of China National Standard (GB/T 35892–2018).
HE staining was utilized to identify histopathological changes in the mouse liver tissues (6 Alb-Cre; Myc mice and 6 WT mice, respectively), and PCR analysis was utilized to identify the genotype through the mice tail ( Supplemental Figure 1 ).2 Citation24
Data Collection
In this study, the normalized RNA-Seq data (lncRNAs, miRNAs, and mRNAs) and related clinical information were downloaded from the Cancer Genome Atlas (TCGA) ( https://portal.gdc.cancer.gov/ ), including 365 HCC samples and 50 paired normal samples. Further external validation was performed to analyze the expression of SLC6A1 among pan-cancers cell lines, with data from the Cancer Cell Line Encyclopedia (CCLE, https://portals.broadinstitute.org/ccle ). The pathological changes of SLC6A1 expression in HCC patients were examined through the protein level analysis, with data from the Human Protein Atlas (HPA) ( http://www.proteinatlas.org/ ). Citation25,Citation26 Finally, 360 HCC samples with related immune data were obtained to analyze the immune infiltration microenvironment of SLC6A1 by cBioPortal.
Differential Expression (DEGs) and Functional Enrichment Analyses
The RNA-Seq data (365 HCC samples) were divided into two groups by the median value of Myc expression. In this study, DE-lncRNAs and DE-mRNAs were identified in low-Myc expressed and high-Myc expressed tumor samples with the thresholds of |log2FC|≧0.8 and P <0.05. Additionally, we screened the DE-miRNAs with a cutoff value of |log2FC|≧0.35 and P <0.05. The volcano plots of the DEGs (including DE-lncRNAs, DE-miRNAs, and DE-mRNAs) were generated by GraphPad Prism 8.3.0. The heat map was visualized by TBtools 1.051. Citation27
To further illustrate the functional enrichment of DEGs between low-Myc and high-Myc expression groups, the identified DEGs (differentially expressed mRNAs) were performed to analyze Gene Ontology (GO) and Kyoto Encyclopedia of Genes and Genomes (KEGG) pathway, with the enrichment standard: P<0.01, a minimum count of 3, and enrichment factor> 1.5. For more underlying function of SLC6A1 in liver cancer, top 200 genes, acquired from GEPIA ( http://gepia.cancer- pku.cn/ ) website, were closely correlated with SLC6A1 expression in HCC development. Then, the enrichment analyses of these genes were performed by Metascape ( http://metascape.org ), and the results were shown by the R software.
Screening of a Specific Prognosis miRNA-mRNA Axis
The lncRNA-miRNA-mRNA regulatory network was constructed as follows. Citation28 The HCC-related regulatory network was established on the interactions between the differentially expressed lncRNAs, miRNAs, and mRNAs. In brief, the interactions between 8 DE-lncRNAs and 5 DE-miRNAs were explored by the miRcode database ( http://www.mircode.org/ ).
Additionally, miRDB ( http://www.mirdb.org/ ) and Targetscan ( http://www.targetscan.org/ ) were used to predict the miRNA-targeted (5 DEmiRNAs) and overlapped predicted results among 612 DE-mRNAs. The lncRNA-miRNA-mRNA network was visualized by Cytoscape 3.7.0 ( https://cytoscape.org/ ), which provided users with a more picturesque biological process network.
In order to study the potential functional lncRNA-miRNA-mRNA regulatory modules of liver cancer, the Cytoscape plug-in cytoHubba were screened to identify the hub triple regulatory network, and the top 3 hub genes (CNTN3, SLC6A1and HOMER1) from highly interacted 37 DE-mRNAs were performed by the twelve ranked methods, respectively, including Maximal Clique Centrality (MCC), Betweenness, Clustering Coefficient, etc., as showed in Table S1 .
The hub triple regulatory network, including 11 hub genes (3 DE-lncRNAs, 5 DE-miRNAs, and 3 DE-mRNAs) was applied to analyze the RNA-expression of low-Myc expression and high-Myc expression tumor group.
Furthermore, the overall survival (OS) of hub DEGs in HCC patients was evaluated through the Kaplan–Meier analysis and the Log rank test. Then, the chromosome combination location sites of miR-217/miR-212-3p-SLC6A1 were predicted via TargetScan ( http://www.targetscan.org/ ). In the end, we also predicted the Spearman correlation between Myc and miR-212-3p/SLC6A1 of HCC patients in TCGA. These HCC-related miRNA-mRNA axes were further analyzed in the following experiment.
Immunohistochemical (IHC) Analysis
Immunohistochemistry is a technique for the detection of antigens in tissue sections through chemical reactions. The tumor tissues of Alb-Cre;Myc mice were used to assess the protein expression of SLC6A1 in HCC, compared with the normal tissues of WT mice. SLC6A1 (Rabbit Polyclonal Antibody, 20298-1-AP) antibody was used in all sections. Each section underwent antigen repair, background blocking, and antibody detection for specific antigens. Ultimately, two pathologists, who were blind to patient details, independently evaluated the quantitation of immunostaining for SLC6A1. The images were taken with an orthophoto microscope (magnification, 100X, and 200X).
Methylation and Genetic Alterations Analysis
To further study the impact of DNA methylation on SLC6A1 mRNA expression, the UALCAN database ( http://ualcan.path.uab.edu/ ) was used, which was updated along with the DNA methylation data and associations between cancers and genes. Moreover, the MEXPRESS ( https://mexpress.be/ ), which contained a mass of liver cancer samples, was utilized to evaluate the SLC6A1 gene in some significant CpG islands. Citation29
The genetic alterations of SLC6A1 were identified by an online website ( http://www.cbioportal.org/ ) assessed from liver cancer (TCGA, Firehose Legacy, 366 patients). Citation30 The genomic map, including data for putative copy-number alterations (CNA) from GISTIC, was related to mRNA expression z-scores and mutations. Citation31
Tumor-Infiltrating Analysis
The TIMER database ( http://timer.cistrome.org/ ) can provide abundant information of tumor-infiltrating immune cells from gene expression profiles and assess their clinical impacts. Citation32,Citation33 The correlations between SLC6A1 expression and the typical markers of 16 immune infiltration cells (markers of CD8+T cells, T cells, B cells, etc.) were analyzed. Using the Gene Expression Profiling Interactive Analysis ( http://gepia.cancerpku.cn/index.html ), the expressions of SLC6A1 in HCC tissues and normal liver tissues were evaluated for the correlation between clinical consequences and immune cell infiltration and SLC6A1 expression.
Statistical Analysis
All experiment data were processed by GraphPad Prism 8.3. The results were shown as median ± 95% confidence interval (CI). The non-parametric test was used in all different groups, and P<0.05 was statistically significant.
Results
Identification of Differentially Expressed RNAs (DERNAs) at MYC Different Expression of HCC Sample
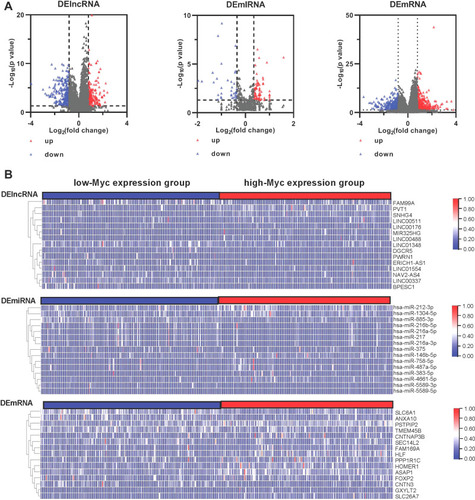
The Myc-related regulatory network was used to screen out a potential prognostic marker for HCC clinical development. Most differentially expressed genes were identified from cancer and para-cancerous groups. In this study, to identify the potential regulatory mechanism of Myc in HCC samples, the differentially expressed RNAs (DE-lncRNAs, DE-miRNAs, and DE-mRNAs) in liver cancer samples with low-Myc and high-Myc expression tumor groups were identified through the TCGA datasets. As in , the total of 441 lncRNAs (199 up-regulated and 243 down-regulated), 99 miRNAs (64 up-regulated and 35 down-regulated), and 612 mRNAs (359 up-regulated and 253 down-regulated) were sorted out as differentially expressed genes. The heat map was used to reveal the expression profiles of 15 significant genes (DERNAs) in HCC samples, respectively ().
Figure 1 Identification of DEGs in HCC samples: The TCGA expression profile comparison between low-Myc expression and high-Myc expression groups: (A) The volcano diagrams show the DE lncRNAs, miRNAs, and mRNAs in low-Myc expression and high-Myc expression groups, respectively. The blue dots indicate the downregulated DE-RNAs; The red dots indicate the up-regulated DE-RNAs. (B) The heat map of all target values of DE lncRNAs, miRNAs, and mRNAs from liver tissues of low-Myc expression and high-Myc expression samples.
Construction of a Hub Triple Regulatory Network and Functional Enrichment Analysis in HCC
IncRNAs, participating in the regulation of the biological pathway of cancers, change mRNA expression with miRNAs. Based on the relationships between lncRNA and mRNA and the role of miRNA as a middle regulatory molecule, we constructed a lncRNA-miRNA-mRNA regulatory network to predict the functions of DEGs. We predicted the downstream target 5 miRNAs of the 441 DE-lncRNAs using the databases of miRcode. Meanwhile, the public predicted websites (TargetScan and miRDB) were used to predict related target mRNAs of 5 miRNAs. Finally, based on the consistent combination of 5 miRNAs with DE-lncRNAs and DE-mRNAs, 22 potential lncRNA-miRNA pairs and 41 miRNA–mRNA pairs were constructed using Cytoscape 3.7, which involved 8 DE-lncRNAs, 5 DE-miRNAs, and 37 DE-mRNAs in the Myc-related triple regulatory network (). A hub triple regulatory network was found out from the Cytoscape plug-in cytoHubba; the analysis results revealed 3 lncRNA (SNHG14, DGCR5, LINC00337), 5 miRNAs (miR-217, miR-212-3p, miR-216b-5p, miR-146b-5p, miR-375), 3 mRNA (SLC6A1, CNTN3, HOMER1), as shown in . As shown in Table S1 , 3 hub genes (SLC6A1, CNTN3 and HOMER1) were remarkably selected by the twelve ranked methods, especially in SLC6A1 expression.
Figure 2 A hub triple regulatory network and functional enrichment in HCC: The lncRNA-miRNA-mRNA triple relationship network in HCC samples: (A) The blue rhombus represented down-regulated lncRNAs, red rhombus represented up-regulated lncRNAs. The blue triangles represented down-regulated miRNAs, red triangles represented up-regulated miRNAs. The blue ellipses represented down-regulated mRNAs, red ellipses represented up-regulated mRNAs. (B) A Myc-associated hub triple regulatory network through cytoHubba analysis based on the above regulatory network. (C) Gene ontology and KEGG pathway analysis of DE-mRNAs.
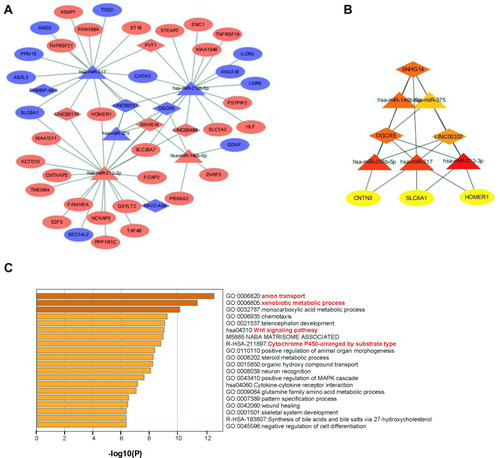
For the mechanisms of the hub triple regulatory network, the functional enrichment analyses, including GO and KEGG pathway, were performed by Metascape online website. All DE-mRNAs were particularly enriched in the “anion transport”, “xenobiotic metabolic process”, “Wnt signaling pathway”, and “Cytochrome P450-arranged by substrate type” (). Meanwhile, the top 200 SLC6A1-related genes in HCC were processed by enrichment analysis ( Supplemental Figure 2 ). The result showed that the enrichment pathway related to SLC6A1 is the peroxisome pathway. In addition, the notably enriched GO terms (including BP, MF, and CC) related to SLC6A1 were mainly distributed in “small molecule catabolic process”, “oxidoreductase activity”, and “histone modification”.
Screening of miR-212-3p/SLC6A1 Axis in HCC
To explore some crucial miRNA/mRNA pairs in HCC, we analyzed DERNAs from the hub triple regulatory networks in HCC patients. The results found 1 up-regulated (SNHG14) and 2 down-regulated (LINC00337, DGCR5) lncRNAs, 2 up-regulated (miR-212-3p, miR-146b-5p) and 3 down-regulated (miR-216b-5p, miR-217, miR-375) miRNAs, and 1 up-regulated (HOMER1) and 2 down-regulated (SLC6A1, CNTN3) mRNAs in HCC samples in low-Myc and high-Myc expression tumor groups ( Supplemental Figure 3 ). Next, to analyzed whether these hub DERNAs were associated with HCC prognosis, we carried out an overall survival (OS) analysis of 365 HCC patients from TCGA data and found that 1 DE-miRNAs (miR-212-3p) and 2 DE-mRNAs (SLC6A1, HOMER1) were associated with prognosis based on P<0.05 ( Supplemental Figure 4 ). Interestingly, statistical analysis indicated that patients with low SLC6A1 expression had lower survival rates than those with high SLC6A1 expression (P=0.0030), especially in the Myc-related liver cancer subgroup.
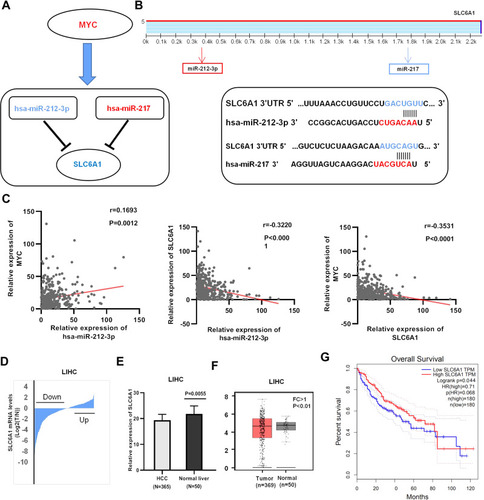
From the analysis of low-Myc and high-Myc expression groups, we observed that some potential miRNAs, miR-212-3p (up-regulated) and miR-217 (down-regulated) could regulate the expression of SLC6A1 (down-regulated) in the regulatory network of HCC (). According to the pairing between miR-212-3p and miR-217 and the target combination site in the SLC6A1, 3ʹUTR were, respectively, predicted by TargetScan (). The negative correlation between miR-212-3p and SLC6A1 expression in HCC tissues from TCGA data (r=−0.322, P<0.0001). Consistent with the above results, the correlation between Myc and miR-212-3p/SLC6A1 regulatory axis expression was remarkably negative in HCC tissues (miR-212-3p: r=0.169, P=0.0012; SLC6A1: r=−0.353, P<0.0001; ). These analyses implied that increasing miR-212-3p inhibited SLC6A1 expression in HCC, and miR-212-3p/SLC6A1axis could be a potential prognostic model in HCC.
Figure 3 Identification of potential miRNA-mRNA pairs in the setting of Myc: (A) Constructed a significant miRNA-mRNA pair in HCC: blue=down- regulated, red =up-regulated. (B) The TargetScan predicted website, the target combination site between the SLC6A1 3ʹUTR and miR-212-3p/miR-217, was shown, respectively. (C) The correlation analysis between Myc and miR-212-3p/SLC6A1 axis expression in HCC tissues from TCGA data. (D-E). The expression distribution of SLC6A1 in 365 HCC tissues, compared with 50 adjacent normal liver tissues from the TCGA databases. (F) Expression of SLC6A1 in HCC and normal tissue samples from the TCGA and GTEx databases. (G) Kaplan–Meier analysis of HCC according to SLC6A1 expression.
The Loss of SLC6A1 Associated with Poor Prognosis in HCC
TCGA HCC cohort analysis shows that SLC6A1 expression is down-regulated in 365 HCC tissues, while the SLC6A1 expression is in 50 adjacent normal liver tissues (P=0.0055) (). Statistical analysis shows that HCC tissues have significantly lower SLC6A1 expression than normal liver tissues using the TCGA database (FC>1; P<0.01) (). Pan-cancers cell lines have less SLC6A1 expression in cancer cells than non-tumor cells ( Supplemental Figure 5A ). The results show that low SLC6A1 expression is associated with lower OS, whereas high SLC6A1 mRNA levels are associated with higher OS. Therefore, SLC6A1 expression is significantly associated with decreased OS duration (P<0.05; ) in patients with HCC.
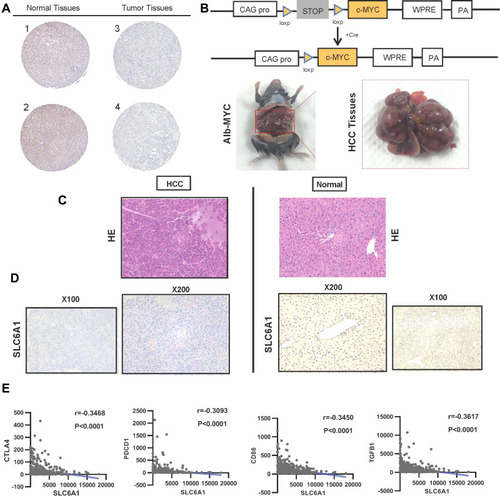
Besides, the protein expression level of SLC6A1 was examined in randomly selected HCC samples and normal liver samples from the HPA database. As shown in Table S2 , SLC6A1 expression is scored as negative in 64.3% (18/28), and SLC6A1 staining is not detected in 71.4% (20/28) of HCC patients. The typical immunostaining indicates that the SLC6A1 is non-expressed in most HCC tissues compared with normal liver tissues (Antibody: HPA013341 and CAB022293) (; Table S3 ). An Alb-Cre/Myc mice model of HCC is established to clarify the biological function of miR-212-3p/SLC6A1 at Myc different expressions of liver cancer (). The protein expression level of SLC6A1 in Alb-Cre/Myc mouse HCC tissues and WT mouse normal tissues are assessed. Moreover, HE staining can better display the tissue structure, cell morphology, and morphology of normal and pathological tissues. Disordered cell arrangement, unclear nucleus, and vacuolar degeneration in Alb-Cre/Myc mouse HCC tissues and normal cell morphology in WT mouse normal tissues are observed with HE staining (). The IHC analysis shows that the protein expression levels of SLC6A1 are higher in mouse normal tissues than in mouse HCC tissues (). The results reveal that miR-212-3p/SLC6A1 axis can promote Myc-related signals, which is important for the treatment development of HCC.
Figure 4 The protein level and immune checkpoint analysis of SLC6A1 in HCC: (A) Immunohistochemistry analysis shows the expression of SLC6A1 on protein by the Human Protein Atlas database. (B) The intercrossing of Myc and Alb-Cre mice through Cre/loxP transgenic technology (C) The Inspection of cell morphology changes in Alb-Cre/Myc mouse HCC tissues and WT mouse normal tissues through HE staining. (D) Immunohistochemistry analysis compared the expression of SLC6A1 on protein level in Alb-Cre/Myc mouse HCC tissues and WT mouse normal tissues. (E) The closely negative correlations between SLC6A1 and T cell exhaustion (CTLA-4, PD-L1)/Monocyte (CD86) in liver cancer tissues.
Whether the clinical features of HCC patients can affect expression levels of low- and high-SLC6A1 is explored to reveal the clinical significance of SLC6A1 in HCC patients. Table S4 shows that SLC6A1 expression is negatively associated with BMI (P=0.006), TNM stage (P=0.024), and the diameter of the tumor (P=0.010). However, the SLC6A1 expression is not significantly correlated with age, gender, lymph-node metastasis, and distant metastasis (all P>0.05, Table S4 ). Besides, the association between clinical characteristics and HCC prognosis was analyzed. The prognostic significance of the clinicopathologic features was explored using the OS and the Log rank test (including age, gender, BMI, TNM stage, tumor diameter, lymph-node metastasis, and distant metastasis). Supplemental Figure 5B shows that TNM stage (P<0.0001), tumor diameter (P<0.0001), and distant metastasis (P=0.004), BMI≦24 vs BMI>24 (P=0.037) are not significant with age and gender.
Associated SLC6A1 with Methylation and Genetic Alterations in HCC
Epigenetic inactivation and genetic alterations are two main reasons for the loss of tumor suppressor genes. The cBioPortal database analysis shows that SLC6A1 has a low deletion rate in HCC samples (13%, 47/360) ( Supplemental Figure 6 ). The correlation of SLC6A1 expression and the methylation status was analyzed to research the abnormal mechanisms of SLC6A1 down-regulated expression in HCC. DNA methylation is one of the most important epigenetic mechanisms and regulated by a series of enzymes, including the DNA methyltransferases (DNMTs) family, such as DNMT1, DNMT3A, and DNMT3B. Over-expression of DNMT1, DNMT3A, and DNMT3B at both transcriptional and translational levels could reduce tumor suppressor gene expression. Moreover, promoter CGI hypermethylation is associated with transcriptional suppression of RNA expression. The expression of DNMT1, DNMT3A, and DNMT3B in the SLC6A1low group is higher than that in the SLC6A1high group ( Supplemental Figure 7A ). The analysis from the ALCAN database shows that SLC6A1 has a slightly high CpG methylation level in the promoter region of HCC tissues (P=2.81E-04, Supplemental Figure 7B ). Three methylation sites (cg21771682, r=−0.500; cg10903281, r=−0.503; cg15237661, r=−0.520) are negatively associated with SLC6A1 expression in liver cancer by the MEXPRESS database ( Supplemental Figure 7C ). The results suggest that the hypermethylation level of SLC6A1 is correlated with the down-regulation of mRNA expression.
Associated SLC6A1 with Immune Infiltration Molecules in HCC
Immune cells are the basis of immunotherapy. Therefore, understanding the tumor microenvironment (TME) is the key to develop novel immunotherapeutic strategies in tumor therapy. However, the tumor microenvironment of SLC6A1 in liver cancer remains unclear. Owing to different expression levels of SLC6A1 are along with changes in extracellular components, SLC6A1 expression may be strongly associated with the tumor environment. Therefore, Table S5 shows the relationship between the abundance of immune cells and SLC6A1 expression levels, indicating that the SLC6A1 expression levels are correlated negatively with several significant immune cells, including CD8+ T cell (CD8A, CD8B), T cell (CD3D, CD3E, CD2), Monocyte (CD86, CD115), TAM (CCL2, CD68, IL10), Dendritic cell (HLA-DPB1, HLA-DQB1, HLA-DRA), Treg (TGFB1), and T cell exhaustion (PD-1, CTLA4, LAG3, TIM-3, GZMB) in HCC tissues. However, SLC6A1 expression in liver cancer correlates positively with M1 Macrophage (INOS, IRF5) and Treg (FOXP3, CCR8, and STAT5B) by TIMER 2.0 website.
The relationship between SLC6A1 expression and the above several significant immune markers in HCC tissues is statistically significant compared to less infiltration in normal liver tissues (P<0.05). Immune checkpoints, such as TGF β, PD-1, CTLA4, and CD68 (r=−0.3468, −0.3093, −0.3450, −0.3617 respectively; P<0.05) are closely negatively in HCC tissues (, Table S6 ). The results suggest that tumor-infiltrating immune cells may cause participation in the development of the miR-212-3p/SLC6A1 axis in HCC and provide several immune checkpoint inhibitors in the immunological therapy of HCC.
Discussion
Liver cancer has ranked the second most frequent reason for cancer-associated death worldwide and remains a great challenge to current public health. Citation34–36 Moreover, liver cancer, such as most other cancers, is highly heterogeneous, making a one-size-fits-all option problematic. The traditional clinical methods are insufficient in the development of liver cancer. Currently, accumulating evidence has proved that targeted therapies may effectively treat HCC patients. Citation37,Citation38 However, the rapid development of drug resistance weakened the clinical effects of targeted drugs. Thus, it is urgent to develop more novel HCC biomarkers and treatment strategies in HCC patients.
Nowadays, bioinformatics analysis has become increasingly important for exploring underlying mechanisms of various cancers. Citation39–42 This study has established a transgenic mouse model of liver cancer (Alb-Cre/Myc mice), and Myc is suggested to be a proverbial oncogenic factor in HCC, Citation43 providing a potential target for the prognosis and treatment of HCC dependent on Myc variants.
The differential expression RNAs (441 DE-lncRNAs, 99 DE-miRNAs, and 612 DE-mRNAs) were systematically identified through low- and high-Myc expression groups in a 365 HCC sample. A lncRNA-miRNA-mRNA regulatory network was constructed. A hub triple regulatory network was selected by cytoHubba analysis to understand better the intricate interactions among the DERNAs, including 3 lncRNAs, 5 miRNAs, and 3 mRNAs. The hub triple regulatory network was evaluated through RNA expression analysis, survival analysis, and correlation analysis. SLC6A1 can exert its function by sponging miR-212-3p in HCC.
Hepatocellular carcinoma (HCC) is polygenetic cancer with abundant genes involved. Citation44–47 Many pathways were related to HCC in the biological processes, including MAPK/AKT signal pathway activation, mTOR, Ras/Raf/MAPK, and p53 pathways. Citation48–50 In the Wnt/β-Catenin pathway, the loss of T-box transcription factor 3 (TBX3) in liver cancer prevents activating β-Catenin driven HCC formation. Citation51–53 Similar to the consequence, the enrichment analysis shows that the differential expression mRNAs are mainly concentrated upon the Wnt signaling pathway and Cytochrome P450-arranged by substrate type.
The enrichment function of SLC6A1 expression in HCC is unclear. Thus, the enrichment analysis of SLC6A1-related 200 genes was performed to enrich several pathways, such as peroxisome, small molecule catabolic process, and oxidoreductase activity, explaining the reason for SLC6A1 down-regulated expression in HCC.
The silencing of SLC6A1 (solute carrier 6 member 1) inhibited proliferation, migration, and invasion of SK-OV-3 ovarian cancer cells. Citation54 Chen et al found that over-expression of SLC6A1 might be related to the adverse progression of prostate cancer and promote the prostate cancer cell resistance to docetaxel therapy. Citation55 Contrastively, mRNA expression levels of SLC6A1 were decreased, and expression of SLC6A1 in 365 HCC tissues was down-regulated when Myc was high-expressed, compared to 50 para-carcinoma tissues from the TCGA data. Most importantly, further immunohistochemical experiments from the HPA database suggested that SLC6A1 revealed a suppressed expression in liver cancer tissues compared with non-cancerous liver tissues. The protein-level expression of SLC6A1 in mouse liver tissues was verified. The IHC results showed that SLC6A1 expression was highly concentrated in normal mouse liver tissue (WT mice) compared to Alb-Cre/Myc mouse liver cancer tissues.
This study indicated that the SLC6A1 exerted anticancer activity by sponging miR-212-3p. HCC is a typical inflammation-induced cancer and chronic inflammation, leading to DNA damage, genetic and epigenetic mutations in liver cancer. Increasing studies have analyzed that immune infiltration can directly affect the prognosis of HCC patients. There are significant correlations between SLC6A1 and 16 types of immune infiltration cells with different distributing levels of infiltration in HCC.
Among 16 types of immune infiltration cells, several immune cells, T cell (general) (CD3D), Monocyte (CD86), TAM (CD68), Treg (TGF β), and T cell exhaustion (PD-1, CTLA4, TIM-3, GZMB) were notably negative correlation with SLC6A1 gene copy numbers in HCC. Cytotoxic T-lymphocyte protein 4 (CTLA-4) can accelerate immunosuppression. The T cell exhaustion status was caused by programmed cell death protein 1 (PD-1), inhibiting T-cell multiplication and cytotoxic mediators release. Citation56–62 Tregs eliminate the immune response by expressing CTLA-4, which binds CD80/CD86, competes with CD28, and blocks the T cells activation. Citation63–65 The inhibition of immune checkpoints prevents immune exhaustion and leads to the reactivation of the anticancer immune response, Citation66–69 consistent with this analysis. This analysis obtained closely negative correlations between SLC6A1 and T cell exhaustion (CTLA-4, PD-L1)/Monocyte (CD86) in liver cancer tissues, but not in normal liver tissue, providing the immune regulatory functions of SLC6A1 expression in tumorigenesis of HCC.
Myc-related miR-212-3p/SLC6A1 axis can be a novel significant prognostic model for exploring the pathogenesis of HCC and serve as a valuable therapeutic target of HCC treatment.
Author Contributions
All authors made substantial contributions to conception and design, acquisition of data, or analysis and interpretation of data; took part in drafting the article or revising it critically for important intellectual content; agreed to submit to the current journal; gave final approval of the version to be published; and agree to be accountable for all aspects of the work.
Disclosure
The authors declare that they have no competing interests.
References
- Villanueva A . Hepatocellular carcinoma. N Engl J Med . 2019;381(1):e2. doi:10.1056/NEJMc1906565
- Yan Y , Zheng L , Du Q , et al. Interferon regulatory factor 1(IRF-1) activates anti-tumor immunity via CXCL10/CXCR3 axis in hepatocellular carcinoma (HCC). Cancer Lett . 2021;506:95–106. doi:10.1016/j.canlet.2021.03.002 33689775
- Yang S , Jiang W , Yang W , et al. Epigenetically modulated miR-1224 suppresses the proliferation of HCC through CREB-mediated activation of YAP signaling pathway. Mol Ther Nucleic Acids . 2021;23:944–958. doi:10.1016/j.omtn.2021.01.008 33614242
- Shigesawa T , Maehara O , Suda G , et al. Lenvatinib suppresses cancer stem-like cells in HCC by inhibiting FGFR1-3 signaling, but not FGFR4 signaling. Carcinogenesis . 2021;42(1):58–69. doi:10.1093/carcin/bgaa049 32449510
- Zhang J , Chen G , Zhang J , et al. Construction of a prognostic model based on nine immune-related genes and identification of small molecule drugs for hepatocellular carcinoma (HCC). Am J Transl Res . 2020;12(9):5108–5130.33042409
- Hu X , Wang X , Jia F , et al. A trans-fatty acid-rich diet promotes liver tumorigenesis in HCV core gene transgenic mice. Carcinogenesis . 2020;41(2):159–170. doi:10.1093/carcin/bgz132 31300810
- Kang Q , Chen J , Luo H , et al. Decrease in Chitinase 3-Like Protein 1 Levels Reflects Improvement in Liver Fibrosis after HCV Eradication. Dis Markers . 2020;2020:8539804. doi:10.1155/2020/8539804 33082884
- Xie M , Guo H , Lou G , et al. Neddylation inhibitor MLN4924 has anti-HBV activity via modulating the ERK-HNF1α-C/EBPα- HNF4α axis. J Cell Mol Med . 2021;25(2):840–854. doi:10.1111/jcmm.16137 33263949
- Zhao B , Ke K , Wang Y , et al. HIF-1α and HDAC1 mediated regulation of FAM99A-miR92a signaling contributes to hypoxia induced HCC metastasis. Signal Transduct Target Ther . 2020;5(1):118. doi:10.1038/s41392-020-00223-6 32636357
- Bray F , Ferlay J , Soerjomataram I , et al. Global cancer statistics 2018: GLOBOCAN estimates of incidence and mortality worldwide for 36 cancers in 185 countries. CA Cancer J Clin . 2018;68(6):394–424.30207593
- Bae SDW , Nguyen R , Qiao L , et al. Role of the constitutive androstane receptor (CAR) in human liver cancer. Biochim Biophys Acta Rev Cancer . 2021;1875(2):188516. doi:10.1016/j.bbcan.2021.188516 33529650
- Han R , Nusbaum O , Chen X , et al. Valeric Acid Suppresses Liver Cancer Development by Acting as a Novel HDAC Inhibitor. Mol Ther Oncolytics . 2020;19:8–18. doi:10.1016/j.omto.2020.08.017 33024815
- Jiao Y , Xu P , Shi H , et al. Advances on liver cell-derived exosomes in liver diseases. J Cell Mol Med . 2021;25(1):15–26. doi:10.1111/jcmm.16123 33247543
- Ahodantin J , Lekbaby B , Bou Nader M , et al. Hepatitis B virus X protein enhances the development of liver fibrosis and the expression of genes associated with epithelial-mesenchymal transitions and tumor progenitor cells. Carcinogenesis . 2020;41(3):358–367. doi:10.1093/carcin/bgz109 31175830
- Nasr MM , Nasr MM , Shehata LH . Clinical oncology research; Review on contemporary methodology standards. Curr Probl Cancer . 2021;100725. doi:10.1016/j.currproblcancer.2021.100725 33715867
- Khan P , Siddiqui JA , Lakshmanan I , et al. RNA-based therapies: a cog in the wheel of lung cancer defense. Mol Cancer . 2021;20(1):54. doi:10.1186/s12943-021-01338-2 33740988
- Brachtlova T , van Ginkel JW , Luinenburg MJ , et al. Expression of Oncolytic Adenovirus-Encoded RNAi Molecules Is Most Effective in a pri-miRNA Precursor Format. Mol Ther Oncolytics . 2020;19:332–343. doi:10.1016/j.omto.2020 33335978
- Huang X , Zhu X , Yu Y , et al. Dissecting miRNA signature in colorectal cancer progression and metastasis. Cancer Lett . 2021;501:66–82. doi:10.1016/j.canlet.2020.12.025 33385486
- Hou J , Lin L , Zhou W , et al. Identification of miRNomes in human liver and hepatocellular carcinoma reveals miR-199a/b-3p as therapeutic target for hepatocellular carcinoma. Cancer Cell . 2011;19:232–243. doi:10.1016/j.ccr.2011.01.001 21316602
- Cai M , Shao W , Yu H , et al. Paeonol Inhibits Cell Proliferation, Migration and Invasion and Induces Apoptosis in Hepatocellular Carcinoma by Regulating miR-21-5p/KLF6 Axis. Cancer Manag Res . 2020;12:5931–5943. doi:10.2147/CMAR.S254485 32765094
- Huang DP , Zeng YH , Yuan WQ , et al. Bioinformatics Analyses of Potential miRNA-mRNA Regulatory Axis in HBV-related Hepatocellular Carcinoma. Int J Med Sci . 2021;18(2):335–346. doi:10.7150/ijms.50126 33390802
- Chen J , Ding C , Chen Y , et al. ACSL4 reprograms fatty acid metabolism in hepatocellular carcinoma via c-Myc/SREBP1 pathway. Cancer Lett . 2021;502:154–165. doi:10.1016/j.canlet.2020.12.019 33340617
- Wang C , Zhang J , Yin J , et al. Alternative approaches to target Myc for cancer treatment. Signal Transduct Target Ther . 2021;6(1):117. doi:10.1038/s41392-021-00500-y 33692331
- Freimuth J , Gassler N , Moro N , et al. Application of magnetic resonance imaging in transgenic and chemical mouse models of hepatocellular carcinoma. Mol Cancer . 2010;9:94. doi:10.1186/1476-4598-9-94 20429921
- Uhlen M , Zhang C , Lee S , et al. A pathology atlas of the human cancer transcriptome. Science . 2017;357(6352):eaan2507. doi:10.1126/science.aan2507 28818916
- Pontén F , Jirström K , Uhlen M . The Human Protein Atlas--a tool for pathology. J Pathol . 2008;216(4):387–393. doi:10.1002/path.2440 18853439
- Chen C , Chen H , Zhang Y , et al. TBtools: an Integrative Toolkit Developed for Interactive Analyses of Big Biological Data. Mol Plant . 2020;13(8):1194–1202. doi:10.1016/j.molp.2020.06.009 32585190
- Shi Y , Zhang DD , Liu JB , et al. Comprehensive analysis to identify DLEU2L/TAOK1 axis as a prognostic biomarker in hepatocellular carcinoma. Mol Ther Nucleic Acids . 2021;23:702–718. doi:10.1016/j.omtn.2020.12.016 33575116
- Koch A , De Meyer T , Jeschke J , et al. MEXPRESS: visualizing expression, DNA methylation and clinical TCGA data. BMC Genomics . 2015;16(1):636. doi:10.1186/s12864-015-1847-z 26306699
- Cerami E , Gao J , Dogrusoz U . The cBio cancer genomics portal: an open platform for exploring multidimensional cancer genomics data. Cancer Discov . 2012;2(5):401–404. doi:10.1158/2159-8290.CD-12-0095 22588877
- Gao J , Aksoy BA , Dogrusoz U , et al. Integrative analysis of complex cancer genomics and clinical profiles using the cBioPortal. Sci Signal . 2013;6(269):pl1. doi:10.1126/scisignal.2004088 23550210
- Li T , Fan J , Wang B , et al. TIMER: a Web Server for Comprehensive Analysis of Tumor-Infiltrating ImmuneCells. Cancer Res . 2017;77(21):e108–10. doi:10.1158/0008-5472.CAN-17-0307 29092952
- Li B , Li T , Liu JS , Liu XS . Computational Deconvolution of Tumor-Infiltrating Immune Components with Bulk Tumor Gene Expression Data. Methods Mol Biol . 2020;2120:249–262. doi:10.1007/978-1-0716-0327-7_18 32124325
- Hu Y , Zhang X , Zai HY , et al. lncRNA DUXAP8 Facilitates Multiple Malignant Phenotypes and Resistance to PARP Inhibitor in HCC via Upregulating FOXM1. Mol Ther Oncolytics . 2020;19:308–322. doi:10.1016/j.omto.2020.10.010 33313387
- Ma S , Cheng J , Wang H , et al. A novel regulatory loop miR-101/ANXA2/EGR1 mediates malignant characteristics of liver cancer stem cells. Carcinogenesis . 2021;42(1):93–104. doi:10.1093/carcin/bgaa055 32531042
- Jiang X , Xing L , Chen Y , et al. CircMEG3 inhibits telomerase activity by reducing Cbf5 in human liver cancer stem cells. Mol Ther Nucleic Acids . 2020;23:310–323. doi:10.1016/j.omtn.2020.11.009 33425489
- Guo H , Xu J , Zheng Q , et al. NRF2 SUMOylation promotes de novo serine synthesis and maintains HCC tumorigenesis. Cancer Lett . 2019;466:39–48. doi:10.1016/j.canlet.2019.09.010 31546024
- Dalwadi DA , Torrens L , Abril-Fornaguera J , et al. Liver Injury Increases the Incidence of HCC following AAV Gene Therapy in Mice. Mol Ther . 2021;29(2):680–690. doi:10.1016/j.ymthe.2020.10.018 33554867
- Zhang JJ , Hong J , Ma YS , et al. Identified GNGT1 and NMU as Combined Diagnosis Biomarker of Non-Small-Cell Lung Cancer Utilizing Bioinformatics and Logistic Regression. Dis Markers . 2021;2021:6696198. doi:10.1155/2021/6696198 33505535
- Tian LL , Qian B , Jiang XH , et al. MicroRNA-497-5p Is Downregulated in Hepatocellular Carcinoma and Associated with Tumorigenesis and Poor Prognosis in Patients. Int J Genomics . 2021;2021:6670390. doi:10.1155/2021/6670390 33816607
- Li W , Liu Y , Li ZJ , et al. Unravelling the Role of LncRNA WT1-AS/miR-206/NAMPT Axis as Prognostic Biomarkers in Lung Adenocarcinoma. Biomolecules . 2021;11(2):203. doi:10.3390/biom11020203 33540574
- Yin YZ , Yao SH , Li CG , et al. Systematic analysis using a bioinformatics strategy identifies SFTA1P and LINC00519 as potential prognostic biomarkers for lung squamous cell carcinoma. Am J Transl Res . 2021;13(1):168–182.33527016
- Madden SK , de Araujo AD , Gerhardt M , et al. Taking the Myc out of cancer: toward therapeutic strategies to directly inhibit c-Myc. Mol Cancer . 2021;20(1):3. doi:10.1186/s12943-020-01291-6 33397405
- Zhao B , Wang Y , Tan X , et al. Inflammatory Micro- environment Contributes to Stemness Properties and Metastatic Potential of HCC via the NF-κB/miR-497/SALL4 Axis. Mol Ther Oncolytics . 2019;15:79–90. doi:10.1016/j.omto.2019.08.009 31650028
- Wang X , Liang C , Yao X , et al. PKM2-Induced the Phosphorylation of Histone H3 Contributes to EGF- Mediated PD-L1 Transcription in HCC. Front Pharmacol . 2020;11:577108. doi:10.3389/fphar.2020.577108 33324209
- Song J , Liu Y , Liu F , et al. The 14-3-3σ protein promotes HCC anoikis resistance by inhibiting EGFR degradation and thereby activating the EGFR-dependent ERK1/2 signaling pathway. Theranostics . 2021;11(3):996–1015. doi:10.7150/thno.51646 33391517
- Lin Z , Huang W , He Q , et al. FOXC1 promotes HCC proliferation and metastasis by Upregulating DNMT3B to induce DNA Hypermethylation of CTH promoter. J Exp Clin Cancer Res . 2021;40(1):50. doi:10.1186/s13046-021-01829-6 33522955
- Li J , Zhuo JY , Zhou W , et al. Endoplasmic reticulum stress triggers delanzomib-induced apoptosis in HCC cells through the PERK/eIF2α/ATF4/CHOP pathway. Am J Transl Res . 2020;12(6):2875–2889.32655816
- Du K , Li Y , Liu J , et al. A bispecific antibody targeting GPC3 and CD47 induced enhanced antitumor efficacy against dual antigen-expressing HCC. Mol Ther . 2021;29(4):1572–1584. doi:10.1016/j.ymthe.2021.01.006 33429083
- Ding B , Fan W , Lou W . hsa_circ_0001955 Enhances In Vitro Proliferation, Migration, and Invasion of HCC Cells through miR-145-5p/NRAS Axis. Mol Ther Nucleic Acids . 2020;22:445–455. doi:10.1016/j.omtn.2020.09.007 33230448
- Wang B , Zhao L , Fish M , et al. Self-renewing diploid Axin2+ cells fuel homeostatic renewal of the liver. Nature . 2015;524(7564):180–185. doi:10.1038/nature14863 26245375
- Lüdtke TH , Christoffels VM , Petry M , et al. Tbx3 promotes liver bud expansion during mouse development by suppression of cholangiocyte differentiation. Hepatology . 2009;49(3):969–978. doi:10.1002/hep.22700 19140222
- Suzuki A , Sekiya S , Büscher D , et al. Tbx3 controls the fate of hepatic progenitor cells in liver development by suppressing p19ARF expression. Development . 2008;135(9):1589–1595. doi:10.1242/dev.016634 18356246
- Zhao Y , Zhou X , He Y , et al. SLC6A1-miR133a-CDX2 loop regulates SK-OV-3 ovarian cancer cell proliferation, migration and invasion. Oncol Lett . 2018;16(4):4977–4983. doi:10.3892/ol.2018.9273 30250563
- Chen C , Cai Z , Zhuo Y , et al. Overexpression of SLC6A1 associates with drug resistance and poor prognosis in prostate cancer. BMC Cancer . 2020;20(1):289. doi:10.1186/s12885-020-06776-7 32252682
- Narayanapillai SC , Han YH , Song JM , et al. Modulation of the PD-1/PD-L1 immune checkpoint axis during inflammation- associated lung tumorigenesis. Carcinogenesis . 2020;41(11):1518–1528. doi:10.1093/carcin/bgaa059 32602900
- Pan YC , Nishikawa T , Chang CY , et al. CXCL2 combined with HVJ-E suppresses tumor growth and lung metastasis in breast cancer and enhances anti-PD-1 antibody therapy. Mol Ther Oncolytics . 2020;20:175–186. doi:10.1016/j.omto.2020.12.011 33575480
- Chen XJ , Yuan SQ , Duan JL , et al. The Value of PD-L1 Expression in Predicting the Efficacy of Anti-PD-1 or Anti-PD-L1 Therapy in Patients with Cancer: a Systematic Review and Meta-Analysis. Dis Markers . 2020;2020:6717912. doi:10.1155/2020/6717912 33488843
- Chen J , Sun HW , Yang YY , et al. Reprogramming immunosuppressive myeloid cells by activated T cells promotes the response to anti-PD-1 therapy in colorectal cancer. Signal Transduct Target Ther . 2021;6(1):4. doi:10.1038/s41392-020-00377-3 33414378
- Yuan Y , Wang L , Ge D , et al. Exosomal O-GlcNAc transferase from esophageal carcinoma stem cell promotes cancer immunosuppression through up-regulation of PD-1 in CD8+ T cells. Cancer Lett . 2021;500:98–106. doi:10.1016/j.canlet.2020.12.012 33307156
- Del Re M , van Schaik RHN , Fogli S , et al. Blood-based PD-L1 analysis in tumor-derived extracellular vesicles: applications for optimal use of anti-PD-1/PD-L1 axis inhibitors. Biochim Biophys Acta Rev Cancer . 2021;1875(1):188463. doi:10.1016/j.bbcan.2020.188463 33137405
- Yao Q , Gu L , Su R , et al. Efficacy and safety of combination PD-1/PD-L1 checkpoint inhibitors for malignant solid tumours: a systematic review. J Cell Mol Med . 2020;24(22):13494–13506. doi:10.1111/jcmm.15991 33078904
- Liu Z , Wang J , Liu L , et al. Chronic ethanol consumption and HBV induce abnormal lipid metabolism through HBx/SWELL1/arachidonic acid signaling and activate Tregs in HBV-Tg mice. Theranostics . 2020;10(20):9249–9267. doi:10.7150/thno.46005 32802190
- Zhang X , Ouyang X , Xu Z , et al. CD8+CD103+ iTregs Inhibit Chronic Graft-versus-Host Disease with Lupus Nephritis by the Increased Expression of CD39. Mol Ther . 2019;27(11):1963–1973. doi:10.1016/j.ymthe.2019.07.014 31402273
- Miao Z , Chen L , Feng H , et al. Baitouweng Decoction Ameliorates Ulcerative Colitis in Mice Partially Attributed to Regulating Th17/Treg Balance and Restoring Intestinal Epithelial Barrier. Front Pharmacol . 2021;11:531117. doi:10.3389/fphar.2020.531117 33597862
- Covre LP , De Maeyer RPH , Gomes DCO , et al. The role of senescent T cells in immunopathology. Aging Cell . 2020:e13272. doi:10.1111/acel.13272 33166035
- Shen C , Xu T , Sun Y , et al. Construction of an Immune-Associated Gene-Based Signature in Muscle-Invasive Bladder Cancer. Dis Markers . 2020;2020:8866730. doi:10.1155/2020/8866730 33456631
- Wang Z , Guo X , Gao L , et al. Classification of pediatric gliomas based on immunological profiling: implications for immunotherapy strategies. Mol Ther Oncolytics . 2020;20:34–47. doi:10.1016/j.omto.2020.12.012 33575469
- Luo YT , Liang YF , He H , et al. The immunosuppressant fingolimod ameliorates experimental autoimmune myasthenia gravis by regulating T-cell balance and cytokine secretion. Am J Transl Res . 2020;12(6):2600–2613.32655793