
Abstract
Objective
The limited understanding of correlation between genomic features and biological behaviors has impeded the therapeutic breakthrough in osteosarcoma (OS). This study aimed to reveal the correlation of mutational and evolutionary traits with clinical outcomes.
Methods
We applied a case-based targeted and whole exome sequencing of eleven matched primary, recurrent and metastatic samples from three OS patients characterized by different clinical behaviors in local recurrence or systematic progression pattern.
Results
Extensive OS-associated driver genes were detected including TP53, RB1, NF1, PTEN, SPEN, CDKN2A. Oncogenic signaling pathways including cell cycle, TP53, MYC, Notch, WNT, RTK-RAS and PI3K were determined. MYC amplification was observed in the patient with shortest disease-free interval. Linear, branched or mixed evolutionary models were constructed in the three OS cases. A branched evolution with limited root mutation was detected in patient with shorter survival interval. ADAM17 mutation and HEY1 amplification were identified in OS happening dedifferentiation. Signatures 21 associated with microsatellite instability (MSI) was identified in OS patient with extra-pulmonary metastases.
Conclusion
OS was characterized by complex genomic alterations. MYC aberration, limited root mutations, and a branched evolutionary model were observed in OS patient with relatively aggressive course. Extra-pulmonary metastases of OS might attribute to distinct mutational process pertaining to MSI. Further research in a larger number of people is needed to confirm these findings.
Introduction
Osteosarcoma (OS) is the most common primary malignant bone tumor in childhood and adolescence, with a second peak of incidence in elderly individuals over 60 years old.Citation1 OS exhibits highly aggressive nature and about 20% of OS patients have distant metastases at initial diagnosis. With advent of multi-drug neoadjuvant and adjuvant chemotherapy along with surgical removal with adequate margins, the 5-year survival has improved to 65~78% in patients with localized lesions, but less than 20% for patients with distal metastasis.Citation1,Citation2 Relapse recurs in 30%~40% of patients.Citation3 The current status of OS underlines the urgency and importance of understanding both the clinical biological behavior and genetic profiles of metastatic or recurrent tumors.
In recent years, several high-throughput genomic studies have investigated the genomes of OS including primary site with matched metastasis and recurrence.Citation4–Citation6 They characterized the considerable levels of phenotypic heterogeneity, aneuploidy, and the high rate of complex chromosomic aberrations across the whole genome.Citation7–Citation9 The collection of the optimal dataset requires an effort to merge existing genomic/biological datasets with optimal clinical annotation to ease researcher’s work. However, few study has correlated the profiling traits with biological behaviors in certain OS cases. And molecular characteristic of extra-pulmonary metastatic OS is scarcely explored. Biological behaviors and clinical outcomes can differ substantially between individuals with similar pathological characteristics in OS patients, which is probably due to the tremendous genomic heterogeneity. To gain a deeper insight of correlation between genomic features and biological behaviors in OS, we performed molecular profiling in three OS cases characterized by different clinical course.
Materials and Methods
Subjects and Samples Collections
Three OS patients who receive treatment at the authors’ institution were enrolled. We retrospectively reviewed the medical record (supplementary material), pathology slides and the molecular profiling data. The treatment charts for each patient are summarized in . Evaluation of OS necrosis rate after neoadjuvant chemotherapy was performed. The formula to calculate tumor cell necrosis rate (TCNR) was TCNR=(1-N/M)×100% as claimed in a previous study.Citation10 Formalin-fixed paraffin-embedded (FFPE) or fresh tumor tissues of primary, recurrent and metastatic lesions and matched blood samples were transferred to a third part institution accredited by the College of American Pathologists and certified by Clinical Laboratory Improvement Amendments for genetic variation detection.
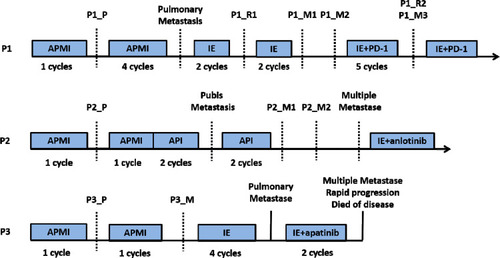
Figure 1 Treatment timelines of the three patients. The blue boxes indicate the period of chemotherapy. The black dotted line denotes the point of resection surgery. APMI was chemotherapy regimen composed of adriamycin, platinum, methotrexate and ifosfamide. API was chemotherapy regimen composed of adriamycin, platinum and ifosfamide. IE was protocol combining ifosfamide with etoposide. P1, P2 and P3 represent patient no.1, patient no.2 and patient no.3, respectively. P1_P, P2_P and P3_P indicate the primary tumors of patient no.1, patient no.2 and patient no.3, respectively. P1_R1 and P1_R2 indicate the first and the second local relapses of patient no.1, respectively. P1_M1, P1_M2 and P1_M3 indicate three metachronous lung metastases of patient no.1. P2_M1 and P2_M2 indicate kidney metastasis and iliac fossa metastasis of patient no.2, respectively. P3_M indicates the proximal sartorius metastasis of patient no.3.
DNA Extraction and Sequencing
Genomic DNA was prepared for paired-end library construction using a QIAamp DNA FFPE Tissue Kit and QIAamp DNA Blood Midi Kit (Qiagen, Hilden, Germany). FFPE-induced sequencing artefacts was controlled mainly through the following aspects. Firstly, for DNA extraction, a FFPE sample underwent a pathologist review to ensure each sample at least had the area of one square centimeter, nucleated cellularity of 80% and tumor content of 20%. And specialized FFPE sample reagents were utilized for DNA extraction. Secondly, data quality was inspected and controlled by examining sequencing coverage and uniformity. The variation of CT/GA will be eliminated if the ratio of transition and transversion was too high. The genomic alterations were examined using the YuanSu panel. This panel covers 637 tumor-related genes, which were listed in the supplementary material. The targeted regions of YuanSu panel were captured and sequenced at a mean depth of 1000× with an Illumina NovaSeq 6000. These procedures followed the steps described as previously reported.Citation11
Detection of Genomic Alterations
The raw sequencing data underwent stringent quality control of read depth and ratio of target capture. Clean reads were mapped to Human Reference Genome (hg19) using BWA-MEM. Genomic alterations were identified through the following methods: MuTect (v1.17) for single nucleotide variants (SNVs); PINDEL (v0.2.4) for insertion–deletion mutations (Indels), a minimum of 5 reads was required to support alternative calling. Variants with read depths less than 30× with strand bias larger than 10% or VAF < 0.5% were removed. To inspect the sensitivity of the mutation calling algorithm on sequence depth, we conducted an in silico simulation by down-sampling sequence reads using SAMtools (v1.3.1), followed by the same mutation calling steps for each down-sampled dataset. SnpEff3.0 for the functional impact of these mutations; Control-FREEC v9.4 (parameters: window = 50,000 and step = 10,000) for copy number variations (CNVs), deletion and duplication events were defined on a gene-by-gene basis.
For detecting gene rearrangements, paired-end reads with abnormal insert size of over 2000 bp aligned to the same chromosome or aligned to different chromosomes were collected and used as discordant reads. The group consisting of discordant reads with a distance less than 500 bp formed a cluster and paired clusters were obtained according to the pairing relationship. Consistent breakpoints from the paired-end discordant reads within a cluster were identified to establish potential rearrangement breakpoints. The breakpoints were double confirmed by BLATCitation11 and the corresponding discordant reads were filtered for those uniquely mapped to the genome reference to constitute rearrangement supported reads. The resulting chimeric read candidates were genome annotated.
Signaling pathways where the mutated genes located were reported by the Cancer Genome Atlas Research Network.
Phylogenetic Tree
All SNVs were used to construct phylogenetic tree by Lineage Inference for Cancer Heterogeneity and Evolution (LICHeE) method.Citation12 LICHeE utilizes the somatic SNV patterns of samples and their VAFs as lineage markers to reconstruct phylogenetic tree.Citation13 For each patient, we identified mutations that located on the trunk of the tree as “root mutations”.
Mutational Signatures
Somatic SNVs were divided into 96 trinucleotides (mutated base plus its sequence context) by 16 possible flanking nucleotide contexts.Citation12,Citation14 We obtained the signature probabilities matrix from COSMIC (version 2)Citation15 and applied a decomposition algorithm from the R package deconstrucSigs (version 1.8.0).Citation16
Results
Patient No.1
Patient no. 1 was an 18-year-old boy who was diagnosed with OS in left distal femur. He was administrated with neoadjuvant chemotherapy using adriamycin (A), cisplatin (P), methotrexate (M) and ifosfamide (I) (APMI protocol) for one cycle, followed by a limb-salvage procedure (specimen, P1_P). The TCNR of the specimen was reported to be 64.2%. Lung metastasis was confirmed and local recurrence was found 13 months after the initial treatment. Salvage chemotherapy protocol composed of ifosfamide and etoposide (IE) was given before reseciton of both local recurrence (specimen, P1_R1) and lung metastasis (specimen, P1_M1) successively. But another solitary lung metastasis occurred 9 months later (specimen, P1_M2) and anti-PD-1 strategy combined with IE protocol were introduced. Five months later, a second local recurrence (specimen, P1_R2) and lung metastasis (specimen, P1_M3) were resected (Supplementary Figure 1).
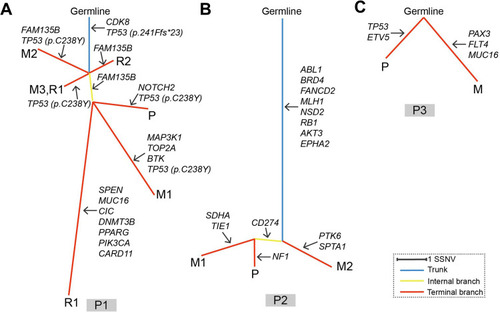
Patient no.1 was at a quintessential onset age and represented the typical OS with reiterative recurrence and lung metastasis. The tumor progressed relatively slowly. Sequencing on samples of patient no.1 validated 14 SNVs/Indels, 3 gene homozygous deletions, 2 fusion/rearrangements, 2 truncation mutation and 1 gene amplification. CDK8 (c.646+3G>A) and TP53 (c.721dup) were the two root mutations (2/22, 9.1%) shared by all samples. Two distinct TP53 variants (c.721dup and c.713G>A) were simultaneously detected in samples except P1_M3, in which only TP53 (c.713G>A) was validated. Homozygous deletion of RB1, another common driver gene of OS, were only observed in P1_P (). Oncogenic signalings where these mutations located in patient no.1 included TP53, cell cycle, RTK-RAS, Notch and PI3K. TP53 pathway was the only concomitant dysfunctional oncogenic signaling present in all the five specimens (). These results indicated the significance of TP53 inactivation during tumor origination and progression. To better identify the key molecular events during tumor evolution, we inferred ancestral relationships and constructed the phylogenetic tree. The phylogenetic tree demonstrated a evolutionary pattern in which the ancestral cells of metastatic or recurrent tumors might deviate at the early stage during the development of primary tumor. It was noteworthy that P1_R1 derived from two different branches, which might underlie the presence of at least two different clones within P1_R1 and reflect the intratumor heterogeneity ().
Figure 2 Mutation profile of the three patients. Panel (A–C) show mutational profiling in patient no.1, patient no.2 and patient no.3, respectively. The heat map indicates the presence of a mutation or its absence (gray) in each sample. The color bars below the heat map indicate classification of mutations. Green bar indicates substation or indel. Red bar indicates amplification. Blue bar indicates homozygous deletion. Yellow bar indicates fusion or rearrangement. Purple bar indicates truncation mutation. P1_P, P2_P and P3_P indicate the primary tumors of patient no.1, patient no.2 and patient no.3, respectively. P1_R1 and P1_R2 indicate the first and the second local relapses of patient no.1, respectively. P1_M1, P1_M2 and P1_M3 indicate three metachronous lung metastases of patient no.1. P2_M1 and P2_M2 indicate kidney metastasis and iliac fossa metastasis of patient no.2, respectively. P3_M indicates the proximal sartorius metastasis of patient no.3.
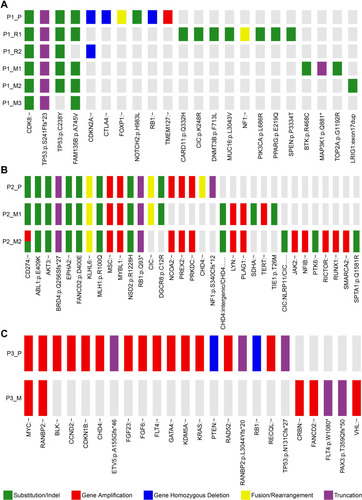
Figure 3 Oncogenic pathways of the three patients. Panel (A–C) show oncogenic pathways where the detected mutations located in patients no.1, patient no.2 and patient no.3, respectively. The heat map indicates the presence of a mutation or its absence (gray) in each sample. The color bars next to the heat map indicate classification of mutations. Green bar indicates substation or indel. Red bar indicates amplification. Blue bar indicates homozygous deletion. Yellow bar indicates fusion or rearrangement. Purple bar indicates truncation mutation. P1_P, P2_P and P3_P indicate the primary tumors of patient no.1, patient no.2 and patient no.3, respectively. P1_R1 and P1_R2 indicate the first and the second local relapses of patient no.1, respectively. P1_M1, P1_M2 and P1_M3 indicate three metachronous lung metastases of patient no.1. P2_M1 and P2_M2 indicate kidney metastasis and iliac fossa metastasis of patient no.2, respectively. P3_M indicates the proximal sartorius metastasis of patient no.3.
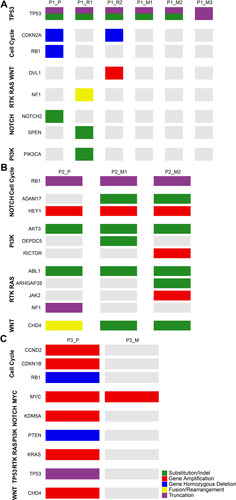
Figure 4 Phylogenetic trees of the three patients. Panel (A–C) represent phylogenetic tree of patient no.1, patient no.2 and patient no.3, respectively. Branch lengths are proportional to the number of somatic mutations separating the branching points. Potential driver mutations were acquired by the indicated genes in the branch (arrows). P1, P2 and P3 denote patient no.1, patient no.2 and patient no.3, respectively.
Patient No.2
Patient no.2 was a 27-year-old male diagnosed with OS in left distal femur. A solitary pubic metastasis was found 4 years after standard chemotherapy at TCNR of 92.8% and a limb-salvage surgery (specimen, P2_P). Then, kidney metastasis (specimen, P2_M1) occurred 9 months after completion of chemotherapy following pubis resection. Iliac fossa metastasis (specimen, P2_M2) was found during 3-month follow-up after the nephrectomy. No lung metastasis was detected till sysmatic metastases to pancreas, lung, mesentery, muscles and lymph nodes. Pathology of subsequent bone and visceral metastases all revealed undifferentiated sarcoma (Supplementary Figure 2).
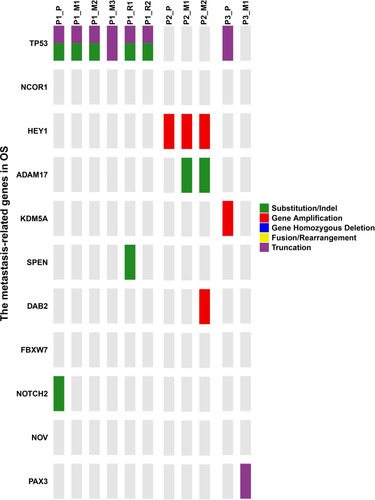
Patient no.2 was initially diagnosed with OS at a typical site but with a relatively uncommon age. Moreover, pathological phenotype of the subsequent rare metastases to bone, kidney and contralateral iliac fossa transformed into undifferentiated sarcoma. Despite pathological transversion, genomic profiling of metastatic lesions showed high similarity. Much more gene amplifications and higher fraction of root mutations (12/33, 36.4%) were reported in patient no.2. These root mutations included RB1, mismatch repair gene MLH1, tyrosine kinase ABL1, serine kinase AKT3 (). To deeply shed light on the molecular events during extrapulmonary metastase, we applied extra Whole Exome Sequencing (WES) on the samples of patient no.2 and filtered the metastasis-associated mutations based on data previously reportedCitation17–Citation19 (see supplementary material). A concomitant HEY1 amplification was determined in both primary and metastatic tumors. Another ADAM17 mutation was selectively detected in P2_M1 and P2_M2 (). No TP53 variant was discovered. These mutations referred to oncogenic pathways like cell cycle, Notch, PI3K, PTK-RAS and WNT, which were similar to that of patient no.1 (). Phylogenetic tree was reconstructed based on SNVs detected by the panel. It was revealed that patient no.2’s tumor went through a linear evolutionary process, with a relatively longer trunk ().
Figure 5 Metastasis-associated mutations of all OS samples. The heat map indicates the presence of a mutation or its absence (gray) in each sample. The color bars next to the heat map indicate classification of mutations. Green bar indicates substation or indel. Red bar indicates amplification. Blue bar indicates homozygous deletion. Yellow bar indicates fusion or rearrangement. Purple bar indicates truncation mutation. P1_P, P2_P and P3_P indicate the primary tumors of patient no.1, patient no.2 and patient no.3, respectively. P1_R1 and P1_R2 indicate the first and the second local relapses of patient no.1, respectively. P1_M1, P1_M2 and P1_M3 indicate three metachronous lung metastases of patient no.1. P2_M1 and P2_M2 indicate kidney metastasis and iliac fossa metastasis of patient no.2, respectively. P3_M indicates the proximal sartorius metastasis of patient no.3.
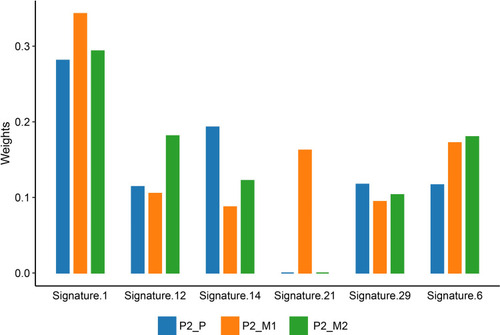
To evaluate the mutational events that might account for extra-pulmonary metastases, we inferred mutation signature profile of patient no.2 based on WES results. Signature 1 (spontaneous deamination of 5-methylcytosine), signature 6 (defective DNA mismatch repair (dMMR) and microsatellite instability (MSI)), signature 12 and signature 14 (with unknown etiology), along with signature 29 (tobacco chewing) were enriched in both primary and metastatic sites. Interestingly, signature 21 (probably associated with MSI) was selectively enriched in P2_M1 ().
Figure 6 Mutation signature of patient no.2. The color bars below the graph indicate different tumor samples. Blue bar represents primary tumor of patient no.2 (P2_P). Orange bar represents renal metastasis of patient no.2 (P2_M1). Green bar represents iliac fossa metastasis of patient no.2 (P2_M2).
Patient No.3
Patient no.3 was a 13-year-old boy diagnosed of OS at left distal femur with a nearby skip lesion on MRI. Routine APMI was given before the surgical removal (specimen, P3_P) with a TCNR of 85.3%. However, proximal sartorius metastasis (specimen, P3_M) occurred rapidly 3 months after the surgery. This patient suffered systematic progression and died eventually in spite of the radical treatment with IE and apatinib (Supplementary Figure 3).
Patient no.3 was characterized by a more aggressive course than previous two patients. Profiling revealed extreme disparity between primary and metastatic lesions, with root mutation fraction of 8.3% (2/24). The two shared mutant genes were MYC and RANBP2. TP53 and RB1 were both detected in P3_P. Furthermore, instead of SNVs, much more amplification aberrations were identified (). Dysfunctional oncogenic signalings in patient no.3 showed similarity with previous two patients (). Phylogenetic analysis on the P3_P and P3_M revealed remarkably branched evolution without shared SNVs determined by the panel ().
Integrative Analysis of the Three Patients
To better correlated molecular features with biological behaviors, we defined disease-free intervals as duration from the initial surgery to the first relapse or metastasis to signify the malignant level of three OS cases. Disease-free intervals of the three patients were 13 months, 41 months and 3 months, respectively. Root mutation fraction of the three OS cases were 2/22 (9.1%), 12/33 (36.4%) and 2/24 (8.3%), respectively. Low root mutation proportion tended to correlated with shorter disease-free interval. MYC amplification was only detected in patient no.3 with the worst clinical prognosis. Although good response to adjuvant chemotherapy had been identified as a favorable prognostic prediction,Citation20 contradiction existed in cases of patient 1 and patient 3 (13 months with TCNR of 64.2% for patient 1, and 3 months with TCNR of 85.3% for patient 3), suggesting a pitfall of pathological manifestation for prognostic evaluation.
Oncogenic signaling pathways involved in the tumorigenesis showed similarity amongst these three cases. PI3K, RTK-RAS, Notch and cell cycle associated pathways were dysregulated in all the three patients.
Phylogenetic reconstructions reveal different patterns for tumorigenesis. Patient no.2 showed a linear evolution with lots of trunk mutations, while patient no.3 tended to go through a branched evolutionary process in which the primary and metastatic tumors deviated in an early stage. Tumor of patient no.1 probably developed through a much more complicated process with the features of both linear and branched evolutions. Tumor with branched evolutionary tendency seemed to be associated with shorter disease-free interval.
Discussion
Despite advance in molecular profiling over recent decades, few research has correlated the profiling traits with biological behaviors in certain OS cases. And molecular characteristic of extra-pulmonary metastatic OS is scarcely explored. We performed molecular profiling in three cases of primary, refractory and metastatic OS to explore correlation of molecular characteristics with clinical behaviors.
In line with the previous research,Citation6,Citation21 TP53 and RB1 were the most pervasive-driving mutations, but were only simultaneously present in patient no.3. Signalings including PI3K, RTK-RAS, Notch and cell cycle were the most common oncogenic pathways affected in three OS patients. These pathways have been previously identified and represent therapeutic targets for OS.Citation22,Citation23
Root mutation was calculated to measure the subclonal complexity and disparity. Hoon Kim et alCitation24 had pointed out that increasing complexity of subclonal constitution was associated with favorable event-free survival, because time was needed for a dominant subclone to develop. Alternatively, the absence of a dominant aggressive clone might hinder tumor growth as a result of cells competing for space and nutrition. In marked contrast to that, we found that patient with less root mutations and branched evolution was prone to have shorter survival time. Wang et al has reported that, compared with linear evolution, tumors with parallel evolutionary pattern usually shared limited mutations between primary and metastatic clones and relapsed more quickly from the initial surgery, which was also confirmed by our results.Citation6 This can be interpreted by that tumors with lower root mutation proportion might accumulate more mutant genes affecting more oncogenic pathways, which might provide tumors with more routes to escape therapeutic and selective pressure. And branched evolutionary potential usually led to massive substrates for selection, forming a dominant subclone that showed much more malignancy. Therefore, root mutation proportion and branched evolution process might reflect the clinical outcome. Furthermore, MYC amplification (patient no.3) was merely detected in patient no.3 with shortest survival interval. It was reported that in OS cells, high expression of MYC promotes cell proliferation and migration,Citation25,Citation26 which were also backed up by our findings.
Lung (90%) was the most common site of OS relapse.Citation27 Nevertheless, molecular mechanism for extra-pulmonary metastasis has been scarcely explored. To evaluate the mutational processes that might underlie OS extra-pulmonary metastasis, we inferred mutation signature of patient no.2. Previous research has revealed the enrichment of deficient DNA repair mechanism signatures in OS lung metastasis,Citation6 which was also confirmed in patient no.2. Of note, signature 21 was selectively present in renal metastasis. Signature 21 was previously found only in four gastric-cancer samples and was probably associated with MSI. But MSI was deemed less prevalent in soft tissue sarcoma.Citation28 Furthermore, MSI characterized by signature 21 in this case was not strictly correlated with MMR protein loss, since MLH-1 was mutant in all samples of patient no.2. Thus, we suppose that a distinct mechanism other than dMMR might exist leading to this instability, as previously documented in Ewing sarcoma.Citation29
The cause of transformation from OS into undifferentiated sarcoma in patient no.2 can be complex. Partially, we propose that initial tumorigenesis of OS involves gradual loss of differentiated phenotype and acquisition of stem cell-like features (defined as stemness). The subsequent metastatic tumors probably derived from these dedifferentiated progenitor cells. Moreover, undifferentiated tumors are more likely to result in distant dissemination, causing disease progression and poor prognosis.Citation30–Citation32 The stemness and metastases of patient no.2 probably attributed to ADAM17 alteration and HEY1 amplification. ADAM17 (also known as TNF-α-converting-enzyme) is a family member of a disintegrin and metalloprotease domain (ADAM) and has been identified to function as a signaling scissor in the tumor microenvironment,Citation33 contributing to tumorigenesis and tumor progression.Citation34,Citation35 Additionally, ADAM17 promotes epithelial-mesenchymal transition (EMT) through the transforming growth factor-β/mothers against decapentaplegic homolog signaling pathway, which might account for the initial dedifferentiation and elevated metastatic potential.Citation36 The overexpression of ADAM17 is significantly associated with poor differentiation levelCitation37 and is an independent factor to predict tumor prognosis.Citation38 Furthermore, ADAM17 also triggers the EGFR oncogenic pathway, which implicates the potential for patient no.2 to receive anti-EGFR treatment.Citation39 HEY1 gene encodes a nuclear protein belonging to the hairy and enhancer of split-related (HESR) family of basic helix-loop-helix (bHLH)-type transcriptional repressors. Expression of HEY1 is generally induced by the Notch signal transduction pathways. HEY1 was reported to be essential for the transforming growth factor-β-dependent EMT, enhancing stemness, cell invasion and migration in cancers.Citation40 HEY1 has been identified as a candidate oncogene in glioblastoma,Citation41 rhabdomyosarcoma,Citation42 hepatocellular carcinoma,Citation43 head and neck squamous cell carcinoma.Citation44 It is also associated with poor prognosis in head and neck squamous cell carcinomaCitation44 and esophageal squamous cell carcinoma.Citation45 In osteosarcoma cell lines, the expression level of HEY1 was positively correlated with the tumorigenicity.Citation46 And, it was also documented that HEY1 augmented the metastasis of osteosarcoma via upregulation of matrix metallopeptidase 9 (MMP9). Knockdown of HEY1 decreased the expression of MMP9 and rescued the invasion of osteosarcoma cells.Citation47
One limitation of our study is the small sample size. Therefore, we can not well confirmed the interpretation of genomic characteristics with biological behaviors. Furthermore, we used single tumor samples taken at one time point during the disease progression and the panel we used did not cover all altered genes. Thus, we likely underestimated the true extent of molecular events within tumors.
Conclusions
In conclusion, OS was characterized by complex genomic alterations. MYC aberration, limited root mutations, and a branched evolutionary model might be observed in OS patient with relatively aggressive course. Extra-pulmonary metastases of OS might attribute to distinct mutational process pertaining to MSI. Further research in a larger number of people is needed to confirm these findings.
Ethics Approval and Informed Consent
This study was approved by the Medical Ethics Committee of Peking University People’s Hospital (Beijing, China). All the patients (for patient no.3, the legal guardian) had provided written informed consents for case details and accompanying images to be published.
Consent for Publication
All details of this work was consent for publication.
Disclosure
The authors report no conflicts of interest in this work.
References
- Kansara M, Teng MW, Smyth MJ, Thomas DM. Translational biology of osteosarcoma. Nat Rev Cancer. 2014;14(11):722–735. doi:10.1038/nrc383825319867
- Gaspar N, Occean BV, Pacquement H, et al. Results of methotrexate-etoposide-ifosfamide based regimen (M-EI) in osteosarcoma patients included in the French OS2006/sarcome-09 study. Eur J Cancer. 2018;88:57–66. doi:10.1016/j.ejca.2017.09.03629190507
- Kager L, Zoubek A, Potschger U, et al. Primary metastatic osteosarcoma: presentation and outcome of patients treated on neoadjuvant Cooperative Osteosarcoma Study Group protocols. J Clin Oncol. 2003;21(10):2011–2018. doi:10.1200/JCO.2003.08.13212743156
- Negri GL, Grande BM, Delaidelli A, et al. Integrative genomic analysis of matched primary and metastatic pediatric osteosarcoma. J Pathol. 2019;249(3):319–331. doi:10.1002/path.531931236944
- Sayles LC, Breese MR, Koehne AL, et al. Genome-Informed Targeted Therapy for Osteosarcoma. Cancer Discov. 2019;9(1):46–63. doi:10.1158/2159-8290.CD-17-115230266815
- Wang D, Niu X, Wang Z, et al. Multiregion Sequencing Reveals the Genetic Heterogeneity and Evolutionary History of Osteosarcoma and Matched Pulmonary Metastases. Cancer Res. 2019;79(1):7–20. doi:10.1158/0008-5472.CAN-18-108630389703
- Morrow JJ, Khanna C. Osteosarcoma Genetics and Epigenetics: emerging Biology and Candidate Therapies. Crit Rev Oncog. 2015;20(3–4):173–197. doi:10.1615/CritRevOncog.201501371326349415
- Lorenz S, Baroy T, Sun J, et al. Unscrambling the genomic chaos of osteosarcoma reveals extensive transcript fusion, recurrent rearrangements and frequent novel TP53 aberrations. Oncotarget. 2016;7(5):5273–5288. doi:10.18632/oncotarget.656726672768
- Perry JA, Kiezun A, Tonzi P, et al. Complementary genomic approaches highlight the PI3K/mTOR pathway as a common vulnerability in osteosarcoma. Proc Natl Acad Sci U S A. 2014;111(51):E5564–73. doi:10.1073/pnas.141926011125512523
- Rosen G, Caparros B, Huvos AG, et al. Preoperative chemotherapy for osteogenic sarcoma: selection of postoperative adjuvant chemotherapy based on the response of the primary tumor to preoperative chemotherapy. Cancer. 1982;49(6):1221–1230. doi:10.1002/1097-0142(19820315)49:6<1221::AID-CNCR2820490625>3.0.CO;2-E6174200
- Cao J, Chen L, Li H, et al. An Accurate and Comprehensive Clinical Sequencing Assay for Cancer Targeted and Immunotherapies. Oncologist. 2019;24(12):e1294–e302. doi:10.1634/theoncologist.2019-023631409745
- Popic V, Salari R, Hajirasouliha I, Kashef-Haghighi D, West RB, Batzoglou S. Fast and scalable inference of multi-sample cancer lineages. Genome Biol. 2015;16:91. doi:10.1186/s13059-015-0647-825944252
- Gusfield D. Efficient Algorithms for Inferring Evolutionary Trees. Networks. 1991;21(1):19–28. doi:10.1002/net.3230210104
- Helleday T, Eshtad S, Nik-Zainal S. Mechanisms underlying mutational signatures in human cancers. Nat Rev Genet. 2014;15(9):585–598. doi:10.1038/nrg372924981601
- Alexandrov LB, Jones PH, Wedge DC, et al. Clock-like mutational processes in human somatic cells. Nat Genet. 2015;47(12):1402–1407. doi:10.1038/ng.344126551669
- Rosenthal R, McGranahan N, Herrero J, Taylor BS, Swanton C. DeconstructSigs: delineating mutational processes in single tumors distinguishes DNA repair deficiencies and patterns of carcinoma evolution. Genome Biol. 2016;17:31. doi:10.1186/s13059-016-0893-426899170
- Czarnecka AM, Synoradzki K, Firlej W, et al. Molecular Biology of Osteosarcoma. Cancers. 2020;12(8):8. doi:10.3390/cancers12082130
- Saraf AJ, Fenger JM, Roberts RD. Osteosarcoma: accelerating Progress Makes for a Hopeful Future. Front Oncol. 2018;8:4. doi:10.3389/fonc.2018.0000429435436
- Moriarity BS, Otto GM, Rahrmann EP, et al. A Sleeping Beauty forward genetic screen identifies new genes and pathways driving osteosarcoma development and metastasis. Nat Genet. 2015;47(6):615–624. doi:10.1038/ng.329325961939
- Kim MS, Lee SY, Cho WH, et al. Tumor necrosis rate adjusted by tumor volume change is a better predictor of survival of localized osteosarcoma patients. Ann Surg Oncol. 2008;15(3):906–914. doi:10.1245/s10434-007-9779-818163171
- Bousquet M, Noirot C, Accadbled F. Whole-exome sequencing in osteosarcoma reveals important heterogeneity of genetic alterations. Ann Oncol. 2016;27(4):738–744. doi:10.1093/annonc/mdw00926787232
- Tao J, Jiang MM, Jiang L, et al. Notch activation as a driver of osteogenic sarcoma. Cancer Cell. 2014;26(3):390–401. doi:10.1016/j.ccr.2014.07.02325203324
- Rickel K, Fang F, Tao J. Molecular genetics of osteosarcoma. Bone. 2017;102:69–79. doi:10.1016/j.bone.2016.10.01727760307
- Kim H, Zheng S, Amini SS, et al. Whole-genome and multisector exome sequencing of primary and post-treatment glioblastoma reveals patterns of tumor evolution. Genome Res. 2015;25(3):316–327. doi:10.1101/gr.180612.11425650244
- Han G, Wang Y, Bi W. C-Myc overexpression promotes osteosarcoma cell invasion via activation of MEK-ERK pathway. Oncol Res. 2012;20(4):149–156. doi:10.3727/096504012X1352222723223723461061
- Chen D, Zhao Z, Huang Z, et al. Super enhancer inhibitors suppress MYC driven transcriptional amplification and tumor progression in osteosarcoma. Bone Res. 2018;6:11. doi:10.1038/s41413-018-0009-829644114
- Harting MT, Blakely ML. Management of osteosarcoma pulmonary metastases. Semin Pediatr Surg. 2006;15(1):25–29. doi:10.1053/j.sempedsurg.2005.11.00516458843
- Feng W, Dean DC, Hornicek FJ, et al. Myc is a prognostic biomarker and potential therapeutic target in osteosarcoma. Ther Adv Med Oncol. 2020;12:1758835920922055. doi:10.1177/175883592092205532426053
- Alldinger I, Schaefer KL, Goedde D, et al. Microsatellite instability in Ewing tumor is not associated with loss of mismatch repair protein expression. J Cancer Res Clin Oncol. 2007;133(10):749–759. doi:10.1007/s00432-007-0220-217530287
- Friedmann-Morvinski D, Verma IM. Dedifferentiation and reprogramming: origins of cancer stem cells. EMBO Rep. 2014;15(3):244–253. doi:10.1002/embr.20133825424531722
- Ge Y, Gomez NC, Adam RC, et al. Stem Cell Lineage Infidelity Drives Wound Repair and Cancer. Cell. 2017;169(4):636–50 e14. doi:10.1016/j.cell.2017.03.04228434617
- Shibue T, Weinberg RA. EMT, CSCs, and drug resistance: the mechanistic link and clinical implications. Nat Rev Clin Oncol. 2017;14(10):611–629. doi:10.1038/nrclinonc.2017.4428397828
- Murphy G. The ADAMs: signalling scissors in the tumour microenvironment. Nat Rev Cancer. 2008;8(12):929–941. doi:10.1038/nrc245919005493
- Lorenzen I, Trad A, Grotzinger J. Multimerisation of A disintegrin and metalloprotease protein-17 (ADAM17) is mediated by its EGF-like domain. Biochem Biophys Res Commun. 2011;415(2):330–336. doi:10.1016/j.bbrc.2011.10.05622033402
- Le Gall SM, Bobe P, Reiss K, et al. ADAMs 10 and 17 represent differentially regulated components of a general shedding machinery for membrane proteins such as transforming growth factor alpha, L-selectin, and tumor necrosis factor alpha. Mol Biol Cell. 2009;20(6):1785–1794. doi:10.1091/mbc.e08-11-113519158376
- Xu M, Zhou H, Zhang C, et al. ADAM17 promotes epithelial-mesenchymal transition via TGF-beta/Smad pathway in gastric carcinoma cells. Int J Oncol. 2016;49(6):2520–2528. doi:10.3892/ijo.2016.374427779657
- Liu HB, Yang QC, Shen Y, Zhu Y, Zhang XJ, Chen H. Clinicopathological and prognostic significance of the expression of ADAM17 mRNA and protein in esophageal squamous cell carcinoma. Zhonghua Zhong Liu Za Zhi. 2013;35(5):361–365. doi:10.3760/cma.j.issn.0253-3766.2013.05.00924054013
- Shou ZX, Jin X, Zhao ZS. Upregulated expression of ADAM17 is a prognostic marker for patients with gastric cancer. Ann Surg. 2012;256(6):1014–1022. doi:10.1097/SLA.0b013e3182592f5622668812
- Sun J, Jiang J, Lu K, Chen Q, Tao D, Chen Z. Therapeutic potential of ADAM17 modulation in gastric cancer through regulation of the EGFR and TNF-alpha signalling pathways. Mol Cell Biochem. 2017;426(1–2):17–26. doi:10.1007/s11010-016-2877-927878499
- Massari ME, Murre C. Helix-loop-helix proteins: regulators of transcription in eucaryotic organisms. Mol Cell Biol. 2000;20(2):429–440. doi:10.1128/MCB.20.2.429-440.200010611221
- Tsung AJ, Guda MR, Asuthkar S, et al. Methylation regulates HEY1 expression in glioblastoma. Oncotarget. 2017;8(27):44398–44409. doi:10.18632/oncotarget.1789728574840
- Roma J, Masia A, Reventos J. Notch pathway inhibition significantly reduces rhabdomyosarcoma invasiveness and mobility in vitro. Clin Cancer Res. 2011;17(3):505–513. doi:10.1158/1078-0432.CCR-10-016621177409
- Jia D, Wei L, Guo W, et al. Genome-wide copy number analyses identified novel cancer genes in hepatocellular carcinoma. Hepatology. 2011;54(4):1227–1236. doi:10.1002/hep.2449521688285
- Rettig EM, Bishop JA, Agrawal N, et al. HEY1 is expressed independent of NOTCH1 and is associated with poor prognosis in head and neck squamous cell carcinoma. Oral Oncol. 2018;82:168–175. doi:10.1016/j.oraloncology.2018.05.01729909892
- Forghanifard MM, Taleb S, Abbaszadegan MR. Notch Signaling Target Genes are Directly Correlated to Esophageal Squamous Cell Carcinoma Tumorigenesis. Pathol Oncol Res. 2015;21(2):463–467. doi:10.1007/s12253-014-9849-825361534
- Jiang S, Zhou F, Zhang Y, et al. Identification of tumorigenicity-associated genes in osteosarcoma cell lines based on bioinformatic analysis and experimental validation. J Cancer. 2020;11(12):3623–3633. doi:10.7150/jca.3739332284759
- Tsuru A, Setoguchi T, Matsunoshita Y, et al. Hairy/enhancer-of-split related with YRPW motif protein 1 promotes osteosarcoma metastasis via matrix metallopeptidase 9 expression. Br J Cancer. 2015;112(7):1232–1240. doi:10.1038/bjc.2015.8425742474