
Abstract
Purpose
Clear cell renal cell carcinoma (ccRCC) is highly heterogeneous and is one of the most lethal types of cancer within the urinary system. Aberrant expression of 5-methylcytosine (m5C) RNA methylation regulators has been shown to result in occurrence and progression of tumors. However, the role of these regulators in ccRCC remains unclear.
Materials and Methods
We extracted RNA sequencing expression data with corresponding clinical information of patients with ccRCC from The Cancer Genome Atlas (TCGA) database. We then compared the expression profiles of m5C RNA methylation regulators between normal and ccRCC tissues, and determined different subtypes through consensus clustering analysis. In addition, we constructed a prognostic signature and evaluated it using a range of bioinformatics approaches. The expression of signature-related genes was subsequently verified in the clinical samples using qRT-PCR.
Results
We identified 12 differentially expressed m5C RNA methylation regulators between cancer and normal control samples. Two clusters of patients with ccRCC and diverse clinicopathological characteristics and prognoses were then determined through consensus clustering analysis. Functional annotations revealed that m5C RNA regulators were significantly correlated with the ccRCC progression. Moreover, we constructed a four-gene risk score signature (comprised of NOP2, NSUN4, NSUN6, and TET2) and divided the patients with ccRCC into high- and low-risk groups based on the median risk score. The risk score was associated with clinicopathological features and was an independent prognostic indicator of ccRCC. Our stratified analysis results suggest that the signature has high prognostic value. Based on qRT-PCR results, the NOP2 and NSUN4 mRNA expressions were higher and those of NSUN6 and TET2 were lower in ccRCC tissues than in normal tissues.
Conclusion
Our results demonstrate that m5C RNA methylation regulators may affect ccRCC progression and could be exploited for diagnostic and prognostic purposes.
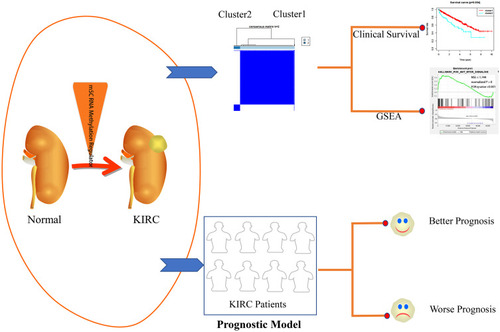
Graphical Abstract
Introduction
As one of the top ten most common cancers worldwide, renal cell carcinoma (RCC) accounts for approximately 5% and 3% of the overall cancer cases in men and women, respectively.Citation1,Citation2 Clear cell RCC (ccRCC), the most frequent and aggressive form of RCC in adults (comprising approximately 80% of cases), has been associated with an increased risk of recurrence and a worse prognosis than other subtypes.Citation3 Although most ccRCCs are diagnosed at early stages, nearly 20% of cases harbor metastases at initial diagnosis and present a decreased 5-year expected survival (approximately 10% survival).Citation4–Citation6 Remarkable progress has been made in surgery, radiotherapy, chemotherapy, targeted therapy, and immunotherapy, and the treatment of ccRCC has improved to a certain degree. However, the treatment’s clinical efficiency and patient outcomes have not improved significantly; and, approximately 30% to 40% of patients with localized ccRCC develop metastatic recurrence during the follow-up after surgical resection.Citation7 Thus, diagnostic markers and molecular targets for individualized therapy and early diagnosis are urgently needed.
Researchers have started to explore the roles of reversible RNA modifications in the post-transcriptional regulation of gene expression.Citation8 Compared with DNA epigenetic regulations (a well-recognized and widely studied epigenetic phenomenon), 5-methylcytosine (m5C) in mRNA remains understudied.Citation9,Citation10 m5C is a highly abundant RNA modification detected in various RNA species, including messenger RNAs (mRNAs), transfer RNAs (tRNAs), ribosomal RNAs (rRNAs), enhancer RNAs (eRNAs), and a number of non-coding RNAs (ncRNAs).Citation11–Citation13 Studies have revealed that m5C participates in gene expression during the modulation of pre-mRNA splicing and during RNA export, translation, stabilization, and localization.Citation13,Citation14 At the post-transcriptional level, m5C RNA modifications can be dynamically regulated by three groups of genes (“writers,” “erasers,” and “readers”), encoding methyltransferases, demethylases, and binding proteins, respectively.Citation12 “Writers” (including NSUN1-7, DNMT1, DNMT2, DNMT3A, and DNMT3B) regulate RNA methylation modification processes. The “eraser” TET2 has m5C demethylation activity to remove the m5C modification. Finally, ALYREF, an m5C “reader,” recognizes and binds to m5C sites on target mRNAs.Citation14,Citation15 Increasing amounts of evidence have demonstrated that m5C dysregulation affects the pathogenesis of many human diseases including cancers. For example, NSUN2 exhibits significant roles in tumor metastasis and drug resistance by methylating NMR ncRNA in esophageal squamous cell carcinoma.Citation16 Sun et al revealed that lncRNA-hPVT1 up-regulates the expression of NOP2 by enhancing NOP2 protein stability; and then, it promotes cell proliferation, stemness-like properties, and tumorigenesis in hepatocellular carcinoma cells.Citation17 However, the specific signature and corresponding prognostic value of m5C in ccRCC remain unknown. Clarifying the biological role of these regulators in ccRCC may help identify effective markers for early diagnosis and therapeutic treatment.
To understand the potential roles of m5C RNA regulators in ccRCC, we conducted a comprehensive study on the expression profile of 13 extensively reported m5C RNA methylation regulators with RNA sequencing data from The Cancer Genome Atlas (TCGA). We then identified a four-gene signature of m5C regulators that has prognostic value to effectively predict the outcomes of patients with ccRCC. In addition, qRT-PCR data were used to verify the choice of genes. Overall, our study provides a reliable foundation for detecting new biomarkers and constructing prognostic signatures for early ccRCC detection and clinical outcome prediction.
Materials and Methods
Data Acquisition
The RNA-seq expression data, together with corresponding clinical information of ccRCC tissues and normal tissues were downloaded from the TCGA database (https://cancergenome.nih.gov/).Citation18 We normalized RNA expression profiles using Log2-based transformation. After data integration and elimination of clinical samples with missing data, we included 517 ccRCC and 72 non-tumor tissues for further analyses.
Differentially-Expressed m5C RNA Regulators Between ccRCC and Normal Tissues
We identified candidate m5C RNA regulators from the published literature. NOP2, NSUN 2–7, DNMT1, TRDMT1, DNMT3A, and DNMT3B were considered “writers”; and ALYREF and TET2 were identified as “readers” and “erasers,” respectively. We abstracted the expression matrix of these 13 genes from 517 ccRCC and 72 normal samples with clinical information in the TCGA project. Next, the differentially-expressed m5C RNA methylation regulators were identified by comparing ccRCC tissues with noncancerous kidney tissues in R under the cut-off criteria of P < 0.05. Subsequently, we visualized the distinct expression patterns of m5C RNA regulators between the two groups on a heatmap and a violin plot.
Interaction and Correlation Analyses Among the m5C RNA Regulators
We identified protein-protein interactions (PPI) among the 13 m5C RNA regulators using the STRING database (http://string.embl.de/).Citation19 The correlation among these genes was calculated based on a Pearson correlation analysis in R.
Consensus Clustering Analysis of m5C RNA Regulators
To explore the function of m5C RNA methylation regulators in ccRCC, we identified two clusters by consensus expression of these regulators using the “ConsensusClusterPlus” R package (50 iterations, 80% resample rate).Citation20 We assessed the expression profiles among various ccRCC patient clusters by performing a Principal Component Analysis (PCA) and visualized them with the “ggplot2” package.Citation21 The survival and clinical correlation analysis between different clusters were evaluated using Kaplan–Meier analysis and chi-square tests, respectively.
Functional Enrichment Analysis
Gene Ontology (GO) analysis was performed to analyze the main function of differentially-expressed genes (DEGs) in the different clusters using the Metascape database (http://metascape.org/).Citation22 Moreover, the underlying biological DEG pathways in the different clusters were explored by the Kyoto Encyclopedia of Genes and Genomes (KEGG) database in R. We then applied a Gene Set Enrichment Analysis (GSEA) to evaluate the functions related to the different ccRCC clusters. GSEA was carried out using the GSEA software (http://software.broadinstitute.org/gsea) with the MSigDB H: Hallmark gene set collection.Citation23 The significant results were identified using these criteria: a nominal P value lower than 0.05 and a false discovery rate (FDR) lower than 0.25.
Construction and Validation of the Prognostic Signature
The 517 patients with ccRCC were randomized into training (n = 312) and testing (n = 205) cohorts from the TCGA project following a ratio of 6 to 4. Univariate Cox regression analysis was conducted on each differentially-expressed m5C RNA methylation regulators to screen for genes that were closely related to the overall survival (OS) of patients with ccRCC in the training cohort. Then, multivariate logistic regression analyses were performed according to the Akaike information criterion (AIC), and we considered the model with the smallest AIC as the best fitting model to predict the outcomes of patients.Citation24 We constructed the prognostic signature according to a linear combination of the selected mRNA expression level multiplied by regression coefficients derived from the multivariate Cox regression model.
We subsequently categorized patients in the training cohort into high- and low-risk groups based on the mean risk score. We performed a Kaplan–Meier curve analysis and examined it using a Log rank test between two groups. The receiver operating characteristic (ROC) analysis served to assess the prognostic ability of the signature. Additionally, we conducted a multivariate Cox analysis to assess whether the signature-based risk score was independent of other clinical characteristics. The testing cohort was used to further test the performance of the signature in the same manner mentioned above.
Moreover, we conducted a hierarchical analysis based on clinical characteristics to further assess the impact of other factors on the prognostic value of high- and low-risk groups of the entire TCGA cohort. We also assessed the associations between the individual target gene expressions in our prognostic risk model and the clinical progression.
Quantitative Real-Time PCR (qRT-PCR)
We obtained 18 pairs of fresh ccRCC and non-cancerous tissue samples from patients who had undergone surgery in Meizhou People’s Hospital (Huangtang Hospital) from January 2020 to January 2021. The Ethics Committee of the Meizhou People’s Hospital (Huangtang Hospital) approved the study and the patients with ccRCC involved in the study signed informed consents. We verified the expression levels of hub genes via qRT-PCR. Briefly, total RNA was extracted with Trizol reagent (Invitrogen, Carlsbad, CA, USA) and cDNA was synthesized using the PrimeScript RT Reagent Kit (TaKaRa, Shiga, Japan) according to the manufacturer’s instructions. qRT-PCR was performed on an Applied Biosystems 7500 Real-Time PCR Systems (Thermo Fisher Scientific Inc.) using SYBR GreenER Supermix (Invitrogen). We used the following PCR conditions: an initial melting step at 95°C for 1 min followed by 35 cycles at 95°C for 90 s, 60°C for 30 s, 72°C for 30 s, and a final extension at 72°C for 10 min. The target gene expressions were normalized to that of the β-actin gene and the relative expressions were analyzed using the 2−ΔΔCt method. The primers used in this study were designed by RuiBo (Guangzhou, Guangdong, China); lists their sequences.
Table 1 Primer Sequences Used for qRT-PCR in This Study
Results
Expression Differences of m5C RNA Methylation Rgulators Between ccRCC and Normal Samples
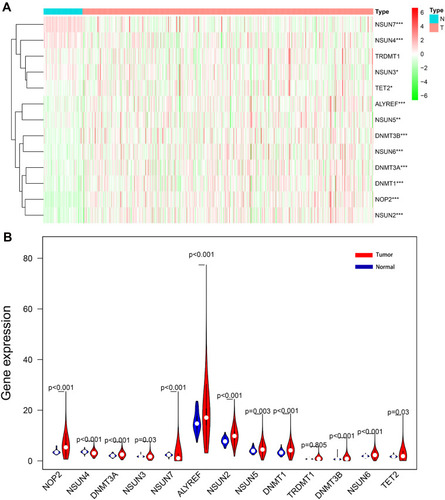
Considering the important biological functions of m5C RNA regulators in ccRCC tumorigenesis, we systematically compared the expression levels of 13 m5C RNA methylation regulators between tumor and normal tissues using TCGA data. The expression levels of most m5C RNA methylation regulators (NOP2, NSUN2, NSUN5, NSUN6, DNMT1, DNMT3A, DNMT3B, and ALYREF) were significantly higher in tumors than in healthy control samples (P < 0.05) (). The expression levels of NSUN3, NSUN4, NSUN7, and TET2 in cancerous tissues were significantly down-regulated (P < 0.05), and we found similar expression levels of TRDMT1 in both sample types.
Figure 1 Differentially-expressed m5C RNA methylation regulators between ccRCC and normal tissues. The heatmap (A) and the violin plot (B) show the differing expressions of m5C RNA methylation regulators between ccRCC and normal control samples. *P < 0.05, **P < 0.01, ***P < 0.001.
Association and Consensus Clustering Analysis of m5C RNA Methylation Regulators
To better study the biological impact of m5C RNA methylation regulators in the pathogenesis of ccRCC, we conducted a comprehensive analysis of the functions, interactions, and correlations among these regulators. According to their functions and interactions, we noticed that all the m5C RNA methylation regulators were associated with different methylation types. For example, NOP2, NSUN3, NSUN4, and NSUN5 participated mostly in rRNA methylation, while NSUN2, NSUN3, NSUN6, and TRDMT1 were primarily involved in tRNA methylation (). We then further analyzed correlations among these regulators using the Pearson correlation analysis (). These regulators demonstrated mainly a weak to moderate positive correlation, with the correlation between NSUN3 and TET2 (R = 0.7) being the strongest.
Figure 2 Association and consensus clustering analyses of m5C RNA methylation regulators. (A) Function and PPIs of 13 m5C RNA methylation regulators. (B) Correlations among 13 m5C RNA methylation regulators analyzed by Pearson correlation. (C) Consensus clustering matrix for k = 2. (D) PCA analysis indicating the distribution between two clusters. (E) Kaplan–Meier analysis for two clusters. (F) Clinicopathological features compared between the two clusters. **P < 0.01, ***P < 0.001.
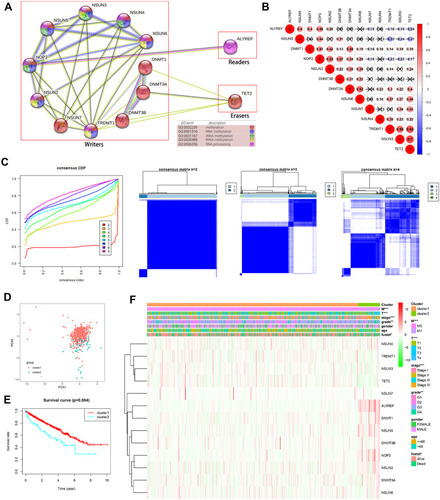
Considering the similar expressions of m5C RNA regulators in 517 patients with ccRCC in the TCGA database, we performed a consensus clustering analysis on the samples. We chose k= 4 as a suitable selection with clustering stability increasing from k = 2 to 9, but we found a highly significant overlap within each group. Hence, we divided these ccRCC samples into two clusters based on k = 2, cluster 1, and cluster 2 (). The results of our PCA analysis show that the samples were adequately divided into two distinct clusters, suggesting this was a reasonable choice (). Subsequently, we examined the association of clinical features between the two clusters. The survival analysis indicated that patients with ccRCC in cluster 2 had an association with worse survival outcomes than those in cluster 1 (). In addition, patients in cluster 2 also presented higher grades (P < 0.01) and AJCC (P < 0.001), T (P < 0.001), and M (P < 0.001) stages than those in cluster 1 (). The above finding suggests that the consensus clustering of m5C RNA methylation regulators is intimately involved in the clinicopathological characteristics and outcomes in ccRCC.
Functional Enrichment Analysis
To examine why patients in cluster 2 had a poorer prognosis than the others, we conducted a functional annotation of specific genes correlated with cluster 2. We determined that 874 genes were up-regulated (log2 FC > 2.0 and P < 0.05) and 1310 genes were down-regulated (log2 FC < −2.0 and P < 0.05) in cluster 2 relative to cluster 1. shows the top 20 significant enriched biological processes. Go analysis results suggested that oxidation-reduction processes, vasculature development, and transmembrane receptor protein tyrosine kinase signaling pathways are enriched in malignant-related biological processes and pathways. KEGG analysis results show that these up-regulated genes in cluster 2 are closely related to the malignancy-associated pathways, such as the PI3K-AKT signaling pathway ().
Figure 3 Function annotation of specific genes of the cluster 2 subtype. (A) Top 20 significantly enriched biological processes in the cluster 2 subtype. (B) KEGG pathway analysis. (C) GSEA analysis.
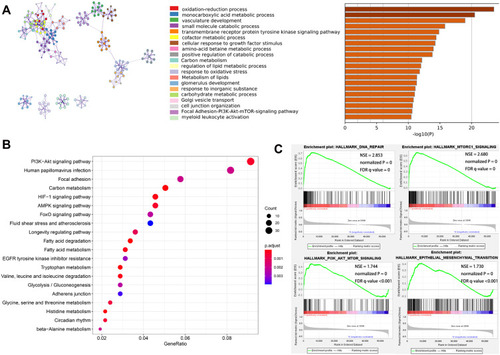
Subsequently, we used GSEA to explore the hallmarks associated with cluster 2. Our findings revealed many tumor hallmarks, including DNA repair (NSE = 2.853, normalized P = 0, FDR q-value = 0), MTORC1 signaling (NSE = 2.680, normalized P = 0, FDR q-value = 0), PI3K-AKT-mTOR signaling (NSE = 1.744, normalized P = 0, FDR q-value < 0.001), and epithelial mesenchymal transition signaling (NSE = 1.730, normalized P = 0, FDR q-value < 0.001), that are significantly correlated with cluster 2 (). These results indicate that the two clusters determined through consensus clustering are closely associated with the malignant progression of ccRCC.
Prognostic Value of m5C RNA Methylation Regulators and Construction of Prognostic Signature
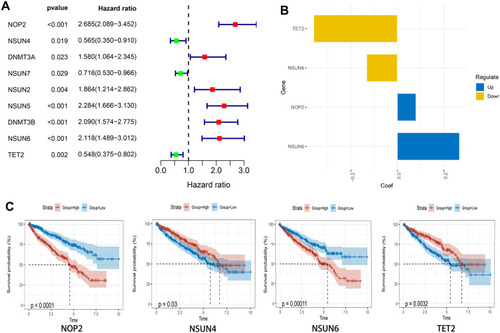
Considering the impact of the m5C RNA methylation regulators on the OS of patients with ccRCC, we investigated the prognostic value of m5C RNA regulators and we further screened the genes to construct a prognostic signature. Univariate Cox regression analysis revealed that 9 of 12 differentially-expressed m5C RNA methylation regulators were significantly associated within the training cohort (). Of these genes, NOP2, DNMT3A, NSUN2, NSUN5, DNMT3B, and NSUN6 are considered risk genes (HR > 1), while NSUN4, NSUN7, and TET2 are protective genes (HR < 1) for ccRCC. On the basis of the multivariate Cox model, we selected four genes with their coefficients () to construct the prognostic signature using the following computational formula: risk score = (0.0804 × NOP2 value) + (−0.1318 × NSUN4 value) + (0.2682 × NSUN6 value) + (−0.3593 × TET2 value). We classified patients with ccRCC into high- and low- expression groups based on the median expression of these four genes, and then compared the differences in OS between the two groups to define the role of each gene in ccRCC prognosis. The results show that all four m5C RNA methylation regulators are correlated with the OS ().
Figure 4 Construction of the prognostic signature using four m5C RNA methylation regulators. (A) Univariate Cox regression analysis between m5C RNA methylation regulators and survival data. (B) Coefficients of four m5C RNA methylation regulators. (C) Kaplan–Meier curves of each prognostic gene in the signature.
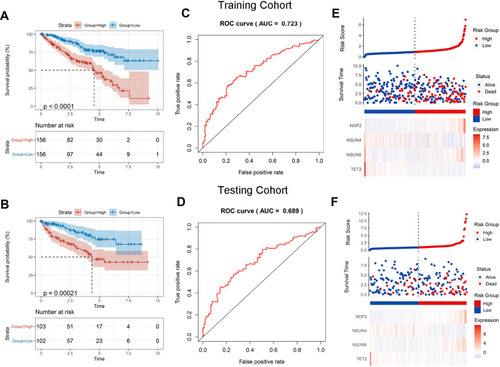
We assigned patients in both the training and testing cohorts into high- or low-risk groups according to the median risk score. The Kaplan–Meier curve analysis showed an obvious difference between the two groups, and the patients with ccRCC in the high-risk group had clearly shorter OSs than those in the low- risk group (). ROC curve analysis showed the AUCs of the signature in the training and testing cohorts to be 0.723 and 0.689, respectively (). In addition, we observed that the patients’ survival decreased and the deaths increased with risk score increases (). We generated a heatmap depicting the expression differences in the four prognostic genes between the two distinct prognostic patient groups. In patients with high-risk scores, the risk genes were upregulated and the protective genes were downregulated. However, these expression patterns were inverted in patients with low-risk scores.
Figure 5 Validation of four-gene prognostic signature. (A and B) Survival analysis in the training and testing cohorts. (C and D) ROC curves of the prognostic signature in the training and testing cohorts. (E and F) Four‐gene signature risk score distributions, patient survival results, and expression heatmap.
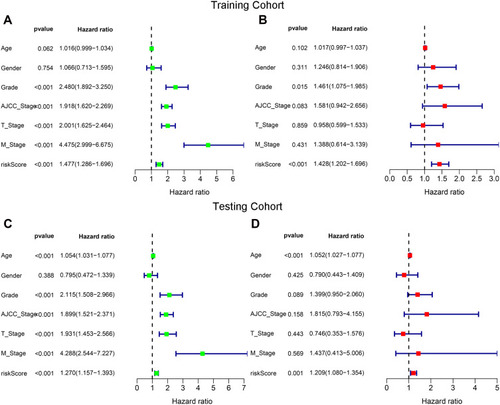
We used univariate and multivariate Cox regression analyses to examine whether the risk score was an independent prognostic variable in both the training and testing cohorts. In the univariate analysis, the prognosis of patients with ccRCC was correlated with the grade, the risk score, and the AJCC, T, and M stages (). The risk score remained significantly related to the OS (P < 0.001, ) in the multivariate analysis. Meanwhile, we further verified the independence of the prognostic signature in the testing cohort (). Our results indicate that the signature-based risk score might be an independent prognostic marker for ccRCC.
Figure 6 Determination of the independent prognostic factors through univariate and multivariate Cox regression analyses. The risk score was an independent prognostic factor in the training (A and B) and the testing (C and D) cohorts.
Role of the Prognostic Signature in Patients with ccRCC
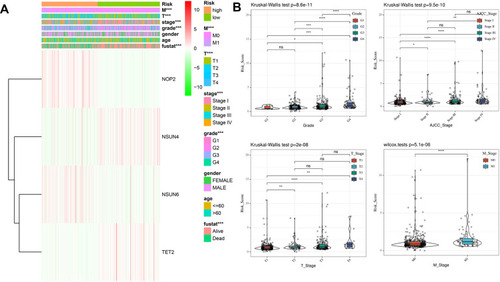
We assessed the association between the risk score and the clinical parameters in the entire TCGA cohort. We represented the expression profiles of the four screened m5C RNA regulators in high- and low-risk patients in a heatmap (). The results indicate that the patients with ccRCC in the high-risk group generally presented a higher proportion of NOP2 and NSUN6 expression, and a lower proportion of NSUN4 and TET2 expression than those in the low-risk group. We also found significant differences in the grades and the AJCC, T, and M stages between the two groups (all P < 0.001). However, the age and gender proportions were similar in the two groups. Thus, we explored the association between each clinicopathological characteristic and the risk scores. As expected, the risk scores were diverse in these groups compartmentalized by grade and AJCC, T, and M stages within the TCGA dataset (). The results show that the risk score identified by four m5C RNA methylation regulators was associated with the prognosis of patients with ccRCC.
Figure 7 Interrelation of the risk scores and clinicopathological characteristics in patients with ccRCC. (A) Heatmap showing the expression of four m5C RNA regulators and the distribution of clinicopathological variables between the high- and low-risk groups. (B) Associations between the risk scores and each clinicopathological characteristics. *P < 0.05, **P < 0.01, ***P < 0.001.
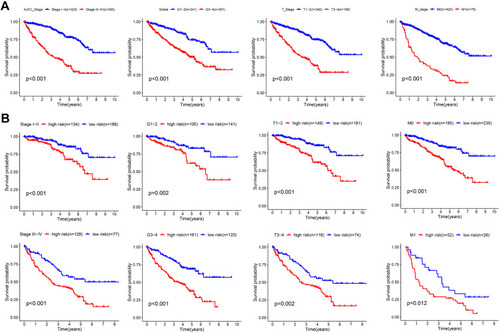
Considering the positive correlation between the risk score and the tumor progression, we conducted a Kaplan–Meier survival analysis to evaluate the prognostic value of the risk signature. As expected, advanced tumors (AJCC stages III and IV, grades 3 and 4, T staged 3 and 4, and M stage 1) presented shorter OSs than early tumors (AJCC stages I and II, grades 1 and 2, T stages 1 and 2, and M stage 0) (). Moreover, the stratification analysis for survival applied to precisely evaluate the survival outcomes, indicate that the patients with high-risk scores had significantly shorter OSs than those with low-risk scores ().
Figure 8 Kaplan–Meier survival curves stratified according to clinicopathological and risk scores. (A) Survival difference stratified according to different clinicopathological characteristics (grades and AJCC, T, and M stages). (B) Survival differences between high- and low-risk groups stratified according to clinicopathological characteristics.
Validation of the mRNA Expression of Four m5C RNA Methylation Regulators in Patients with ccRCC
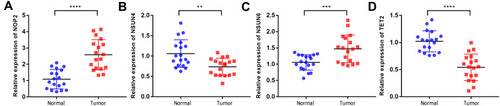
To explore the genes important for the development of the prognostic signature, we first evaluated the expressions of the four m5C RNA methylation regulators in 18 pairs in tissues. We found that NOP2 and NSUN6 had higher expressions in tumor tissues than in normal tissues, while NSUN4 and TET2 had lower expressions in tumor tissues () in agreement with our other findings.
Figure 9 mRNA expression patterns of four prognostic m5C RNA methylation regulators in ccRCC (A-D). mRNA expression patterns of four prognostic m5C RNA methylation regulators in 18 pairs of fresh ccRCC tissue and non-cancerous tissues. **P < 0.01, ***P < 0.001, ****P < 0.0001.
Discussion
Increasing evidence suggests that dysregulated aberrant RNA epigenetic modifications may function as oncogenes or tumor suppressors in carcinogenesis and cancer progression.Citation25,Citation26 Therefore, epigenetic regulators are promising diagnostic, prognostic, and predictive biomarkers for ccRCC. Some studies have focused on m5C DNA methylation genes in ccRCC that could serve as potential biomarkers for cancer diagnosis and prognosis.Citation27–Citation29 In this study, we concentrated on RNA epigenetic modifications exploring the expression profiles of m5C RNA methylation regulators to clarify their importance in ccRCC. The expressions of NSUN3, NSUN4, NSUN7, and TET2 were significantly lower in ccRCC tissues than in normal tissues, whereas the expressions of TRDMT1 were similar in both tissue types. The expression levels of eight other m5C RNA methylation regulators were higher in the ccRCC tissues than in the adjacent normal tissues.
By analyzing the expression of m5C RNA regulators from the TCGA database, we identified two subtypes of ccRCC differing in their clinicopathological characteristics and prognoses. In addition, an enrichment analysis showed significant DEGs between two clusters that were involved in tumor-related biological processes, signaling pathways, and hallmarks. We studied the potential carcinogenic mechanisms and pathways of these m5C RNA methylation regulators in ccRCC by conducting a KEGG analysis, the results agree with published data suggesting that the PI3K/AKT signaling pathway is involved in these mechanisms.Citation30,Citation31 A recent study demonstrated that the PI3K/AKT signaling pathway is implicated in proliferation and migration processes in ccRCC,Citation32 laying a theoretical foundation for further studies on the function of m5C RNA methylation regulators and the mechanisms underlying their regulatory effects. These findings confirm to some extent that m5C RNA methylation regulators participate in the progression of ccRCC.
The advent of next-generation sequencing technologies and the ability to comprehensively characterize the molecular basis of diseases have resulted in the clinical feasibility of precision medical treatments.Citation33 m5C-related gene signatures have comparable performances for predicting clinical prognoses of multiple solid tumors. For example, a two-gene m5C signature (DNMT1 and ALYREF) can effectively be used as a prognosis marker in patients with head and neck carcinoma.Citation34 A five-gene m5C signature (NOP2, NSUN4, NSUN5, NSUN6, and NSUN7) can accurately predict the overall survival and clinicopathological features of patients with glioma.Citation25 A molecular phenotype constructed with four m5C RNA methylation regulators (NSUN2, NSUN4, TET2, and ALYREF) is an independent risk factor for the prognosis of lung adenocarcinoma.Citation35 Thus, we constructed a prognostic signature for ccRCC using Cox regression models based on the features of m5C RNA methylation regulators (NOP2, NSUN4, NSUN6, and TET2). Notably, our proposed four-gene risk signature was able to successfully identify high- and low-risk populations in the training and testing cohorts to precisely predict clinical outcomes. Multivariate Cox regression analysis results further indicate that the prognostic signature-based risk score may be used as an independent prognostic marker for patients with ccRCC.
Published evidence has shown that these four genes are associated with the pathogenesis of many tumors. The expression of NOP2 has been reported to be upregulated in various types of cancer, including in lung adenocarcinoma,Citation36 breast carcinoma,Citation37 and prostate cancer,Citation38 and a high expression level is associated with poor clinical outcomes. Previous studies have indicated that overexpression of NOP2 (also named NSUN1 or p120) promote mouse fibroblast proliferation.Citation15,Citation39 In addition, Uchiyama et al found that NOP2 can be a biomarker for proliferation in human lung cancer cells, and that it plays an important role in tumor proliferation through cell cycle regulation.Citation40 Thus, NOP2 may serve as a prognostic biomarker reflecting cancer aggressiveness.
Studies have described NSUN4 as a protein with dual functions required for 12S rRNA methylation and interacting with MTERF4 to facilitate monosome assembly.Citation41 However, the mechanisms associating NSUN4 with tumors remain unclear.
NSUN6-targeted mRNAs are abundant and have high translation rates. The expression levels of NSUN6 are significantly down-regulated in several tumors in comparison with their expression in normal tissues.Citation42 Functionally, NSUN6 overexpression remarkably inhibits the proliferation of liver cancer cells.Citation43 However, a recent study demonstrated that NSUN6 plays an important role in bone metastasis via the methylation of Hippo/MST1 and consequent activation of YAP.Citation44 These results indicate that NUSN6 plays distinct roles in different types of tumors.
TET2 has been implicated in numerous biological processes and is dysregulated in a number of cancers. Loss of function analyses have revealed the capacity of TET2 to inhibit the general proliferation and migratory capacity of cancer cells.Citation45 The TET2 protein is generally down-regulated in hepatocellular carcinoma and this is associated with poor prognoses.Citation46 In addition, Xu et al found that loss of TET activity functionally inactivates the IFN-γ/JAK/STAT/signaling pathway and confers solid tumor resistance to anti–PD-1/PD-L1 therapy.Citation47
In our study, we noticed similarities related to those genes between the findings described by others and our own results. We used RT-qPCR to verify the expression levels of the four m5C RNA methylation regulators in 18 pairs of fresh ccRCC and non-cancerous tissue samples. To the best of our knowledge, ours is the first study to investigate the associations between these gene expressions and ccRCC clinicopathological characteristics and prognosis, providing a basis for further exploration of the molecular mechanisms involved. However, some aspects related to our study results need to be improved. First, additional fundamental experimental studies are necessary to pinpoint the detailed mechanisms of these four m5C RNA regulators. Second, external validation in multicenter cohorts need to demonstrate the reliability of our proposed prognostic signature.
Conclusion
In all, our study described for the first time the expression profiles of m5C RNA methylation regulators in ccRCC using bioinformatics methods. In addition, we constructed an m5C RNA methyltransferase-related signature comprised of four genes (NOP2, NSUN4, NSUN6, and TET2), which we showed to be significantly related to the clinical prognosis and clinicopathological features and is also an independent prognostic marker in ccRCC. Therefore, our findings have clinical significance, enhance our understanding of ccRCC pathogenesis, and may help guide diagnoses, clinical treatments, and prognoses in the future.
Abbreviations
ccRCC, clear cell renal cell carcinoma; TCGA, The Cancer Genome Atlas; m5C, 5-methylcytosine; PCA, principal components analysis; GO, Gene Ontology; KEGG, Kyoto Encyclopedia of Genes and Genomes database; GSEA, Gene Set Enrichment Analysis; OS, overall survival; ROC, receiver operating characteristic; qRT-PCR, Quantitative Real-Time Polymerase Chain Reaction.
Ethics Statement
The Ethics Committee of the Meizhou People’s Hospital (Huangtang Hospital), Meizhou, China ensured all sample information was kept confidential. The use of all human samples in this study adhered to the principles of the Declaration of Helsinki.
Author Contributions
All authors made a significant contribution to the work reported, whether that is in the conception, study design, execution, acquisition of data, analysis and interpretation, or in all these areas; took part in drafting, revising or critically reviewing the article; gave final approval of the version to be published; have agreed on the journal to which the article has been submitted; and agree to be accountable for all aspects of the work.
Disclosure
The authors report no conflicts of interest in this work.
References
- SiegelRL, MillerKD, JemalA. Cancer statistics, 2020. CA Cancer J Clin. 2020;70(1):7–30. doi:10.3322/caac.2159031912902
- WangJ, LiX, WuX, et al. Role of immune checkpoint inhibitor-based therapies for metastatic renal cell carcinoma in the first-line setting: a Bayesian network analysis. EBioMedicine. 2019;47:78–88. doi:10.1016/j.ebiom.2019.08.006.31439476
- HakimiAA, VossMH, KuoF, et al. Transcriptomic profiling of the tumor microenvironment reveals distinct subgroups of clear cell renal cell cancer: data from a randomized phase III Trial. Cancer Discov. 2019;9(4):510–525. doi:10.1158/2159-8290.cd-18-095730622105
- MotzerRJ, JonaschE, AgarwalN, et al. Kidney cancer, version 2.2017, NCCN clinical practice guidelines in oncology. J Natl Compr Canc Netw. 2017;15(6):804–834. doi:10.6004/jnccn.2017.010028596261
- LiJK, ChenC, LiuJY, et al. Long noncoding RNA MRCCAT1 promotes metastasis of clear cell renal cell carcinoma via inhibiting NPR3 and activating p38-MAPK signaling. Mol Cancer. 2017;16(1):111. doi:10.1186/s12943-017-0681-0.28659173
- SunZ, JingC, XiaoC, LiT. Long Non-Coding RNA Profile Study Identifies an Immune-Related lncRNA Prognostic Signature for Kidney Renal Clear Cell Carcinoma. Front Oncol. 2020;10:1430. doi:10.3389/fonc.2020.0143032974157
- MiaoD, MargolisCA, GaoW, et al. Genomic correlates of response to immune checkpoint therapies in clear cell renal cell carcinoma. Science. 18;359(6377):801–806. doi:10.1126/science.aan5951
- HeC. Grand challenge commentary: RNA epigenetics?Nat Chem Biol. 2010;6(12):863–865. doi:10.1038/nchembio.48221079590
- CaoQ, ManiRS, AteeqB, et al. Coordinated regulation of polycomb group complexes through microRNAs in cancer. Cancer Cell. 2011;20(2):187–199. doi:10.1016/j.ccr.2011.06.01621840484
- HussainS, AleksicJ, BlancoS, DietmannS, FryeM. Characterizing 5-methylcytosine in the mammalian epitranscriptome. Genome Biol. 2013;14(11):215. doi:10.1186/gb414324286375
- SquiresJE, PatelHR, NouschM, et al. Widespread occurrence of 5-methylcytosine in human coding and non-coding RNA. Nucleic Acids Res. 2012;40(11):5023–5033. doi:10.1093/nar/gks14422344696
- TrixlL, LusserA. The dynamic RNA modification 5-methylcytosine and its emerging role as an epitranscriptomic mark. Wiley Interdiscip Rev RNA. 2019;10(1):e1510. doi:10.1002/wrna.151030311405
- BohnsackKE, HöbartnerC, BohnsackMT. Eukaryotic 5-methylcytosine (m5C) RNA Methyltransferases: mechanisms, Cellular Functions, and Links to Disease. Genes. 2019;10(2):102. doi:10.3390/genes10020102
- HuangT, ChenW, LiuJ, GuN, ZhangR. Genome-wide identification of mRNA 5-methylcytosine in mammals. Nat Struct Mol Biol. 2019;26(5):380–388. doi:10.1038/s41594-019-0218-x31061524
- NombelaP, Miguel-LópezB, BlancoS. The role of m(6)A, m(5)C and Ψ RNA modifications in cancer: novel therapeutic opportunities. Mol Cancer. 2021;20(1):18. doi:10.1186/s12943-020-01263-w33461542
- LiY, LiJ, LuoM, et al. Novel long noncoding RNA NMR promotes tumor progression via NSUN2 and BPTF in esophageal squamous cell carcinoma. Cancer Lett. 18;430:57–66. doi:10.1016/j.canlet.2018.05.013
- WangF, YuanJH, WangSB, et al. Oncofetal long noncoding RNA PVT1 promotes proliferation and stem cell-like property of hepatocellular carcinoma cells by stabilizing NOP2. Hepatology. 2014;60(4):1278–1290. doi:10.1002/hep.2723925043274
- TomczakK, CzerwińskaP, WiznerowiczM. The Cancer Genome Atlas (TCGA): an immeasurable source of knowledge. Contemp Oncol. 2015;19(1a):A68–77. doi:10.5114/wo.2014.47136
- von MeringC, HuynenM, JaeggiD, SchmidtS, BorkP, SnelB. STRING: a database of predicted functional associations between proteins. Nucleic Acids Res. 2003;31(1):258–261. doi:10.1093/nar/gkg03412519996
- WilkersonMD, HayesDN. ConsensusClusterPlus: a class discovery tool with confidence assessments and item tracking. Bioinformatics. 2010;26(12):1572–1573. doi:10.1093/bioinformatics/btq17020427518
- WickhamH. Ggplot2: Elegant Graphics for Data Analysis. New York, USA; 2009.
- ZhouY, ZhouB, PacheL, et al. Metascape provides a biologist-oriented resource for the analysis of systems-level datasets. Nat Commun. 2019;10(1):1523. doi:10.1038/s41467-019-09234-630944313
- SubramanianA, TamayoP, MoothaVK, et al. Gene set enrichment analysis: a knowledge-based approach for interpreting genome-wide expression profiles. Proc Natl Acad Sci U S A. 2005;102(43):15545–15550. doi:10.1073/pnas.050658010216199517
- SunY, XuZ, JiangJ, XuT, XuJ, LiuP. High Expression of Succinate Dehydrogenase Subunit A Which Is Regulated by Histone Acetylation, Acts as a Good Prognostic Factor of Multiple Myeloma Patients. Front Oncol. 2020;10:563666. doi:10.3389/fonc.2020.56366633014881
- WangP, WuM, TuZ, et al. Identification of RNA: 5-Methylcytosine Methyltransferases-Related Signature for Predicting Prognosis in Glioma. Front Oncol. 2020;10:1119. doi:10.3389/fonc.2020.0111932974125
- SunZ, JingC, XiaoC, LiT, WangY. Prognostic risk signature based on the expression of three m6A RNA methylation regulatory genes in kidney renal papillary cell carcinoma. Aging. 2020;12(21):22078–22094. doi:10.18632/aging.10405333177247
- Gama-SosaMA, SlagelVA, TrewynRW, et al. The 5-methylcytosine content of DNA from human tumors. Nucleic Acids Res. 1983;11(19):6883–6894. doi:10.1093/nar/11.19.68836314264
- DaiX, GonzalezG, LiL, et al. YTHDF2 Binds to 5-Methylcytosine in RNA and Modulates the Maturation of Ribosomal RNA. Anal Chem. 2020;92(1):1346–1354. doi:10.1021/acs.analchem.9b0450531815440
- ChenK, ZhangJ, GuoZ, et al. Loss of 5-hydroxymethylcytosine is linked to gene body hypermethylation in kidney cancer. Cell Res. 2016;26(1):103–18. doi:10.1038/cr.2015.15026680004
- XiangS, MaY, ShenJ, et al. m(5)C RNA Methylation Primarily Affects the ErbB and PI3K-Akt Signaling Pathways in Gastrointestinal Cancer. Front Mol Biosci. 2020;7:599340. doi:10.3389/fmolb.2020.59934033365328
- SunZ, XueS, XuH, et al. Expression profiles of long noncoding RNAs associated with the NSUN2 gene in HepG2 cells. Mol Med Rep. 2019;19(4):2999–3008. doi:10.3892/mmr.2019.998430816500
- ZhuQ, ZhongAL, HuH, et al. Acylglycerol kinase promotes tumour growth and metastasis via activating the PI3K/AKT/GSK3β signalling pathway in renal cell carcinoma. J Hematol Oncol. 2020;13(1):2. doi:10.1186/s13045-019-0840-431900208
- ChiaS, LowJL, ZhangX, et al. Phenotype-driven precision oncology as a guide for clinical decisions one patient at a time.. Nat Commun. 2017;8(1):435. doi:10.1038/s41467-017-00451-528874669
- XueM, ShiQ, ZhengL, LiQ, YangL, ZhangY. Gene signatures of m5C regulators may predict prognoses of patients with head and neck squamous cell carcinoma. Am J Transl Res. 2020;12(10):6841–6852.33194076
- SunL, LiuWK, DuXW, et al. Large-scale transcriptome analysis identified RNA methylation regulators as novel prognostic signatures for lung adenocarcinoma. Ann Transl Med. 2020;8(12):751. doi:10.21037/atm-20-374432647676
- SaijoY, SatoG, UsuiK, et al. Expression of nucleolar protein p120 predicts poor prognosis in patients with stage I lung adenocarcinoma. Ann Oncol. 2001;12(8):1121–1125. doi:10.1023/a:101161770799911583194
- FreemanJW, McGrathP, BondadaV, et al. Prognostic significance of proliferation associated nucleolar antigen P120 in human breast carcinoma. Cancer Res. 1991;51(8):1973–1978.1672621
- SunF, WuK, YaoZ, et al. Long noncoding RNA LINC00963 induces NOP2 expression by sponging tumor suppressor miR-542-3p to promote metastasis in prostate cancer. Aging. 2020;12(12):11500–11516. doi:10.18632/aging.10323632554858
- PerlakyL, ValdezBC, BuschRK, et al. Increased growth of NIH/3T3 cells by transfection with human p120 complementary DNA and inhibition by a p120 antisense construct. Cancer Res. 1992;52(2):428–436.1728415
- UchiyamaB, SaijoY, KumanoN, et al. Expression of nucleolar protein p120 in human lung cancer: difference in histological types as a marker for proliferation. Clin Cancer Res. 1997;3(10):1873–1877.9815576
- MetodievMD, SpåhrH, Loguercio PolosaP, et al. NSUN4 is a dual function mitochondrial protein required for both methylation of 12S rRNA and coordination of mitoribosomal assembly. PLoS Genet. 2014;10(2):e1004110. doi:10.1371/journal.pgen.100411024516400
- SelmiT, HussainS, DietmannS, et al. Sequence- and structure-specific cytosine-5 mRNA methylation by NSUN6. Nucleic Acids Res. 2021;49(2):1006–1022. doi:10.1093/nar/gkaa119333330931
- WangZL, LiB, LuoYX, et al. Comprehensive Genomic Characterization of RNA-Binding Proteins across Human Cancers. Cell Rep. 18;22(1):286–298. doi:10.1016/j.celrep.2017.12.035
- LiC, WangS, XingZ, et al. A ROR1-HER3-lncRNA signalling axis modulates the Hippo-YAP pathway to regulate bone metastasis. Nat Cell Biol. 2017;19(2):106–119. doi:10.1038/ncb346428114269
- NeriF, DettoriD, IncarnatoD, et al. TET1 is a tumour suppressor that inhibits colon cancer growth by derepressing inhibitors of the WNT pathway. Oncogene. 2015;34(32):4168–4176. doi:10.1038/onc.2014.35625362856
- JinZ, FengH, LiangJ, et al. FGFR3(Δ7-9) promotes tumor progression via the phosphorylation and destabilization of ten-eleven translocation-2 in human hepatocellular carcinoma. Cell Death Dis. 2020;11(10):903. doi:10.1038/s41419-020-03089-233097695
- XuYP, LvL, LiuY, et al. Tumor suppressor TET2 promotes cancer immunity and immunotherapy efficacy. J Clin Invest. 2019;129(10):4316–4331. doi:10.1172/jci12931731310587