
Abstract
Purpose
For better understanding of radiotherapy resistance and its potential mechanism.
Methods
We established radioresistance cell lines of non-small cell lung cancer (NSCLC) followed by microarray analysis. 529 differentially expressed genes (DEGs) were then screened between radiation resistant cell lines compared with the sensitive cell lines. The biological functions and enrichment pathways of the above DEGs were identified using Kyoto Encyclopedia of Genes and Genomes (KEGG) and gene ontology (GO) enrichment analyses. Gene Set Enrichment Analysis (GSEA) revealed that the radiation resistance group had the most gene sets enriched in altered immune response, such as TNF signaling pathway, when compared to the radiation sensitive group. Protein-protein interaction (PPI) network was carried out through the STRING database, and then five hub genes (CXCL10, IFIH1, DDX58, CXCL11, RSAD2) were screened by Cytoscape software. RT-PCR confirmed the expression of the above hub genes. ChIP-X Enrichment Analysis showed that STAT1 might be the transcription factor of the above hub genes. Considering that PD-L1 could be activated by STAT1 in a variety of tumors and ultimately lead to immune exhaustion, RT-PCR and Western blot verified the expression level of PD-L1.
Results
Five hub genes (CXCL10, IFIH1, DDX58, CXCL11, RSAD2) were screened and verified to be highly expressed in radioresistance group, STAT1 might be the transcription factor of the above hub genes. Our study found that the expression level of PD-L1 was increased after radiotherapy resistance.
Conclusion
Although immune system activation occurs followed by radiation resistance, we hypothesized that the upregulation of PD-L1 expression caused by STAT1 activation might be one of the mechanisms of radiotherapy resistance.
Keywords:
Introduction
Lung cancer is one of the most common and lethal cancers worldwide. Compared with small cell lung cancer (SCLC), the proportion of NSCLC is even higher. Therefore, improving the existing treatment regimen as well as improving survival rate of patients with NSCLC has become the focus of tumor prevention and treatment. Radiotherapy is still one of the preferred treatment options for advanced NSCLC. However, as NSCLC patients are usually accompanied by varying degrees of radiotherapy resistance, which limits the efficacy of tumor radiotherapy, and thus radioresistance has become one of the primary causes for the treatment failure of NSCLC patients. Hence, it is critical to propose the meaningful mechanism of radiotherapy resistance in NSCLC in order to develop new treatment strategies.
At present, the research focus of radiotherapy resistance of NSCLC at home and abroad mainly focuses on PI3K/AKT/mTOR signaling pathway,Citation1 tumor stem cells (CSCs),Citation2 microRNA (miRNA)Citation3 and hepatocyte growth factor receptor (HGF/c-MET).Citation4 Despite the above studies, there is still no unified solution. A recent study reported that tumor microenvironment (TME) factors are major barriers to effective radiotherapy.Citation5 In addition, activation of inflammatory pathways has been reported to take part in tumor radiation resistance,Citation6 especially the IFN/STAT1 pathway.Citation7 Previous studies have found that abnormal activation of STAT1 leads to radiation resistance in a variety of cancers, including breast cancer,Citation8 human head and neck squamous cell carcinoma,Citation9 myeloma,Citation10 and renal cell carcinoma.Citation11 Besides, PD-L1 expression was reported to be increased in mice following ionizing irradiation,Citation12 and acquired radiation resistance can be overcome by concurrent PD-L1 blockade in mice.Citation13 These studies indicated that the interaction between tumor and immune microenvironment was important in radiation resistance.
In order to better understand the mechanism of radiotherapy resistance and explore new treatment options, we carried out a targeted RNA microarray to screen DEGs. The potential mechanisms of radiotherapy resistance such as cytokine-cytokine receptor interaction was explored with the performance of GO and KEGG pathway analysis as well as PPI network. Five hub genes were screened by Cytoscape. Most of these genes could be activated by IFN-γ and involved in the response of innate immune. Further analysis revealed that STAT1 may be the transcription factor responsible for the upregulation of the hub genes. In addition, we also found that the expression of PD-L1 was significantly increased after the occurrence of radiotherapy resistance. Immune checkpoint inhibitors targeting PD-L1 have shown potent clinical efficacy and have revolutionized the treatment protocols of a broad spectrum of tumor types, especially NSCLC. Preclinical and clinical trials have demonstrated that radiotherapy could induce a systemic antitumor immune response and have a great potential to sensitize refractory “cold” tumors to immunotherapy.Citation14 Thus, PD-L1 mAb combined with SBRT instead of conventional radiotherapy might be more promising to fight against NSCLC. Our findings indicated that aberrant activation of STAT1 signaling as well as upregulation of PD-L1 may play a role in radioresistance, which revealed the exhaustion of anti-tumor immunity may be one of the mechanisms of radiotherapy resistance in NSCLC.
Materials and Methods
Microarray Data
In this study, lung cancer radiotherapy resistant cells were established by continuous induction of clinical dose gradient increase, lung adenocarcinoma cell line A549 was purchased from the ATCC, and the specific steps were as follows: The lung cancer cell line A549 in logarithmic growth phase was irradiated with 4 Gy for the first time and cultured for subculture. After cell adherence growth, the cells were irradiated again with 4 Gy, with a total dose of 60Gy. The radiotherapy resistance cell line A549-RR was obtained by further culture. Irradiation of 0, 2, 4, 6 and 8Gy (corresponding to inoculated cell numbers are 500, 1000, 2000, 4000 and 8000, respectively). After 2 weeks of cultivation, the clone formation experiment was fixed with 4% paraformaldehyde and then stained with crystal violet. Manual colony count (> 50). Each experiment was repeated at least three times.
Total RNA of cultured cells was isolated using TRIzol reagent (Invitrogen), and the samples were sent to Shanghai Kangcheng Biological Co LTD for RNA microarray analysis.
DEG Screening
The expression levels of case and control samples were normalized by DESeq2 (version 1.22.2). The “limma” package were then used to screen DEGs. Criteria for screening DEGs between different groups: |logFC| > 1, p < 0.05.
GO and Pathway Enrichment Analyses Analysis
KEGG pathway and GO enrichment analysis were conducted by Shanghai Kangcheng Biological Co LTD. Pathway analysis of mRNA expression profiling was carried out by GSEA software. GSEA results are shown as enrichment scores (ES), which reflect the extent to which a set of genes is over-represented at the top or bottom of the sequencing list.
PPI Network and Hub Gene Identification
The building of PPI network was performed using the Search Tool for the Retrieval of Interacting Genes (STRING database; https://string-db.org/). The screening criteria are as follows: gene count > 2, adjusted p value < 0.01 and a cut-off point above 0.4 as the interaction score. The first 100 genes were selected for PPI network. To explore hub genes in our study, Cytoscape 3.8.2 was used to enter Cytohubba module with top nodes ranked by MCC to calculate hub genes in the whole PPI network, as reported, MCC performed better than other calculate methods.Citation15 According to the precise calculation formula reported in the literature, it is more accurate when the number of key genes is small, so we selected top 5 nodes ranked by MCC to calculate hub genes.
Validation of Hub Genes
To further confirm the expression differences of the five hub genes between two samples compared with the results of the microarray analysis, we isolated total RNA from two cell lines. PrimeScript RT reagent kit was applied for reverse transcription of total RNA (Takara, Dalian). SYBR Green Premix Ex Taq (Takara, Japan) was used for cDNA amplification for qRT-PCR. Each experiment was repeated at least three times. The 2DDCt method was used to analyze the data, with ACTB serving as the internal control. lists the primers used in qRT-PCR.
Table 1 Primers for Validation
The supernatant of cell culture medium was taken and centrifuged at 1000RPM for 5 min. ELISA kit was used to detect the concentrations of cytokines (CXCL10, Absin, abs510027; CXCL11, Elabscience, E-EL-H0051c) using double antibody sandwich method. The supernatant containing cytokines was added to a microtiter plate containing captured antibodies for incubation. The cytokines in the supernatant were captured by solid phase antibody labeled with horseradish peroxidase (HRP) to form an antigen-enzyme-labeled antibody complex, TMB (3,3’, 5,5’-tetramylbenzidine) substrate was added for staining. Finally, a stop solution was appended to stop the reaction. The OD value was quantified at 450 nm by Thermo MK3 and then we calculated the concentration according to the absorbance and standard curve.
Analysis of Immune Infiltration Validation of Hub Genes
The “Immune-Gene” module of TIMER2 web server was used to analyze the correlation between hub gene expression and immune infiltrates in all TCGA samples. CD8+ T-cell immune cells were chosen. TIMER, MCPCOUNTER, CIBERSORT-ABS, QUANTISEQ, and XCELL algorithms was used to estimate immune infiltration. The p values and partial correlation (cor) values were tested by Spearman rank correlation test with purity adjustment. The data was represented graphically by a heatmap followed by scatter plot.
To verify the above results, we extracted human peripheral blood mononuclear cells for further exploration. Mononuclear cells were isolated with human mononuclear cell separation solution (Haoyang biological, Tianjin, LST1077) following the instructions of manufacturer. Mononuclear cells were cultivated in the upper chamber of transwell in a 24-well plate, and the lower layer was inoculated with tumor cells. The supernatant of tumor cells was collected after 24 hours, followed by centrifugation at 1000g for 5 min. Then cells were re-suspended with PBS, and corresponding antibodies (CD3, 560835; CD8, 555367; CD45, 555482, BD Bioscience, 1:100) were added for incubation. Cells were subsequently analyzed with multicolor flow cytometry (BD, FACS Verse). CD3 was primarily used to label T lymphocytes, CD45 was used to label regulatory T cells, CD3, CD8 and CD45 co-staining used for flow cytometry were in order to more accurately label CD8+ T cells. Both CD3 and CD8 positive and CD45 negative cells were selected as experimental subjects. Each experiment was carried out at least three times. All blood samples were obtained with the informed consent of the study participants.
ChIP-X Enrichment Analysis
Input the five hub genes into https://maayanlab.cloud/chea3/Citation16 choose transcription factors that cover all hub genes and reorder transcription factors according to the mean rank.
Immunoblotting
RIPA buffer was used to extract protein and then separated by SDS-polyacrylamide gel, after that protein were transferred to PVDF membrane. Antibodies were as following: anti-STAT1 (9172, 1:1000, Cell Signaling Technology, USA), anti-phospho-STAT1 (9167, 1:1000, Cell Signaling Technology, USA), anti-PD-L1 (A18103, 1:1000, ABclonal, USA) and anti-β-actin (66009, 1:2000, Proteintech, USA). Peroxidase-conjugated secondary antibody (ab6721, 1:1000, Abcam, UK) was used and enhanced chemiluminescence assays (ECL, Thermo) were used to detect the antigen–antibody reactions.
Statistical Analysis
All statistical analyses were performed with GraphPad Prism 9.0. Relative results were displayed as mean ± mean standard error. To compare the two groups of data, a student’s t-test was carried out. Statistical significance criteria: p < 0.05. *p < 0.05, **p < 0.01, and ***p < 0.001.
Results
Establishment of Radiotherapy Resistant Cell Lines
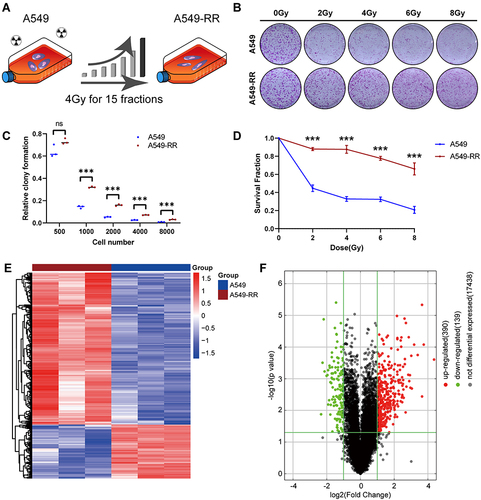
shows the diagram of the establishment of radiation resistant cells. Our results showed that the clone formation ability of A549-RR was significantly stronger than that of A549 under the same dose irradiation (), and the cell dose survival curve suggested that the survival fraction of A549-RR was obviously higher than that of A549 (p = 0.0371, ). To identify DEGs between case and control subjects, we constructed A549 radiotherapy resistant cell line followed by microarray analysis. After integration and standardization of the microarray data, 529 DEGs were screened (adjusted p < 0.05, |logFC| >1) as shown in the heatmap (). Among them, 390 upregulated genes and 139 downregulated genes are illustrated in as volcano plots.
Figure 1 Establishment of radiotherapy resistant cell line. (A) The diagram of establishment of radiotherapy resistant cells. (B) X ray irradiation of 0, 2, 4, 6 and 8Gy. After 2 weeks of cultivation, then fixed with 4% paraformaldehyde and stained with crystal violet in the colony formation experiment. (C) Clone formation rate according to B, the results were calculated according to the ratio of clone number to inoculated cell number. (D) Survival fraction according to B. (E) Heatmap of DEGs screened by microarray analysis, red areas represent highly expressed genes and blue areas represent lowly expressed genes in A549-RR subjects compared with A549 subjects. (F) Differential gene volcano map between the case and control group. The dotted line indicates p = 0.05. ***p < 0.001.
Functional Analysis of DEGs
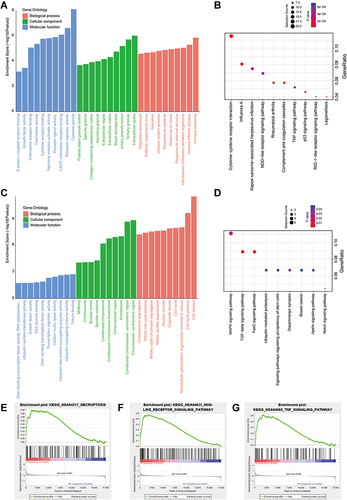
For upregulated genes, GO analysis suggested the most enriched biological process term was related to cytokine activity (GO:0005125), and the receptor regulator activity (GO: 0030545) were secondly enriched in those profile. Extracellular space (GO:0005615) was identified as the most enriched cellular component term. The enriched molecular function term was significantly related to immune response (GO:0006955) and immune effector process (GO:0002252) (). KEGG analysis indicated that the 390 upregulated genes were mainly enriched in cytokine-cytokine receptor interaction (). For downregulated genes, GO analysis showed that the 139 downregulated genes were mainly enriched in tubulin binding, chromosome segregation, and cell division (), KEGG analysis showed that the DEGs were mainly enriched in TGF-β signaling pathway (). The upregulated genes were more enriched in NOD-like receptor signaling pathway, TNF signaling pathway and necroptosis, which were established by gene set enrichment analysis ().
Figure 2 Function and mechanism analysis of altered expression of DEGs. (A) GO analysis of the up regulated DEGs. (B) KEGG pathway analysis of the up regulated DEGs. (C) GO analysis of the down regulated DEGs. (D) KEGG pathway analysis of the down regulated DEGs. The top-three most significant up-regulated enriched gene sets in the resistance subjects: NOD-like receptor signaling pathway (E), TNF signaling pathway (F), Necroptosis (G).
PPI Network and Hub Gene Screening
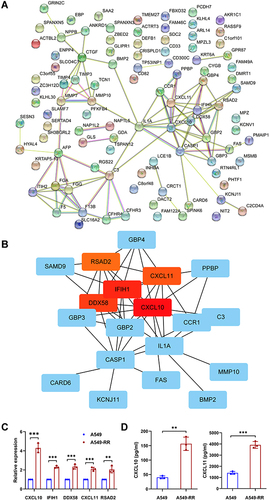
Due to the higher proportion of upregulated DEGs and more beneficial to the application of future targets. We mainly analyzed the upregulated genes in this part. PPI network was carried out by STRING database (). Among the 390 genes included, five hub genes (CXCL10, IFIH1, DDX58, CXCL11, RSAD2) were discovered using CytoHubba based on node score ranking using topological analysis of the maximal clique centrality algorithm and the maximum correlation criterion via the CytoHubba plugin of Cytoscape ().
Figure 3 Identification and validation of hub genes. (A) The PPI network was analyzed by String software. (B) Identified the hub gene by Cytohubba. CXCL10, IFIH1, DDX58, CXCL11, RSAD2 were calculated as the top 5 hub genes. (C) Different expression of the top 5 hub genes in cases and controls verified using qRT-PCR. (D) The relative expression of cytokine in case and control groups using ELISA. Each experiment consisted of three biological replicates. **p < 0.01, ***p < 0.001.
Validation of Hub Genes
Based on the results of microarray analysis, the expression of the above five hub genes were further confirmed by qRT-PCR. Consistent with microarray analysis, statistically significant differences were found between case and control samples (p < 0.05) (). ELISA was performed to reveal the expression level of cytokines including CXCL10 and CXCL11. As the results shown in , the levels of CXCL10 (p = 0.0011) and CXCL11 (p = 0.0002) in A549-RR were significantly higher than that in A549.
Analysis of Immune Infiltration
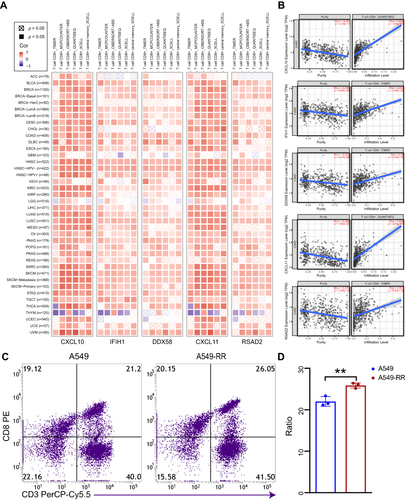
Tumor-infiltrating immune cells play an indispensable role in tumor microenvironment and are also correlated to tumor genesis, development and metastasis.Citation17 Among the five hub genes, CXCL10 and CXCL11 are well known to activate CD8+ T cells. In this study, TIMER, MCPCOUNTER, Cibersort-ABS, QUANTISEQ and XCELL algorithms were used to estimate the relationship between CD8+ T cell infiltration and the five hub genes in different types of TCGA tumors. Interestingly we found a statistically positive correlation between hub gene and CD8+ T cell infiltration in lung adenocarcinoma based on all or most algorithms ().
Figure 4 Correlation analysis between hub genes expression and immune infiltration of CD8+T cell. (A) Different algorithms were performed to explore the relationship between the expression level of the hub genes and the infiltration level of CD8+T cell across all types of cancer in TCGA. (B) The scatterplot data of the lung adenocarcinoma produced using one algorithm. (C) The chemotaxis of CD8+T cell between case and control group were detected by flow cytometry. (D) Quantification of data in C. Each experiment consisted of three biological replicates. **p < 0.01.
Verification of Immune Infiltration
As the immune infiltration analysis showed that up-regulated hub genes in A549-RR were significantly associated with CD8+ T cell infiltration. Therefore, flow cytometry was further performed to verify the chemotaxis of radiotherapy resistant cells to CD8+ T cells. The results revealed that A549-RR had improved CD8+ T cells chemotaxis (p = 0.0073) ().
ChIP-X Enrichment Analysis
ChIP-X Enrichment Analysis revealed that these hub genes could be regulated by the same transcription factors, combined with rank and mean rank as suggested, STAT1 is likely to be a transcription factor of these hub genes. ().
Table 2 ChIP-X Enrichment Analysis Results
Inhibition of STAT1 Could Improve the Therapeutic Efficacy of Radiotherapy
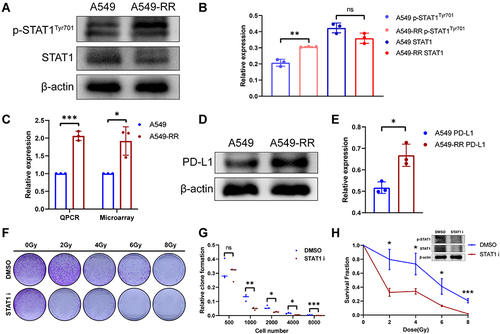
Among the transcription factors that fit the criteria, STAT1 has mostly been reported to be correlated with radiation resistance in variety of tumors. As shown in , phosphorylated STAT1 (Y701) especially the α-subunit was significantly activated in A549-RR, suggesting that STAT1 signaling pathway plays a role in radiotherapy resistance of NSCLC. As shown in , upregulation of PD-L1 was also found in our radiotherapy resistant group, which was consistent with the previous microarray analysis. further verified the level of PD-L1 expression using immunoblotting and was the quantification of PD-L1 expression. To explore the effect of STAT1 on radiotherapy resistance, we used A549RR, the radiotherapy resistant cell line, and found that STAT1 inhibitor could significantly improve the sensitivity of radiotherapy ().
Figure 5 Effects of STAT1 inhibitor on radiotherapy resistance. (A) The expression levels of total STAT1 and p-STAT1 (Y701). (B) Relative expression of STAT1 and p-STAT1. (C) Relative expression of PD-L1. (D) The expression levels of PD-L1. (E) Quantification of PD-L1 expression. (F) A549-RR cells were planted and incubated with STAT1 inhibitor (S1491, Selleck, 2μg/mL, 24h) followed by radiotherapy and then cultured for 2 weeks. (G) Clone formation rate according to D, the results were calculated according to the ratio of clone number to inoculated cell number. (H) Survival fraction according to D. *p < 0.05, **p < 0.01, ***p < 0.001.
Discussion
Radiation induced DNA damage repair, cell cycle disorder, characterization of cancer stem cells and epithelial mesenchymal transformation are the main causes of tumor radiation resistance. At present, the mechanism of radiotherapy resistance remains to be further elucidated. Hence, it is particularly important to investigate the mechanism of reversing radiation resistance and explore markers that improve radiotherapy sensitivity and reduce metastasis and recurrence of NSCLC due to radiation resistance.
In our study, compared with the control group, 390 up regulated DEGs in the radiotherapy resistance group were mostly enriched in cytokine-cytokine receptor interaction signaling pathway, which suggested dysregulation of immune cell in radiotherapy resistance group. According to CytoHubba analysis, CXCL10, IFIH1, DDX58, CXCL11, RSAD2 were the most significant hub genes of DEGs. To further verify the RNA microarray results, we validated the expression level of the five hub genes by qRT-PCR. The results were consistent with those of RNA microarray.
CXCL10 and CXCL11 are angiogenic chemokines, those antimicrobial genes encode a CXC subfamily chemokine and a ligand for the CXCR3 receptor. Binding of this protein to CXCR3 causes pleiotropic effects such as monocyte stimulation, migration of natural killer and T-cell, and adhesion molecule expression modulation.Citation18,Citation19 In melanoma, renal, and colon cell carcinomas, CXCL10 predicted stronger metastatic potential and was significantly correlated with poor overall survival and early metastatic disease progression.Citation20 Ionizing radiation has the potential to increase CXCL10 expression,Citation21 and CXCL10 was proved to be a potential target for response of radiotherapy in patients with tongue squamous cell carcinoma,Citation22 indicated the potential role of CXCL10 in modulating radiosensitivity and the possibility of reversing radiotherapy resistance by targeting CXCL10. CXCL11 has stronger CXCR3 affinity and may help to promote cancer growth.Citation23 CXCL11, in addition to CXCR3, may bind to CXCR7, which was associated with tumor invasiveness and reduced apoptosis,Citation24 and inhibition of CXCL11/CXCR7 axis could block glioblastoma multiforme recurrence after irradiation.Citation25 In our study, expression of CXCL10 and CXCL11 were elevated in radiotherapy resistant group, suggested that the disturbance of immune system may play a role in the resistance to radiotherapy.
Retinoic-acid-inducible gene I(RIG-I)-like receptors (RLRs), including DDX58 and IFIH1, work in the process of cytoplasmic viral components recognition and mitochondrial signaling adaptor activation, which provides the platform recruiting downstream kinases and finally leads to the stimulation of IFN signaling pathways,Citation26–29 so as to initiate the innate immune response.Citation30 Activation of IFN signaling pathway has been reported to be related to radiotherapy resistance in colorectal cancer.Citation7,Citation31 In addition, targeting RLRs, including DDX58 and IFIH1, may improve the sensitivity to radiation therapy of variety tumors.Citation32 In our study, consistent with microarray results, DDX58 and IFIH1 were significantly upregulated in radiotherapy resistant cell lines, suggesting the potential roles of DDX58 and IFIH1 as tumor therapeutic targets, especially in improving radiotherapy sensitivity.
RSAD2 has been reported to be overexpressed in breast cancer and melanoma, and could be used as a prognostic factor.Citation32–34 The protein encoded by this gene could be induced by interferon and activated in the response of antiviral and innate immune. Studies of the interaction between host immune system and radiation therapy have revealed new mechanisms that may be used to improve the efficacy of radiotherapy.Citation35,Citation36 Radiation promotes the release of chemokines that recruit inflammatory cells into TME. Cytokines could dose-dependently influence ionizing radiation responses through their pleiotropy, aggressiveness, and fibrosis.Citation37 Several immune-related genes were screened from radiotherapy resistance group in our study which involved in cytokine-cytokine receptor interaction. It suggested that the balance of proinflammatory and anti-inflammatory cytokines is a key factor to determine the resistance of radiotherapy.
Based on ChIP-X enrichment analysis, the smaller mean rank is, the higher the certainty of prediction is. Considering that BATF2 plays a role as a tumor suppressor gene in cancersCitation38,Citation39 and has not been reported to be associated with radiation resistance, the overall ranking of other transcription factors in is much lower than that of STAT1, we suspected that those hub genes were likely to be promoted by STAT1, which ranking the second place among those transcription factors. Unlike the other STAT isoforms, STAT1 was reported to be the major transcription factor that work as a therapeutic target in radioresistance among many types of cancer cells.Citation8–11 However, the potential function of STAT1 in radiotherapy resistance of lung cancer has not yet been reported. It had previously been reported that high levels of persistently activated STAT1 are required for cell survival following ionizing radiation,Citation40 STAT1 activation may result in tumor radiation adaptation by directly affecting tumor cell cellular transduction. Immunoblotting showed that phosphorylated STAT1 (Y701) especially the α-subunit was significantly activated after radiation resistance. As STAT1α is a latent cytoplasmic transcription factor activated in response to IFN-γ, suggested IFN/STAT1 activation might triggers radioresistant properties in NSCLC cancer, which had been reported before.Citation7
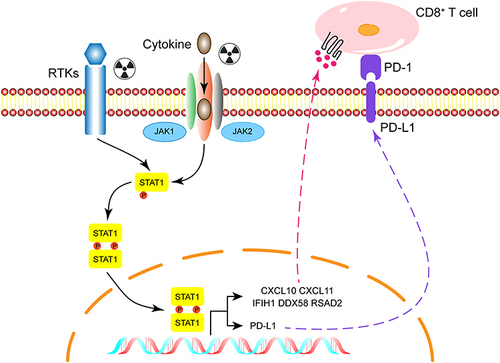
Aside from cancer cells, radiotherapy has the potential to alter the balance of tumor promoting and tumor suppressing cells. Inflammatory signaling pathways are activated after radiotherapy by stimulating cellular survival pathways and the innate immune system,Citation35,Citation36,Citation41 which was consistent with our results. In addition to affecting the immune microenvironment, radiotherapy also activates STAT1 signaling pathway. It had been reported that STAT1 activation increases PD-L1 expression in a variety of tumors,Citation42–44 upregulation of PD-L1 was also found in our radiotherapy resistant group. Furthermore, our results showed the blockade of PD-L1 enhances the therapeutic efficacy of radiotherapy. These results suggested that although radiotherapy promotes the release of immune-promoting cytokines from tumor cells, the upregulation of PD-L1 ultimately leads to the exhaustion of anti-tumor immunity, as we described in , suggested the main mechanism of radioresistance may be depletion of anti-tumor immunity and combined immunotherapy could improve radiotherapy sensitivity as well as against radiation resistance.
Figure 6 Diagram of potential mechanisms of radiation resistance.
Though we identified five hub genes in radioresistance group using bioinformatic analysis, our study only focused on the cellular level. Hence, our conclusions still need further exploration.
Conclusion
Although immune system activation occurs followed by radiation resistance, we hypothesized that the upregulation of PD-L1 expression caused by STAT1 activation might be one of the mechanisms of radiotherapy resistance.
Abbreviations
NSCLC, non-small cell lung cancer; SCLC, small cell lung cancer; DEGs, differentially expressed genes; GO, Gene ontology; KEGG, Kyoto Encyclopedia of Genes and Genomes; GSEA, Gene Set Enrichment Analysis; PPI, protein-protein interaction; BP, biological process; CC, cytological component; MF, molecular function; TME, tumor microenvironment.
Data Sharing Statement
The datasets presented in this study can be found in GEO database, the GEO accession number was: GSE197236.
Ethics Approval
The human blood samples used in this study were approved by the Medical Ethics Committee of Sun Yat-sen Memorial Hospital, Sun Yat-sen University (Approval No.SYSEC-KY-KS-2022-053).
Disclosure
The authors report no conflicts of interest in this work.
Acknowledgments
We would like to thank all participants in this study.
Additional information
Funding
References
- Wang Z, Huang Y, Zhang J. Molecularly targeting the PI3K-Akt-mTOR pathway can sensitize cancer cells to radiotherapy and chemotherapy. Cell Mol Biol Lett. 2014;19(2):233–242. doi:10.2478/s11658-014-0191-7
- Vitale I, Manic G, De Maria R, Kroemer G, Galluzzi L. DNA damage in stem cells. Mol Cell. 2017;66(3):306–319.
- Iqbal MA, Arora S, Prakasam G, Calin GA, Syed MA. MicroRNA in lung cancer: role, mechanisms, pathways and therapeutic relevance. Mol Aspects Med. 2019;70:3–20. doi:10.1016/j.mam.2018.07.003
- Zhu L, Xue F, Xu X, et al. MicroRNA-198 inhibition of HGF/c-MET signaling pathway overcomes resistance to radiotherapy and induces apoptosis in human non-small-cell lung cancer. J Cell Biochem. 2018;119(9):7873–7886. doi:10.1002/jcb.27204
- Barker HE, Paget JT, Khan AA, Harrington KJ. The tumour microenvironment after radiotherapy: mechanisms of resistance and recurrence. Nat Rev Cancer. 2015;15(7):409–425. doi:10.1038/nrc3958
- Wu CT, Chen MF, Chen WC, Hsieh CC. The role of IL-6 in the radiation response of prostate cancer. Radiat oncol. 2013;8:159. doi:10.1186/1748-717X-8-159
- Liu S, Imani S, Deng Y, et al. Targeting IFN/STAT1 pathway as a promising strategy to overcome radioresistance. Onco Targets Ther. 2020;13:6037–6050. doi:10.2147/OTT.S256708
- Weichselbaum RR, Ishwaran H, Yoon T, et al. An interferon-related gene signature for DNA damage resistance is a predictive marker for chemotherapy and radiation for breast cancer. Proc Natl Acad Sci U S A. 2008;105(47):18490–18495. doi:10.1073/pnas.0809242105
- Khodarev NN, Beckett M, Labay E, Darga T, Roizman B, Weichselbaum RR. STAT1 is overexpressed in tumors selected for radioresistance and confers protection from radiation in transduced sensitive cells. Proc Natl Acad Sci U S A. 2004;101(6):1714–1719. doi:10.1073/pnas.0308102100
- Fryknäs M, Dhar S, Oberg F, et al. STAT1 signaling is associated with acquired crossresistance to doxorubicin and radiation in myeloma cell lines. Int j Cancer. 2007;120(1):189–195. doi:10.1002/ijc.22291
- Hui Z, Tretiakova M, Zhang Z, et al. Radiosensitization by inhibiting STAT1 in renal cell carcinoma. Int J Radiat Oncol Biol Phys. 2009;73(1):288–295. doi:10.1016/j.ijrobp.2008.08.043
- Deng L, Liang H, Burnette B, et al. Irradiation and anti-PD-L1 treatment synergistically promote antitumor immunity in mice. J Clin Invest. 2014;124(2):687–695. doi:10.1172/JCI67313
- Dovedi SJ, Adlard AL, Lipowska-Bhalla G, et al. Acquired resistance to fractionated radiotherapy can be overcome by concurrent PD-L1 blockade. Cancer Res. 2014;74(19):5458–5468. doi:10.1158/0008-5472.CAN-14-1258
- Chen Y, Gao M, Huang Z, Yu J, Meng X. SBRT combined with PD-1/PD-L1 inhibitors in NSCLC treatment: a focus on the mechanisms, advances, and future challenges. J Hematol Oncol. 2020;13(1):105. doi:10.1186/s13045-020-00940-z
- Chin CH, Chen SH, Wu HH, Ho CW, Ko MT, Lin CY. cytoHubba: identifying hub objects and sub-networks from complex interactome. BMC Syst Biol. 2014;8 Suppl 4(Suppl4):S11. doi:10.1186/1752-0509-8-S4-S11
- Keenan AB, Torre D, Lachmann A, et al. ChEA3: transcription factor enrichment analysis by orthogonal omics integration. Nucleic Acids Res. 2019;47(W1):W212–w224. doi:10.1093/nar/gkz446
- Fridman WH, Galon J, Dieu-Nosjean MC, et al. Immune infiltration in human cancer: prognostic significance and disease control. Curr Top Microbiol Immunol. 2011;344:1–24.
- Wennerberg E, Kremer V, Childs R, Lundqvist A. CXCL10-induced migration of adoptively transferred human natural killer cells toward solid tumors causes regression of tumor growth in vivo. Cancer Immunol Immunother. 2015;64(2):225–235. doi:10.1007/s00262-014-1629-5
- Utsumi T, Suyama T, Imamura Y, et al. The association of CXCR3 and renal cell carcinoma metastasis. J Urol. 2014;192(2):567–574. doi:10.1016/j.juro.2014.01.100
- Wightman SC, Uppal A, Pitroda SP, et al. Oncogenic CXCL10 signalling drives metastasis development and poor clinical outcome. Br J Cancer. 2015;113(2):327–335.
- Lin Y, Lu R, Hou J, Zhou GG, Fu W. IFNgamma-inducible CXCL10/CXCR3 axis alters the sensitivity of HEp-2 cells to ionizing radiation. Exp Cell Res. 2021;398(1):112382. doi:10.1016/j.yexcr.2020.112382
- Rentoft M, Coates PJ, Loljung L, Wilms T, Laurell G, Nylander K. Expression of CXCL10 is associated with response to radiotherapy and overall survival in squamous cell carcinoma of the tongue. Tumour Biol. 2014;35(5):4191–4198. doi:10.1007/s13277-013-1549-6
- Tokunaga R, Zhang W, Naseem M, et al. CXCL9, CXCL10, CXCL11/CXCR3 axis for immune activation - A target for novel cancer therapy. Cancer Treat Rev. 2018;63:40–47. doi:10.1016/j.ctrv.2017.11.007
- Burns JM, Summers BC, Wang Y, et al. A novel chemokine receptor for SDF-1 and I-TAC involved in cell survival, cell adhesion, and tumor development. J Exp Med. 2006;203(9):2201–2213. doi:10.1084/jem.20052144
- Walters MJ, Ebsworth K, Berahovich RD, et al. Inhibition of CXCR7 extends survival following irradiation of brain tumours in mice and rats. Br J Cancer. 2014;110(5):1179–1188. doi:10.1038/bjc.2013.830
- Xu LG, Wang YY, Han KJ, Li LY, Zhai Z, Shu HB. VISA is an adapter protein required for virus-triggered IFN-beta signaling. Mol Cell. 2005;19(6):727–740. doi:10.1016/j.molcel.2005.08.014
- Kawai T, Takahashi K, Sato S, et al. IPS-1, an adaptor triggering RIG-I- and Mda5-mediated type I interferon induction. Nat Immunol. 2005;6(10):981–988. doi:10.1038/ni1243
- Seth RB, Sun L, Ea CK, Chen ZJ. Identification and characterization of MAVS, a mitochondrial antiviral signaling protein that activates NF-kappaB and IRF 3. Cell. 2005;122(5):669–682. doi:10.1016/j.cell.2005.08.012
- Meylan E, Curran J, Hofmann K, et al. Cardif is an adaptor protein in the RIG-I antiviral pathway and is targeted by hepatitis C virus. Nature. 2005;437(7062):1167–1172. doi:10.1038/nature04193
- Chow KT, Gale M, Loo YM. RIG-I and Other RNA Sensors in Antiviral Immunity. Annu Rev Immunol. 2018;36:667–694. doi:10.1146/annurev-immunol-042617-053309
- Chen B, Alvarado DM, Iticovici M, et al. Interferon-induced IDO1 mediates radiation resistance and is a therapeutic target in colorectal cancer. Cancer Immunol Res. 2020;8(4):451–464. doi:10.1158/2326-6066.CIR-19-0282
- Rehwinkel J, Gack MU. RIG-I-like receptors: their regulation and roles in RNA sensing. Nat Rev Immunol. 2020;20(9):537–551. doi:10.1038/s41577-020-0288-3
- Tang J, Yang Q, Cui Q, et al. Weighted gene correlation network analysis identifies RSAD2, HERC5, and CCL8 as prognostic candidates for breast cancer. J Cell Physiol. 2020;235(1):394–407. doi:10.1002/jcp.28980
- Jessen C, Kreß JKC, Baluapuri A, et al. The transcription factor NRF2 enhances melanoma malignancy by blocking differentiation and inducing COX2 expression. Oncogene. 2020;39(44):6841–6855. doi:10.1038/s41388-020-01477-8
- Burnette BC, Liang H, Lee Y, et al. The efficacy of radiotherapy relies upon induction of type i interferon-dependent innate and adaptive immunity. Cancer Res. 2011;71(7):2488–2496. doi:10.1158/0008-5472.CAN-10-2820
- Gupta A, Probst HC, Vuong V, et al. Radiotherapy promotes tumor-specific effector CD8+ T cells via dendritic cell activation. J Immunol. 2012;189(2):558–566. doi:10.4049/jimmunol.1200563
- Kim BM, Hong Y, Lee S, et al. Therapeutic implications for overcoming radiation resistance in cancer therapy. Int J Mol Sci. 2015;16(11):26880–26913. doi:10.3390/ijms161125991
- Xie JW, Huang XB, Chen QY, et al. m(6)A modification-mediated BATF2 acts as a tumor suppressor in gastric cancer through inhibition of ERK signaling. Mol Cancer. 2020;19(1):114. doi:10.1186/s12943-020-01223-4
- Wang Q, Lu W, Yin T, Lu L. Calycosin suppresses TGF-β-induced epithelial-to-mesenchymal transition and migration by upregulating BATF2 to target PAI-1 via the Wnt and PI3K/Akt signaling pathways in colorectal cancer cells. J Exp Clin Cancer Res. 2019;38(1):240. doi:10.1186/s13046-019-1243-7
- Khodarev NN, Roizman B, Weichselbaum RR. Molecular pathways: interferon/stat1 pathway: role in the tumor resistance to genotoxic stress and aggressive growth. Clin Cancer Res. 2012;18(11):3015–3021. doi:10.1158/1078-0432.CCR-11-3225
- Takeuchi O, Akira S. Pattern recognition receptors and inflammation. Cell. 2010;140(6):805–820. doi:10.1016/j.cell.2010.01.022
- Garcia-Diaz A, Shin DS, Moreno BH, et al. Interferon receptor signaling pathways regulating PD-L1 and PD-L2 expression. Cell Rep. 2017;19(6):1189–1201. doi:10.1016/j.celrep.2017.04.031
- Chen S, Crabill GA, Pritchard TS, et al. Mechanisms regulating PD-L1 expression on tumor and immune cells. J Immunother Cancer. 2019;7(1):305. doi:10.1186/s40425-019-0770-2
- Lv H, Lv G, Chen C, et al. NAD(+) metabolism maintains inducible PD-L1 expression to drive tumor immune evasion. Cell Metab. 2021;33(1):110–127.e115. doi:10.1016/j.cmet.2020.10.021