
Abstract
Purpose
In situations where pathological acquisition is difficult, there is a lack of consensus on distinguishing between adenocarcinoma and squamous cell carcinoma from imaging images, and each doctor can only make judgments based on their own experience. This study aims to extract imaging features of chest CT, extract sensitive factors through logistic univariate and multivariate analysis, and model to distinguish between lung squamous cell carcinoma and lung adenocarcinoma.
Methods
We downloaded chest CT scans with clear diagnosis of adenocarcinoma and squamous cell carcinoma from The Cancer Imaging Archive (TCIA), extracted 19 imaging features by a radiologist and a thoracic surgeon, including location, spicule, lobulation, cavity, vacuolar sign, necrosis, pleural traction sign, vascular bundle sign, air bronchogram sign, calcification, enhancement degree, distance from pulmonary hilum, atelectasis, pulmonary hilum and bronchial lymph nodes, mediastinal lymph nodes, interlobular septal thickening, pulmonary metastasis, adjacent structures invasion, pleural effusion. Firstly, we apply the glm function of R language to perform logistic univariate analysis on all variables to select variables with P < 0.1. Then, perform logistic multivariate analysis on the selected variables to obtain a predictive model. Next, use the roc function in R language to calculate the AUC value and draw the ROC curve, use the val.prob function in R language to draw the Calibrat curve, and use the rmda package in R language to draw the DCA curve and clinical impact curve. At the same time, 45 patients diagnosed with lung squamous cell carcinoma and lung adenocarcinoma through surgery or biopsy in the Radiotherapy Department and Thoracic Surgery Department of our hospital from 2023 to 2024 were included in the validation group. The chest CT features were jointly determined and recorded by the two doctors mentioned above and included in the validation group. The included image feature data are complete and does not require preprocessing, so directly entering statistical calculations. Perform ROC curves, calibration curves, DCA, and clinical impact curves in the validation group to further validate the predictive model. If the predictive model performs well in the validation group, further draw a nomogram to demonstrate.
Results
This study extracted 19 imaging features from the chest CT scans of 75 patients downloaded from TCIA and finally selected 18 complete data for analysis. First, univariate analysis and multivariate analysis were performed, and a total of 5 variables were obtained: spicule, necrosis, air bronchogram Sign, atelectasis, pulmonary hilum and bronchial lymph nodes. After conducting modeling analysis with AUC = 0.887, a validation group was established using clinical cases from our hospital, Draw ROC curve with AUC = 0.865 in the validation group, evaluate the accuracy of the model through Calibrate calibration curve, evaluate the reliability of the model in clinical practice through DCA curve, and further evaluate the practicality of the model in clinical practice through clinical impact curve.
Conclusion
It is possible to extract influential features from ordinary chest CT scans to determine lung adenocarcinoma and squamous cell carcinoma. The model we have set up performs well in terms of discrimination, accuracy, reliability, and practicality.
Keywords:
Introduction
The pathology of lung cancer is very important in personalized and precise treatment,Citation1,Citation2 but in clinical practice, we inevitably encounter a challenge, which is that sometimes only a small number of tumor cells can be found after biopsy, and even necrotic cells can only be seen. Even after immunohistochemistry, the specific pathological type cannot be determined. Based on tumor markers, we can sometimes further rule out the diagnosis of small cell lung cancer, but further distinguishing between squamous cell carcinoma and adenocarcinoma is basically impossible. Pathological patients who undergo biopsy again often refuse due to risk and pain. But there are significant differences in treatment options between squamous cell carcinoma and adenocarcinoma, according to the National Comprehensive Cancer Network (NCCN) guidelines.Citation3 At this point, doctors have no other choice but to make further judgments based on imaging features. However, this judgment requires rich clinical experience and a high error rate. This leads to a lack of precise treatment for patients with unclear pathology, resulting in a decrease in treatment effectiveness and a shortened survival time. Therefore, how to distinguish lung squamous cell carcinoma and adenocarcinoma based on common chest CT imaging features has become a challenge in treating patients with unclear pathology.
Some studies have also attempted to model by extracting features from various image data, some based on CT texture features,4,5,6 some based on the iodine concentration of enhanced CT,Citation7 some rely on the attenuation rate of enhanced CT,Citation8 some models are established based on the perfusion parameters of brain metastases,Citation9 some use PET-CT,Citation10,Citation11 and some combine machine learning.Citation12–16 However, these examinations increase the economic burden on patients or are difficult to operate, and they have not been proven to be clinically applicable. Because chest CT scans are more common and cost-effective, it is more meaningful and beneficial for patients to distinguish between adenocarcinoma and squamous cell carcinoma based on chest CT scans. In the past, only one study based on chest CT features studied the pathological differences of lung cancer,Citation17 but he did not further analyze the differences between squamous cell carcinoma and adenocarcinoma. This study aims to extract traditional imaging features from chest CT plain scans and analyze them, aiming to obtain a reliable predictive model to help clinical doctors distinguish between lung squamous cell carcinoma and lung adenocarcinoma.
Method
Download images with squamous cell carcinoma or adenocarcinoma from The Cancer Imaging Archive (TCIA). Inclusion criteria: 1. Pathologically confirmed as lung squamous cell carcinoma or lung adenocarcinoma; 2. The contour of lung tumors is relatively clear; 3. Complete lung tumor scanning; 4. CT is a plain or enhanced image. Exclusion criteria: 1. Unclear pathology; 2. A large amount of pleural effusion or pneumonia obstructs the contour of the tumor; 3. Incomplete lung tumor scanning; 4. Identify cases with significant tumor changes after radiotherapy or chemotherapy. A radiologist and a thoracic surgeon jointly determined 19 chest CT features, including location, spicule, lobulation, cavity, vacuolar sign, necrosis, pleural traction sign, vascular bundle sign, air bronchogram sign, calcification, enhancement degree, distance from pulmonary hilum, atelectasis, pulmonary hilum and bronchial lymph nodes, mediastinal lymph nodes, interlobular septal thickening, pulmonary metastasis, adjacent structures invasion, pleural effusion, pathology and record, enter the training group. If there is a lot of missing data in the feature, it will be removed. Firstly, we apply the glm function of R language to perform logistic univariate analysis on all variables to select variables with P < 0.1. Then, perform logistic multivariate analysis on the selected variables to obtain a predictive model. Next, use the roc function in R language to calculate the AUC value and draw the ROC curve, use the val.prob function in R language to draw the Calibrat curve, use the rmda package in R language to draw the DCA curve and clinical impact curve. At the same time, 45 patients diagnosed with lung squamous cell carcinoma and lung adenocarcinoma through surgery or biopsy in the Radiotherapy Department and Thoracic Surgery Department of our hospital from 2023 to 2024 were included. The chest CT features were jointly determined and recorded by the two doctors mentioned above and included in the validation group. The included image feature data is complete and does not require preprocessing, so directly entering statistical calculations. Perform ROC curves, calibration curves, DCA, and clinical impact curves in the validation group to further validate the predictive model. If the predictive model performs well in the validation group, further draw a nomogram to demonstrate.
Result
Univariate Analysis of Training Group
Chest CT scans of 75 patients diagnosed with adenocarcinoma and squamous cell carcinoma were downloaded from The Cancer Imaging Archive (TCIA). They will be included in the training group (CMB-LCA, CPTAC-LUAD, CPTAC-LSCC),Citation18–20 After sorting out its 19 image features, it was found that the degree of enhancement was missing by 30%, so it was removed. Therefore, the actual image features that entered the analysis were 18, which including location, spicule, lobulation, cavity, vacuolar sign, necrosis, pleural traction sign, vascular bundle sign, air bronchogram sign, calcification, distance from pulmonary hilum, atelectasis, pulmonary hilum and bronchial lymph nodes, mediastinal lymph nodes, interlobular septal thickening, pulmonary metastasis, adjacent structures invasion, pleural effusion. The glm package of R language was applied for logistic univariate analysis, and the results are shown in . Further extract features with P < 0.05 and P < 0.1 as follows: spicule, necrosis, air bronchogram sign, atelectasis, pulmonary hilum and bronchial lymph nodes () and spicule, necrosis, pleural traction sign, air bronchogram sign, atelectasis, pulmonary hilum and bronchial lymph nodes (). Select variables with P < 0.1 for the next step of multi factor analysis.
Table 1 Results of Logistic Univariate Analysis
Table 2 Image Characteristics with P<0.05
Table 3 Image Characteristics with P<0.1
Multivariate Analysis of Training Group
Selecting variables with univariate analysis result P < 0.1, and conducting multiple factor regression analysis using enter, forward, back, and both methods, it was found that the AIC values for forward, back, and both were the same, with AIC = 73.66533, which was lower than the AIC value of the enter method. Therefore, both stepwise regression method was selected for multivariate analysis, and the results are shown in . The final image features that enter modeling are spicule, necrosis, air bronchogram sign, atelectasis, pulmonary hilum and bronchial lymph nodes.
Table 4 Results of Logistic Multivariate Analysis
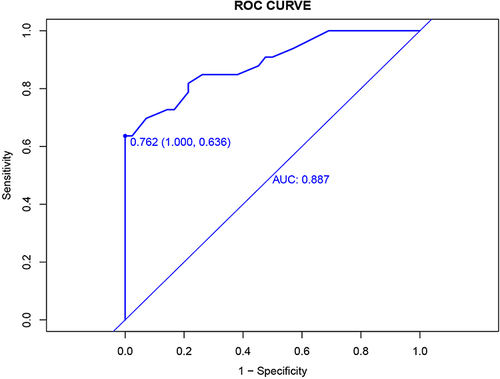
ROC Curves for Training Groups
We use ROC curves for model discrimination evaluation in training groups. First, draw the ROC curve in the training group with AUC = 0.887 and 95% confidence interval of 0.812–0.963, as shown in .
Figure 1 Training group ROC curve.
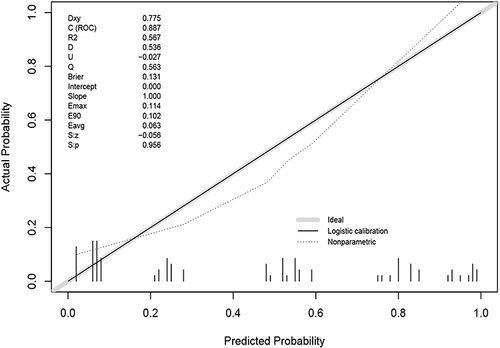
Calibrate Validation Curves for Training Groups
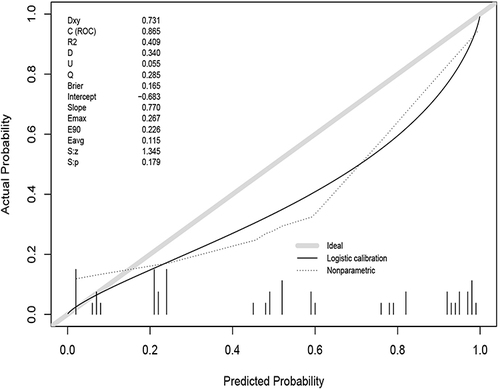
We use the Calibrate curve to evaluate the accuracy of the model. First, draw the Calibrate curve () in the training group, which shows p = 0.956, showing that the accuracy of the model is extremely high.
Figure 2 Training group Calibrate curve.
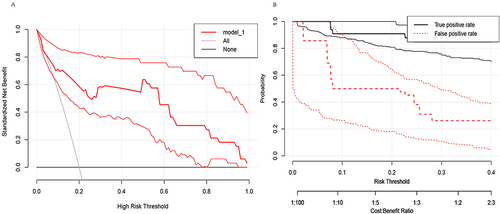
DCA curves and confidence intervals for training groups
We use DCA curves to evaluate the reliability of the model in clinical practice. Draw the DCA curve and confidence interval ( and ) in the training group using the RMDA package of R language, and search for literatureCitation21,Citation22 to determine a 20% incidence rate for squamous cell carcinoma and an 80% incidence rate for adenocarcinoma. Therefore, setting the parameter population validity = 0.2 shows good reliability.
Figure 3 (A). Training group DCA curve. (B). confidence interval.
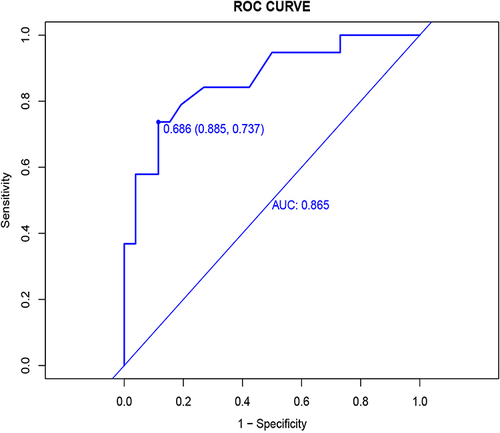
ROC Curves for Validation Groups
We use ROC curves for model discrimination evaluation in validation groups. We use R language to draw the ROC curve in the validation group with AUC = 0.865 and 95% confidence interval of 0.756–0.975, as shown in .
Figure 4 Validation group ROC curve.
Calibrate Validation Curves for Validation Groups
We use the Calibrate curve to evaluate the accuracy of the model in validation groups. Using R language to draw a Calibrate curve () in the validation group, with P = 0.179. The accuracy of the model was not as good as in the training group, but the P value was greater than 0.05, showing good accuracy.
Figure 5 Validation group Calibrate curve.
DCA Curves and Confidence Intervals for Validation Groups
We use DCA curves to evaluate the reliability of the model in clinical practice in validation groups. First, set the parameter population validity = 0.2. Then, in the validation group, a DCA curve and confidence interval ( and ) were plotted, and the results showed that reliability was not as good as in the training group.
Figure 6 (A) Verification group DCA curve. (B) confidence interval.
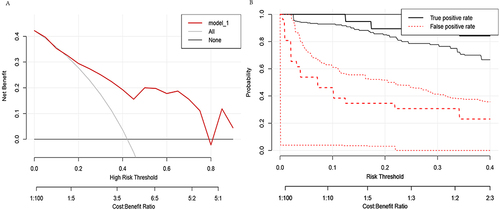
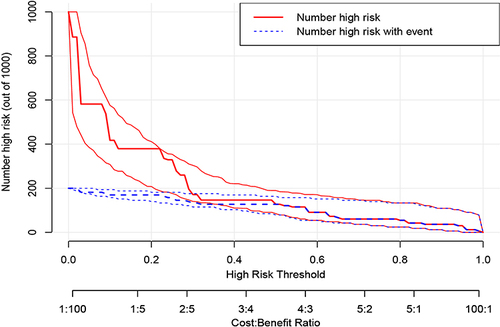
Clinical Impact Curve
We further evaluate the practicality of the model in clinical practice using clinical impact curves. By using the RMDA package in R language to draw a clinical impact curve (), it can be seen that the solid red line is very close to the solid blue line, indicating good reliability of the model.
Figure 7 Clinical impact curve.
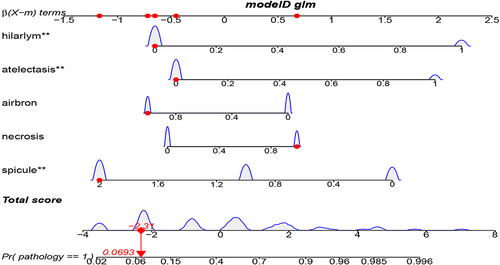
Nomogram Column Chart
Finally, we visualize the established model and use the rms package in R language to draw a Nomogram column chart ().
Figure 8 Nomo column chart.
Discussion
For patients who are difficult to undergo surgery or biopsy, or whose pathology cannot be decided after biopsy, distinguishing between lung squamous cell carcinoma and adenocarcinoma is a widespread problem that troubles clinical doctors, and there is currently no good method. This study extracted image features from chest CT downloaded from TCIA and conducted modeling analysis with AUC = 0.887. A validation group was set up using clinical cases from our hospital, and an ROC curve with AUC = 0.865 was drawn in the validation group. The accuracy of the model was evaluated through the Calibration curve, the reliability of the model in clinical practice was evaluated through the DCA curve, and the clinical impact curve was further evaluated to evaluate the practicality of the model in clinical practice. Prove that the model has certain clinical application value.
There have been many literature reports on the application of imaging features for pathological prediction in the past.Citation5–13,Citation17,Citation23–33 Han et al found that a model for distinguishing lung squamous cell carcinoma and lung adenocarcinoma was constructed using CT texture features, with an AUC of 0.803,Citation5 Zhang et al established a model based on the variation of iodine concentration in enhanced CT, with an AUC of 0.871,Citation7 Fukuma et al established a model based on the attenuation rate of enhanced CT, with an AUC of only 0.625,Citation8 Jiang et al established a model based on the perfusion parameters of brain metastases, with an AUC of 0.845,Citation9 Tomori et al established a model using a combination of PET-CT and CT imaging features, with an AUC of 0.92,Citation11 Lin et al combined machine learning to establish a model with a maximum AUC0.8,Citation12 Tang et al combined machine learning to establish a model with a maximum AUC0.87,Citation13 But these examinations will increase the financial burden on patients, and some patients with allergic constitution are not suitable for enhanced examinations, while ordinary chest CT plain scans are more common and economical. Yue et alCitation24 found that the imaging features of chest CT are a fast and widely available way to distinguish between lung squamous cell carcinoma and adenocarcinoma. However, these articles usually require the use of radiomics to extract data features from images in order to make judgments, and this process requires complex computer technologies such as image segmentation and Python software operation, which is still very difficult for clinical doctors. Therefore, I conducted a literature search based on how to apply chest CT to distinguish adenocarcinoma and squamous cell carcinoma. I did not find any research on using the imaging features of chest CT for modeling to help distinguish between lung squamous cell carcinoma and adenocarcinoma. This study downloaded chest CT from the TCIA database, reducing human intervention in cases and setting up a model for predicting lung adenocarcinoma and squamous cell carcinoma with AUC = 0.887. The AUC of the models developed in the above studies is 0.625 for the lowest, 0.92 for the highest, and mostly 0.8. The AUC of this study is 0.887, which belongs to the upper moderate level. Moreover, the data source of this study is the most ordinary chest CT, so the results of this study are reliable and practical.
This study has some limitations. Firstly, the number of cases is relatively small, which to some extent reduces the applicability of the model. Secondly, due to the high number of cases with enhanced CT, there is a lack of enhancement factors. Also, due to the selection of multiple influencing features in this study, no identical or similar articles were found, so it was not possible to compare the ROC with other articles. Finally, using chest CT alone to determine lung adenocarcinoma and squamous cell carcinoma itself has significant limitations. This study intends to analyze this only because it has found that many medical colleagues are interested in using chest CT to determine pathological subtypes and have engaged in heated discussions. However, there is no consensus. The image features adopted in this study are the basis mentioned by doctors on the Chinese Internet during their discussion. It is hoped that this study can also provide some judgmental basis for doctors. However, due to the small sample size of this study, it may result in biased results. Therefore, the five features proposed in this article require further clinical validation and future research improvements with larger sample sizes. Clinicians can strengthen the weights of five features, including spicule, necrosis, air bronchogram sign, atelectasis, pulmonary hilum and bronchial lymph nodes when using their own experience to make judgments, with a basis to preliminarily distinguish between lung squamous cell carcinoma and lung adenocarcinoma, and make personalized treatment choices with more confidence in treatment. In the future, we will accumulate more cases to enrich the research sample of this experiment, so as to make the results closer to the real world and improve the accuracy of evaluation.
Conclusion
It is currently very difficult to distinguish between lung adenocarcinoma and lung squamous cell carcinoma in clinical practice when pathology is difficult to obtain. Our study found that extracting specific features from regular chest CT scans is feasible for identifying lung adenocarcinoma and squamous cell carcinoma. The model we have established performs well in terms of discrimination, accuracy, reliability, and practicality. This provides more evidence for ordinary clinical doctors to distinguish between squamous cell carcinoma and adenocarcinoma, which is more reliable than relying solely on personal experience. In the future, we need more cases to improve the model.
Ethics Declarations and Consent to Participate
This retrospective study was carried out using the opt-out method for the case series of our hospital. The study was approved by the Research Ethics Committee of the second hospital of Hebei Medical University (approval no 2024-R019) and was conducted in accordance with the 1964 Helsinki Declaration and its later amendments or comparable ethical standards. Informed consent was waived by the Research Ethics Committee of the second hospital of Hebei Medical University due to the retrospective nature of the study, and all clinical data was anonymized during analysis to maintain the patient privacy. And all methods were performed in accordance with the relevant guidelines and regulations of the committee of The Second Hospital of Hebei Medical University.
Author Contributions
Chunmei Liu wrote the manuscript and all the figures, downloaded imaging, and read image features, Yuzheng He jointly analyze image data and extract image features, Jianmin Luo design the study. All authors made a significant contribution to the work reported, whether that is in the conception, study design, execution, acquisition of data, analysis and interpretation, or in all these areas; took part in drafting, revising or critically reviewing the article; gave final approval of the version to be published; have agreed on the journal to which the article has been submitted; and agree to be accountable for all aspects of the work.
Disclosure
The authors declare that there is no conflict of interests.
Data Sharing Statement
The datasets generated during and/or analyzed during the current study are not publicly available due to privacy of patient information but are definitely available from the corresponding author if requested. All requests are greeted.
Additional information
Funding
References
- Lee Y, Lee B, Choi YL, Kang DW, Han J. Clinicopathologic and molecular characteristics of HER2 (ERBB2)-altered non-small cell lung cancer: implications for precision medicine. Mod Pathol. 2024;37:100490. doi:10.1016/j.modpat.2024.100490
- Bertolaccini L, Casiraghi M, Uslenghi C, Maiorca S, Spaggiari L. Recent advances in lung cancer research: unravelling the future of treatment. Updates Surg. 2024. doi:10.1007/s13304-024-01841-3
- The National Comprehensive Cancer Network. Non-small cell lung cancer; 2024. Available from: https://www.nccn.org/guidelines/guidelines-detail?category=1&id=1450. Accessed May 28, 2024.
- Liu H, Jing B, Han W, Long Z, Mo X, Li H. A comparative texture analysis based on NECT and CECT images to differ entiate lung adenocarcinoma from squamous cell carcinoma. J Med Syst. 2019;43(3):59. doi:10.1007/s10916-019-1175-y
- Han R, Arjal R, Dong J, et al. Three dimensional texture analysis of noncontrast chest CT in differentiating solitary solid lung squamous cell carcinoma from adenocarcinoma and correlation to immunohistochemical markers. Thoracic Cancer. 2020;11(11):3099–3106. doi:10.1111/1759-7714.13592
- Fried DV, Tucker SL, Zhou S, et al. Prognostic value and reproducibility of pretreatment CT texture featur es in stage III non-small cell lung cancer. Int J Radiat Oncol Biol Phys. 2014;90(4):834–842. doi:10.1016/j.ijrobp.2014.07.020
- Zhang Z, Zou H, Yuan A, et al. A single enhanced dual-energy CT Scan may distinguish lung squamous ce ll carcinoma from adenocarcinoma during the venous phase. Acad Radiol. 2020;27(5):624–629. doi:10.1016/j.acra.2019.07.018
- Fukuma S, Shinya T, Soh J, et al. Association between Histological Types and Enhancement of Dynamic CT f or Primary Lung Cancer. Acta medica Okayama. 2020;74(2):129–135. doi:10.18926/AMO/58271
- Jiang C, Liu X, Qu Q, Jiang Z, Wang Y. Prediction of adenocarcinoma and squamous carcinoma based on CT perfus ion parameters of brain metastases from lung cancer: a pilot study. Front Oncol. 2023;13:1225170. doi:10.3389/fonc.2023.1225170
- Aydos U, Ünal ER, Özçelik M, et al. Características de textura del tumor primario en imágenes de 18F-FDG PET en cáncer de pulmón de células no pequeñas: la relación entre parámetros de imágenes y parámetros histopatológicos. Revista Espa De Med Nucl E Imag Molecul. 2021;40(6):343–350. doi:10.1016/j.remn.2020.06.025
- Tomori Y, Yamashiro T, Tomita H, et al. CT radiomics analysis of lung cancers: differentiation of squamous cel l carcinoma from adenocarcinoma, a correlative study with FDG uptake. Eur J Radiol. 2020;128:109032. doi:10.1016/j.ejrad.2020.109032
- Lin J, Yu Y, Zhang X, Wang Z, Li S. Classification of histological types and stages in non-small cell lung cancer using radiomic features based on CT images. J Digit Imag. 2023;36(3):1029–1037. doi:10.1007/s10278-023-00792-2
- Tang X, Huang H, Du P, Wang L, Yin H, Xu X. Intratumoral and peritumoral CT-based radiomics strategy reveals disti nct subtypes of non-small-cell lung cancer. J Cancer Res Clin Oncol. 2022;148(9):2247–2260. doi:10.1007/s00432-022-04015-z
- Wang C, Ma J, Shao J, et al. Non-invasive measurement using deep learning algorithm based on multi-source features fusion to predict PD-L1 expression and survival in NSCLC. Front Immunol. 2022;13:1.
- Qiu Q, Xing L, Wang Y, Feng A, Wen Q. Development and validation of a radiomics nomogram using computed tomography for differentiating immune checkpoint inhibitor-related pneumonitis from radiation pneumonitis for patients with non-small cell lung cancer. Front Immunol. 2022;2022:13.
- Wen Q, Yang Z, Dai H, Feng A, Li Q. Radiomics study for predicting the expression of PD-L1 and tumor mutation burden in non-small cell lung cancer based on CT images and clinicopathological features. Front Oncol. 2021;11:620246. doi:10.3389/fonc.2021.620246
- Ban X, Shen X, Hu H, et al. Predictive CT features for the diagnosis of primary pulmonary mucoepid ermoid carcinoma: comparison with squamous cell carcinomas and adenoca rcinomas. Cancer Imag. 2021;21(1):2. doi:10.1186/s40644-020-00375-2
- Cancer Moonshot Biobank. Cancer Moonshot Biobank – lung Cancer Collection (CMB-LCA) (Version 4) [dataset]. Cancer Imaging Arch. 2022. doi:10.7937/3CX3-S132
- National Cancer Institute Clinical Proteomic Tumor Analysis Consortium (CPTAC). The clinical proteomic tumor analysis consortium lung squamous cell carcinoma collection (CPTAC-LSCC) (Version 14) [Data set]. Cancer Imaging Arch. 2018;2018:1. doi:10.7937/K9/TCIA.2018.6EMUB5L2
- National Cancer Institute Clinical Proteomic Tumor Analysis Consortium (CPTAC). The clinical proteomic tumor analysis consortium lung adenocarcinoma collection (CPTAC-LUAD) (Version 12) [Data set]. Cancer Imaging Arch. 2018;2018:1. doi:10.7937/K9/TCIA.2018.PAT12TBS
- of Committee LC. Chinese anti-cancer association LCSGoCoO, multicenter big data research project specialists of Chinese lung canc er P. Current status of postoperative pathological diagnosis of lung cancer in China: a multicenter big data study. Zhonghua bing li xue za zhi. 2021;50(8):882–890. doi:10.3760/cma.j.cn112151-20210427-00328
- Zhou Y, Xiang Z, Lin W, et al. Long-term trends of lung cancer incidence and survival in southeastern China, 2011-2020: a population-based study. BMC Pulm Med. 2024;24(1):25. doi:10.1186/s12890-024-02841-0
- Khorrami M, Bera K, Leo P, et al. Stable and discriminating radiomic predictor of recurrence in early st age non-small cell lung cancer: multi-site study. Lung Cancer. 2020;142:90–97. doi:10.1016/j.lungcan.2020.02.018
- Yue JY, Chen J, Zhou FM, et al. CT-pathologic correlation in lung adenocarcinoma and squamous cell carcinoma. Medicine. 2018;97(50):e13362. doi:10.1097/MD.0000000000013362
- Yu L, Tao G, Zhu L, et al. Prediction of pathologic stage in non-small cell lung cancer using mac hine learning algorithm based on CT image feature analysis. BMC Cancer. 2019;19(1):464. doi:10.1186/s12885-019-5646-9
- Ju H, Kim K, Kim BI, Woo S-K. Graph neural network model for prediction of non-small cell lung cancer lymph node metastasis using protein–protein interaction network and 18F-FDG PET/CT radiomics. Int J Mol Sci. 2024;25(2):698. doi:10.3390/ijms25020698
- Li B, Su J, Liu K, Hu C. Deep learning radiomics model based on PET/CT predicts PD-L1 expressio n in non-small cell lung cancer. Europ J Radiol Open. 2024;12:100549. doi:10.1016/j.ejro.2024.100549
- J-W M, Jiang X, Wang Y-M, et al. Dual-energy CT-based radiomics in predicting EGFR mutation status non- invasively in lung adenocarcinoma. Heliyon. 2024;10(2):e24372. doi:10.1016/j.heliyon.2024.e24372
- Meng X, Xu H, Liang Y, et al. Enhanced CT-based radiomics model to predict natural killer cell infil tration and clinical prognosis in non-small cell lung cancer. Front Immunol. 2024;14:1334886. doi:10.3389/fimmu.2023.1334886
- Zhang G, Man Q, Shang L, et al. Using multi-phase CT radiomics features to predict EGFR mutation statu s in lung adenocarcinoma patients. Acad Radiol. 2024;S1076-6332(23):1.
- Zhang X, Zhang G, Qiu X, et al. Exploring non-invasive precision treatment in non-small cell lung canc er patients through deep learning radiomics across imaging features an d molecular phenotypes. Biomarker Res. 2024;12(1):12. doi:10.1186/s40364-024-00561-5
- Zuo Y, Liu L, Chang C, et al. Value of multi-center 18 F-FDG PET/CT radiomics in predicting EGFR mutation status in lung adenocarcinoma. Med Phys. 2024. doi:10.1002/mp.16947
- Zyla J, Marczyk M, Prazuch W, et al. Combining low-dose computer-tomography-based radiomics and serum metab olomics for diagnosis of malignant nodules in participants of lung can cer screening studies. Biomolecules. 2023;14(1):44. doi:10.3390/biom14010044