

Abstract
T lymphocytes are believed to play an important role in the pathogenesis of chronic obstructive pulmonary disease (COPD). How T cells are recruited to the lungs and contribute to the inflammatory process is largely unknown. COPD is a heterogeneous disease, and discriminating disease phenotypes based on distinct molecular and cellular pathways may provide new approaches for individualized diagnosis and therapies. Bronchoalveolar lavage (BAL) and blood samples were obtained from 40 never-smokers, 40 smokers with normal lung function, and 38 COPD patients. T-cell chemokine receptor expression was analyzed with flow cytometry, and soluble BAL cytokines and chemokines were measured using a cytokine multiplex assay. Correlations with gender and clinical characteristics including lung imaging were investigated using multivariate modeling. Th1/Tc1- and Th2/Tc2-associated soluble analytes and T-cell chemokine receptors were analyzed as cumulative Th1/Tc1 and Th2/Tc2 immune responses. A higher expression of chemokine receptor CCR5 on CD8+ T cells in BAL and higher percentage of CXCR3+CD8+ T cells in blood was found in female smokers with COPD compared to those without COPD. CCR5 expression on CD4+ and CD8+ T cells was lower in BAL from male smokers with COPD compared to those without COPD. Among female smokers with COPD, Th1/Tc1 immune response was linked to BAL macrophage numbers and goblet cell density, and Th2/Tc2 response was associated with the measures of emphysema on high-resolution computed tomography. The highly gender-dependent T-cell profile in COPD indicates different links between cellular events and clinical manifestations in females compared to males. Our findings may reveal mechanisms of importance for the difference in clinical course in female COPD patients compared to males.
Acknowledgments
The authors thank research nurses Gunnel de Forest, Heléne Blomqvist, and Margitha Dahl, as well as Louise Berg and Yvonne Sundström (Karolinska Institutet, Stockholm) for kindly providing the Bio-Rad Bio-Plex instrument and for their helpful recommendations. This study was supported by grants from the Swedish Heart-Lung Foundation, the King Oscar II Jubilee Foundation, the Mats Kleberg Foundation, King Gustaf V’s and Queen Victoria’s Freemasons’ Foundation, the Hesselmans Foundation, Sandoz A/S, Swedish Governmental Agency for Innovation Systems (VINNOVA), the Swedish Foundation for Strategic Research (SSF), European Union (EU) Fp6 Marie Curie International Reintegration Grant (IRF), the Foundation of the Finnish Anti-Tuberculosis Association, the Swedish Research Council (VR), the Stockholm County Council (ALF project), and Karolinska Institutet.
Author contributions
HF was the principal investigator and was responsible for the integrity of the data and accuracy of data analysis. ÅMW and CMS initiated and conceived the project and provided funding and coordinated the research; HF, MY, MM, JW, ÅMW, and CMS contributed to study design; HF, MY, MM, RK, SN, BE, HM, JG, JW, ÅMW, and CMS contributed to data collection and analysis; HF, JW, ÅMW, and CMS contributed to drafting the manuscript. All the authors contributed to the interpretation of data and to the critical review of the manuscript, including approval of the final version.
Disclosure
The authors report no conflicts of interest in this work.
Supplementary materials
Materials and methods
Study subjects and patients
To detect inflammatory processes related to COPD and not smoking, smokers with normal lung function and COPD patients were matched for smoking history in terms of pack-years. Patients treated with oral or inhaled corticosteroids, with a history of allergy or asthma, as stated in questionnaires, or with exacerbations during the last 3 months were not included. In vitro screenings for the presence of specific immunoglobulin E (IgE) antibodies (PHADIATOP®; Pharmacia, Uppsala, Sweden) were negative. Reversibility test was performed after inhalation of two doses of 0.25 mg terbutaline (BRICANYL® TURBUHALER®; AstraZeneca, Södertälje, Sweden). Serum IgG was analyzed according to routines at Karolinska University Laboratory, Department of Clinical Chemistry.
Flow cytometric analysis of T cells
Bronchoalveolar lavage (BAL) and blood cells were stained with antibodies against the surface molecules CD3 (Pacific Blue), CD4 (allophycocyanin-Cy7), CD8 (Amcyan), CXCR3 (allophycocyanin), CCR5 (phycoerythrin), CXCR4 (phycoerythrin-Cy5), and CD69 (fluorescein isothiocyanate) or with matched isotype controls (Becton Dickinson [BD], Mountain View, CA, USA) for 25 minutes in the dark (BAL cells at 4°C and blood at room temperature). The blood cells were thereafter incubated with fluorescence-activated cell sorting lysing solution (BD) for 8 minutes and both BAL, and blood cells were washed twice with cell wash (BD). T cells were acquired and analyzed using an 8-parameter flow cytometer FACSCanto (BD) and FACS Diva 6.1.2 software (BD). Because of difficulties in discriminating CCR5- and CXCR4-positive T cells from negative, the expression of these receptors was measured as the difference between median fluorescence intensity (MFI) and the fluorescence of the corresponding isotype control.
Multiplex analysis of inflammatory mediators
Frozen BAL supernatants were thawed at room temperature and concentrated using Amicon Ultra 15ML 3K centrifugal filters (Millipore Corporation, Bedford, MA, USA) prior to cytokine analysis. The assay was performed according to the manufacturer’s instructions, and bead MFI was detected with a Bio-Plex 200 (Bio-Rad Laboratories, Inc., Hercules, CA, USA). Multiplex data were analyzed using Bio-Plex Manager software, version 6.0 (Bio-Rad). All samples were run in duplicate. Data out of range or below the lowest limit of quantification (defined as 5× standard deviation of the background noise) or sample with high technical variance (defined as a coefficient of variance of replicates >50%) were excluded from all further analyses. Correction for batch effects was performed through mean-centering and scaling to univariate variance. Strong intra-group outliers, as identified by Dixon’s q-test (P<0.05), were excluded.
Statistical analyses
Unsupervised analysis by principal component analysis (PCA) was used for quality control and outlier identification, and Orthogonal Projections to Latent Structures Discriminate Analysis (OPLS-DA) for separation between groups. In contrast to PCA, OPLS is a supervised modeling approach designed to separate structured noise unrelated (orthogonal) to the predictive variance of interest (eg, between COPD patients and smokers), thereby increasing the ability to identify biomarkers driving the observed group separation.
Prior to analysis, data were log transformed, scaled to unit variance, and mean-centered to avoid weighting based on variable abundance in the analyses.
The results of the OPLS analysis are displayed in a scores plot displaying the separation of groups (predictive component) along the y-axis and within-group variation between individuals (orthogonal components) in the x-axis, as well as the corresponding loadings plot or variables’ importance plot, showing the relative importance of variables for separating the groups.
Figure S1 The relative concentration of (A) TNF-α, (B) IFN-γ, (C) IL-4, (D) CCL3, (E) CCL4, (F) CCL5, (G) CXCL9, and (H) CXCL10 in BAL from healthy never-smokers (NS), smokers with normal lung function (S), smokers with COPD (CS), and ex-smokers with COPD (CE).
Notes: Data have been group mean-centered for the removal of batch effects. Horizontal lines represent the median values.
Abbreviations: BAL, bronchoalveolar lavage; COPD, chronic obstructive pulmonary disease; IFN, interferon; IL, interleukin; TNF, tumor necrosis factor.
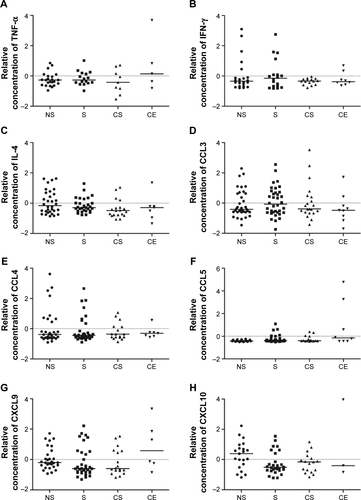
Figure S2 The relative concentration of (A) IL-1β, (B) IL-12 (p70), (C) VEGF, and (D) TGF-β2 in BAL from healthy never-smokers (NS), smokers with normal lung function (S), smokers with COPD (CS), and ex-smokers with COPD (CE). Horizontal lines represent the median values. *P<0.05; **P<0.01; ***P<0.001.
Abbreviations: BAL, bronchoalveolar lavage; COPD, chronic obstructive pulmonary disease; MFI, median fluorescence intensity; IL, interleukin; TGF, transforming growth factor; TNF, tumor necrosis factor; VEGF, vascular endothelial growth factor.
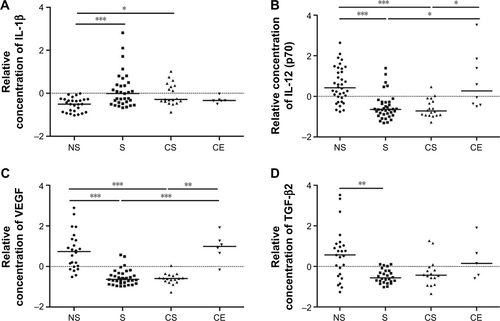
Figure S3 Comparison of the predictive components of the model for all female smokers versus female COPD smokers (x-axis) with the model for female postmenopausal smokers versus female postmenopausal COPD smokers (y-axis).
Note: P(corr) [1] is the scaled loadings of predictive component for the respective OPLS model.
Abbreviations: COPD, chronic obstructive pulmonary disease; OPLS, orthogonal projections to latent structures.
![Figure S3 Comparison of the predictive components of the model for all female smokers versus female COPD smokers (x-axis) with the model for female postmenopausal smokers versus female postmenopausal COPD smokers (y-axis).Note: P(corr) [1] is the scaled loadings of predictive component for the respective OPLS model.Abbreviations: COPD, chronic obstructive pulmonary disease; OPLS, orthogonal projections to latent structures.](/cms/asset/228894aa-01e9-42bf-b45d-e80c2056ab39/dcop_a_113625_sf0003_b.jpg)