

Abstract
Biomarkers for the management of chronic obstructive pulmonary disease (COPD) are limited. The aim of this study was to explore new plasma biomarkers in patients with COPD. Thyroxine-binding globulin (THBG) was initially identified by proteomics in a discovery panel and subsequently verified by enzyme-linked immunosorbent assay in another verification panel with a 1-year follow-up. THBG levels were elevated in patients with COPD (9.2±2.3 μg/mL) compared to those of the controls (6.6±2.0 μg/mL). Receiver operating characteristic curves suggested that THBG was able to slightly differentiate between patients with COPD and controls (area under the curve [AUC]: 0.814) and performed better if combined with fibrinogen (AUC: 0.858). THBG was more capable of distinguishing Global Initiative for Obstructive Lung Disease stages I–III and IV (AUC: 0.851) compared with fibrinogen (AUC 0.582). THBG levels were negatively associated with predicted percentage forced expiratory volume in 1 s and positively related to predicted percentage residual volume, RV/percentage total lung capacity, and percentage low-attenuation area. COPD patients with higher baseline THBG levels had a greater risk of acute exacerbation (AE) than those with lower THBG levels (P=0.014, by Kaplan–Meier curve; hazard ratio: 4.229, by Cox proportional hazards model). In summary, THBG is a potential plasma biomarker of COPD and can assist in the management of stable stage and AEs in COPD patients.
Supplementary materials
Figure S1 Quality control of iTRAQ-labeling proteomics in the discovery panel.
Notes: (A) A total of 362,175 total spectra, 43,184 spectra and 30,819 unique spectra were identified, demonstrating that the number and quality of spectras used to identify proteins were enough. The number of peptides and unique peptides were 3,270 and 2,629, respectively, indicating that the number and quality of peptides used to quantify levels of proteins were enough. A total of 636 proteins were identified, suggesting that enough proteins were used to find the differentially expressed proteins. (B) Numbers of amino acids of most peptides identified by proteomics were distributed between 7 and 30, indicating that the length of most peptides is appropriate. (C) Mass delta of most peptides were distributed within 10 ppm (0.01Da), indicating accuracy of identified peptides was good. The unique peptides, whose mascot scores were greater than 40, were used to quantify levels of proteins in this study. (D) CV% of 79.1% of proteins were less than 20%, indicating that variation of quantifying results of protein levels were very small. The left y-axis reflects the blue bar graph and the right y-axis reflects the red line graph.
Abbreviations: COPD, chronic obstructive pulmonary disease; iTRAQ, isobaric tags for relative and absolute quantification; CV, coefficient of variation.
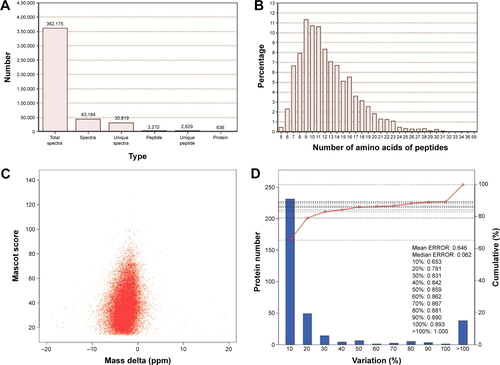
Figure S2 Verification for potential candidates using ELISA in the discovery panel.
Notes: To present the changing trend directly, controls of each group were adjusted to 1. Relative intensity quantified by iTRAQ is presented in the left panel. Relative concentration quantified by ELISA is shown in the right panel. The results measured by iTRAQ and ELISA were similar.
Abbreviations: COPD, chronic obstructive pulmonary disease; ELISA, enzyme-linked immunosorbent assay; Gal-7, galectin-7; iTRAQ, isobaric tags for relative and absolute quantification; Per-2, peroxirodoxin-2; THBG, thyroxine-binding globulin.
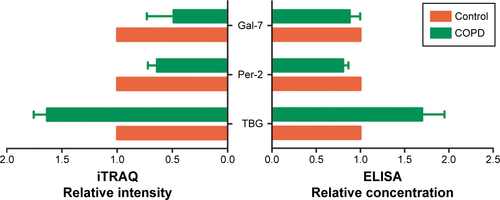
Figure S3 Levels of galectin-7 and peroxirodoxin-2 between groups in the verification panel.
Notes: (A) and (B) represent two different grouping types of galectin-7 (control vs COPD and control vs GOLD I–IV, respectively); (C) and (D) represent two different grouping types of peroxirodoxin-2 (control vs COPD and control vs GOLD I-IV, respectively). Due to plasma levels of galectin-7 being very low, it was only detected in 22 subjects (n=6, control; n=3, GOLD I; n=4, GOLD II; n=5, GOLD III; and n=4, GOLD IV). Galectin-7 and peroxirodoxin-2 in plasma were not statistically different among different groups.
Abbreviations: COPD, chronic obstructive pulmonary disease; GOLD, Global Initiative for Obstructive Lung Disease; NS, not significant.
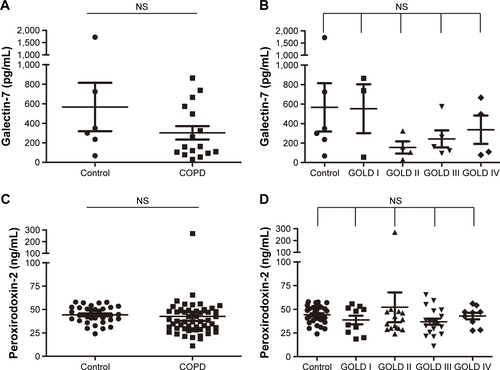
Figure S4 Levels of A1AT between groups in the verification panel.
Notes: (A) Compared levels of A1AT between control and COPD; and (B) compared levels between control and GOLD I–IV. A1AT (SERPINA1) and THBG (SERPINA7) are serpin family A (SERPINA)-1 and -7, respectively; thus, the levels of A1AT were also detected as a reference. Levels of A1AT were not significantly different among different groups.
Abbreviations: A1AT alpha-1 antitrypsin; COPD, chronic obstructive pulmonary disease; GOLD, Global Initiative for Obstructive Lung Disease; NS, not significant; THBG, thyroxine-binding globulin.
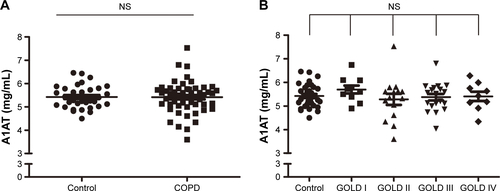
Figure S5 Predicting the ability of baseline THBG for alteration of FEV1%pred, RV/TLC%, and RV%pred within 1-year follow-up.
Notes: (A), (B) and (C) represent the difference between low- and high-level group in ΔFEV1%pred, ΔRV/TLC and ΔRV%pred, respectively. ΔFEV1%pred represents FEV1%pred before follow-up minus FEV1%pred after follow-up. Computing method of ΔRV/TLC and ΔRV%pred was the same as for FEV1%pred. Subjects were divided into the high- and low-level groups based on the median of THBG (7.96 μg/mL) in all subjects. Control: n=29; COPD: n=37. Baseline THBG levels did not predict the progression of FEV1, RV/TLC, and RV in this follow-up program.
Abbreviations: COPD, chronic obstructive pulmonary disease; FEV1, forced expiratory volume in 1 s; NS, not significant; pred, predicted; RV, residual volume; THBG, thyroxine-binding globulin; TLC, total lung capacity.
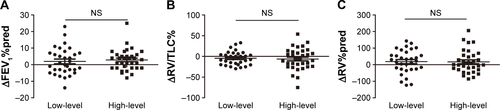
Table S1 Baseline data of subjects in the discovery panel
Table S2 Differentially expressed proteinsTable Footnote* between smokers with or without COPD
Table S3 Corrected difference of THBG levels between groups by multivariate models
Table S4 Area under the curve and cutoff values of THBG, fibrinogen, and their combination
Table S5 The association of THBG and clinical indexes of subjects
Table S6 Corrected association of THBG with main clinical indexes by multivariate models
Table S7 HR of THBG for AE based on Cox proportional hazards models
Acknowledgments
The authors thank all contributors to the study. In addition, they thank BGI (Shenzhen, China), for performing the proteomic analyses. This work was supported by the National Natural Science Foundation of China (grant numbers 81270097 and 81470235) and Beijing Medical University (grant number 20110176). The funders had no role in study design, data collection and analysis, the decision to publish, or the preparation of the manuscript.
Author contributions
All authors declare their individual contributions to the article. Bei He completed the global design of the study and revised the article; Wenqi Diao conducted statistical analyses and interpretation and wrote the manuscript; Ning Shen and Yipeng Du enrolled subjects and obtained plasma samples; Xiaoyan Sun performed lung function tests for all subjects; Beibei Liu collected the clinical information of subjects; Ming Xu assisted in the revision of the manuscript. All authors contributed to the data analysis, drafting, and critical revision of the paper; approved the final version of the manuscript; and agreed to be accountable for all aspects of the work.
Disclosure
The authors report no conflicts of interest in this work.