
Abstract
Background
Little is known about in vivo alterations at bronchial and vascular levels in severe pulmonary hypertension (PH) of different etiologies. We aimed to compare quantitative computed tomography (CT) data from the following three groups of severe precapillary PH patients: COPD, idiopathic pulmonary arterial hypertension (iPAH), and chronic thromboembolic PH (CTEPH).
Patients and methods
This study was approved by the institutional review board. Severe PH patients (mean pulmonary arterial pressure [mPAP] ≥35 mmHg) with COPD, iPAH, or CTEPH (n=24, 16, or 16, respectively) were included retrospectively between January 2008 and January 2017. Univariate analysis of mPAP was performed in each severe PH group. Bronchial wall thickness (WT) and percentage of cross sectional area of pulmonary vessels less than 5 mm2 normalized by lung area (%CSA<5) were measured and compared using CT, and then combined to arterial partial pressure of oxygen (PaO2) to generate a “paw score” compared within the three groups using Kruskal–Wallis and its sensitivity using Fisher’s exact test.
Results
WT was higher and %CSA<5 was lower in the COPD group compared to iPAH and CTEPH groups. Mosaic pattern was higher in CTEPH group than in others. In severe PH patients secondary to COPD, mPAP was positively correlated to %CSA<5. By contrast, in severe iPAH, this correlation was negative, or not correlated in severe CTEPH groups. In the COPD group, “paw score” showed higher sensitivity than in the other two groups.
Conclusion
Unlike in severe iPAH and CTEPH, severe PH with COPD can be predicted by “paw score” reflecting bronchial and vascular morphological differential alterations.
Plain language summary
Mortality of pulmonary hypertension (PH) increases with severity of the disease. It is thus crucial to identify severe forms of PH, characterized by a higher elevation of mPAP. In addition, little is known about bronchial and vascular alterations in severe PH of different etiologies.
Our purpose was to compare the following three groups of severe precapillary PH patients using quantitative computed tomography (CT): COPD, idiopathic pulmonary arterial hypertension (iPAH) and chronic thromboembolic PH (CTEPH).
Bronchial wall thickness (WT) was higher and small pulmonary vessels area was lower in the COPD group compared to iPAH and CTEPH groups. The mPAP was positively correlated to small pulmonary vessels area in the COPD group and negatively or not correlated in iPAH or CTEPH groups.
Unlike severe iPAH or CTEPH, severe PH secondary to COPD is characterized by vascular and bronchial morphological alterations assessed by quantitative CT. These values combined with that of PaO2 in a “paw score” can predict the presence of severe PH, only in COPD patients. Such a paw score could be thus used to select COPD patients for right heart catheterization.
Introduction
Pulmonary hypertension (PH) is defined by a mean pulmonary arterial pressure (mPAP) ≥25 mmHg, at rest, subsequently inducing right heart failure, and ultimately patient’s death.Citation1,Citation2 Among the five groups of PH, defined in the last international classification,Citation1 three of them correspond to a precapillary PH (ie, PH due to lung diseases and/or hypoxemia [group 3], pulmonary arterial hypertension [(PAH), group 1] notably idiopathic PAH (iPAH), and chronic thromboembolic PH [(CTEPH), group 4)]. Despite comparable hemodynamic alterations assessed invasively by right heart catheterization (RHC), these three groups have different underlying mechanisms, treatment, and prognosis.Citation1
The mortality of PH increases by more than fourfold when the mPAP increases by 10 mmHg.Citation3 It is thus crucial to identify severe forms of PH, characterized by a higher elevation of mPAP.Citation4 In patients with COPD (group 3), severe PH is defined as mPAP ≥35 mmHg at rest.Citation5 However, RHC cannot be performed in all COPD patients. To circumvent this limitation, a “paw score” was proposed, combining arterial partial pressure of oxygen (PaO2) and quantitative computed tomography (CT) measurements of both bronchial wall thickness (WT) and small pulmonary vessels. This “paw score” was able to predict the presence of severe PH in a COPD population with 75% sensitivity and 80% specificity.Citation6 Interestingly, its negative predictive value was more than 95%, allowing to predict the absence of severe PH when the “paw score” was <5 with <5% error.Citation6 Although the “paw score” appeared accurate in a COPD population, it remains unclear whether this score may be relevant to other forms of severe PH. Moreover, relationships between mPAP and quantitative CT measurements of both bronchi and small pulmonary vessels have not been described so far in the various groups of patients with severe precapillary PH.
Thus, we aimed at comparing quantitative CT measurements of bronchial wall, lung parenchyma, and small pulmonary vessels in patients with severe precapillary PH related to COPD, iPAH, or CTEPH. We also assessed correlations between mPAP, CT, clinical, and functional parameters in order to find predictors of mPAP variability. Finally, we compared the sensitivity of the “paw score” to diagnose severe PH in each of these three groups.
Patients and methods
Study population
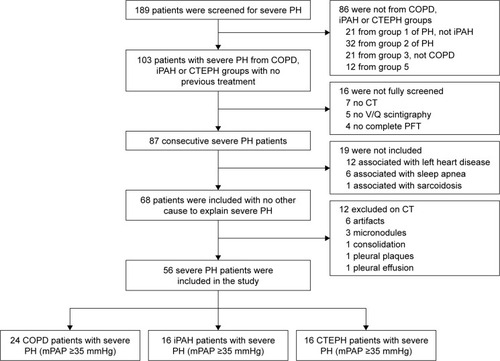
This study was observational, retrospective, and conducted according to the principles of the Declaration of Helsinki and approved by our institutional review board. One hundred eighty-nine patients were consecutively referred for complete examination of severe PH to our institution, a tertiary medical center, between January 2008 and January 2017. From a prior study,Citation6 20 COPD patients were also included in the current study (out of 24 patients) and none in the two other groups. However, these 20 patients were completely reanalyzed by another radiologist and they were implemented with four new subjects. Before initiation of any treatment, within 1 week, all patients had physical examination, medical questioning, 6-minute walk tests (6-MWT), blood tests (C-reactive protein [CRP], brain natriuretic peptide, and HIV serology), transthoracic-echocardiography, ventilation/perfusion scintigraphy, pulmonary function test (PFT), RHC, and unenhanced CT within a minimal period of 1 month of disease stability. PFT involved body plethysmography, transfer lung capacity of carbon monoxide ([TLCO]; Medisoft, Sorinnes, Belgium), and arterial blood gases. Reference values were chosen from the European Respiratory Society and the American Thoracic Society guidelines.Citation7,Citation8 From the 189 screened patients, 103 patients had both mPAP value ≥35 mmHg at RHCCitation5 and a diagnosis of either COPD, iPAH, or CTEPH. However, 16 patients were not fully screened and 19 patients could not be included because of associated diseases (). Thus, from the 68 remaining patients, we focused the study on the 56 adult patients with only severe precapillary PH with either COPD, iPAH, or CTEPH, without any other condition to explain PH, and with an adequate CT examination without any abnormality possibly altering CT measurements (). Chest CT scans were acquired at full inspiration on a Somatom Definition 64 (Siemens, Munich, Germany). Dedicated and validated software were used to quantitatively analyze scans.Citation9,Citation10 Emphysema was automatically quantified with Myrian software (Intrasense, Montpellier, France) using the low-attenuation area percent (LAA%).Citation6,Citation11 Mosaic attenuation was assessed using a semiquantitative score derived from evaluation of each lobe.Citation12 Bronchial wall area (WA), lumen area, and WT were automatically quantified on orthogonal bronchial cross sections using previously validated homemade software (ie, Neko).Citation10,Citation13 Small vessel areas from CT images were automatically measured, as previously described.Citation6,Citation14–Citation18 Percentage of cross sectional area of pulmonary vessels less than 5 mm2 normalized by lung area (%CSA<5) at each CT slice were acquired using ImageJ software. Large vessel diameters were manually measured, at the level of pulmonary artery bifurcation, for both pulmonary arterial truncus (AP) and ascending aorta (AO) using the same axial image.Citation6,Citation11
Figure 1 Flowchart of study design.
Abbreviations: CT, computed tomography; CTEPH, chronic thromboembolic PH; iPAH, idiopathic pulmonary arterial hypertension; mPAP, mean pulmonary arterial pressure; PFT, pulmonary function tests; PH, pulmonary hypertension; V/Q, ventilation/perfusion scintigraphy.
Statistical analyses
Statistical analyses were performed using NCSS software (v. 2001; NCSS, Kaysville, UT, USA). Results are expressed as mean with SD and analyzed using one-way ANOVA and Tukey post hoc tests. Parameters that were not normally distributed are expressed as median with interquartile ranges and tested by Kruskal–Wallis and multiple comparisons z-value post hoc tests. Categorical variables were analyzed with Fisher’s exact tests. Univariate correlations were assessed using Pearson’s correlation coefficient test. In order to predict severe PH, “paw scores” were built, combining three variables, ie, PaO2, WT, and %CSA<5, as described elsewhere (Table S1).Citation6 P-value <0.05 was considered significant.
Details about PFT, RHC, CT protocols, echocardiography, “paw score”, and statistical analysis, are available in the electronic supplementary material.
Ethics approval and informed consent
This study was observational, retrospective, and conducted according to the principles of the Declaration of Helsinki and approved by our institutional review board “the Ethics Committee of the University Hospital of Bordeaux” reference: GP-CE 2018/20. Every patient was informed and agreed that their data can be used for further research studies anonymously. Data were anonymized and they complied with the requirements of the “Commission nationale informatique et libertés” (CNIL) that approved the methods this organization was being responsible for ensuring the ethical use of data collected for scientific purposes in France (approval number: 1909530 v 0).
Results
Patients characteristics
Among the 56 included patients with severe PH, 24 patients suffered from COPD, 16 from iPAH, and 16 from CTEPH (). Demographic, plethysmographic, clinical, biological, and hemodynamic characteristics of the three groups are detailed in . Significant lower FEV1, FEV1/FVC ratio, and TLCO, and a higher residual volume were found in COPD subjects compared to the other two groups. Moreover, both a lower PaO2 and a higher left ventricular ejection fraction were measured in COPD patients compared to iPAH patients (). The mPAP was similar in the three groups, as well as most of the RHC parameters except the systolic PAP (sPAP), which was higher in severe CTEPH patients ().
Table 1 Characteristics of severe PH patients
Comparison of CT measurements of bronchi, parenchyma, and vessels
Morphological CT parameters were compared in the three groups (). Bronchial morphological parameters were greater in COPD patients with severe PH (Figure S1) than in iPAH (ie, WT and WA; Figure S2) and CTEPH (ie, WT; Figure S3). Moreover, emphysema extent, assessed by the LAA%, was higher in patients with COPD than in those with iPAH or CTEPH. In addition, mosaic attenuation score was higher in patients with severe CTEPH than in those with iPAH or COPD. Whereas large vessels ratio was not different within the three groups, the %CSA<5 was smaller in patients with COPD than in those with iPAH.
Table 2 Comparison of CT parameters between groups
Univariate analysis of mPAP
In COPD patients with severe PH, significant univariate correlations were found between mPAP and a variety of variables including: CRP, echocardiographic sPAP, %CSA<5, and WT ( and S2). In severe iPAH patients, mPAP was correlated only with maximal tricuspid regurgitation velocity (ITVmax) and %CSA<5. Correlation between mPAP and %CSA<5 was positive in patients with COPD, whereas it was negative in those with iPAH (Figure S4). By contrast, mPAP of severe CTEPH patients was not correlated to %CSA<5, but with LAA%, TLCO, and 6-MWT.
Table 3 Univariate correlations between mPAP and CT parameters
Validity of “paw scores” in each group and comparison to sPAP on echocardiography
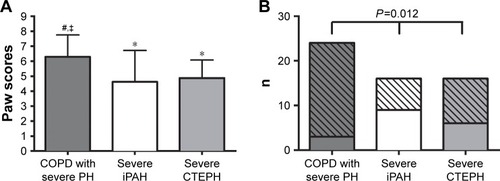
As a consequence, the “paw score” combining three variables, ie, PaO2, WT, and %CSA<5, was significantly higher in COPD patients with severe PH than in the two other groups, without any difference between severe iPAH and severe CTEPH (). Using a threshold of 5, as assessed previously,Citation6 the sensitivity of “paw score” for predicting the presence of severe PH was 87.5% (21/24), 43.8% (7/16), and 62.5% (10/16) in COPD, iPAH, and CTEPH groups, respectively. A significant difference in the number of true positives and false negatives between the three groups of severe PH was found (). We also assessed the sensitivity of ultrasound echocardiography to predict the presence of severe PH using various sPAP cutoff (ie, 50 mmHg,Citation19 60 mmHg,Citation20 and 65 mmHgCitation21 in the three groups of patients (Table S3). In COPD patients, the sensitivity of the “paw score” was higher than that of echocardiography for each cutoff.
Figure 2 Comparison of “paw score” and its sensitivity between severe PH groups.
Abbreviations: CTEPH, chronic thromboembolic PH; iPAH, idiopathic pulmonary arterial hypertension; PH, pulmonary hypertension.
Discussion
The present study demonstrates that, unlike severe iPAH or severe CTEPH, severe PH secondary to COPD is characterized by vascular and bronchial morphological alterations assessed by quantitative CT. Values derived from these measurements, combined with that of PaO2 in a “paw score” can predict the presence of severe PH, in COPD patients.
To the best of our knowledge, this quantitative CT study is the first one including cohorts from three distinct groups of precapillary severe PH, and reporting in vivo data of small vessels alterations in severe PH. Whereas these three groups presented similar values of mPAP, all being ≥35 mmHg, several differences in quantitative CT parameters between groups and univariate relationships with mPAP within groups have been highlighted. These three groups of severe PH patients allows us to consider two groups as control for the third one. Regarding bronchial parameters, we showed that WT was higher in COPD patients with severe PH, as compared to the two other groups and was positively correlated to mPAP only in COPD, as previously described in the literature,Citation6,Citation11 but not in the two other groups, a finding that has not been reported so far. Regarding vascular parameters, the %CSA<5 was lower in COPD patients with severe PH compared to iPAH. This result could be related with the emphysema extent, which was higher in COPD patients. In addition, a strong negative correlation between %CSA<5 and emphysema has been demonstrated in this study confirming previous findings.Citation15,Citation17,Citation18 Moreover, we demonstrated a positive correlation between mPAP and %CSA<5 in COPD patients with severe PH, in line with recent published results.Citation6 By contrast, this correlation was negative in severe iPAH. Such a negative correlation between mPAP values and %CSA<5 may suggest that the decrease in the number of vascular structure may accompany iPAH. This observation could be explained by angiogenesis disturbance in iPAH.Citation2,Citation22 Our finding may bring insights into this uncertainty, suggesting that severe PH in COPD may be secondary to complex pathophysiology interactions that might be different from iPAH. These opposite findings cannot, nevertheless, rule out the previously proposed hypothesis that the severity of PH in COPD might be related with coexistence of iPAH.Citation5,Citation23,Citation24 In the present study, there was also no correlation between %CSA<5 and mPAP within the CTEPH population. This result is in agreement with that published by Rahaghi et al,Citation25 who reported that the volume of small vessels with cross-sectional area <5 mm2, assessed by a 3D reconstruction of the intraparenchymal pulmonary vasculature, was not correlated with mPAP, but with cardiac index.
With respect to PFT parameters, as expected, we found marked differences between COPD and the other groups. It should be noted that three severe iPAH patients presented a mild restrictive defect, assessed by a total lung capacity lower than 80% of predicted, as previously reported by others.Citation26 Indeed, it has been hypothesized that, in iPAH, the mechanical coupling of vessels and airways with changes in vascular rigidity could lead to a reduction in lung compliance.Citation26,Citation27 Moreover, we did not observe any correlation between mPAP and PFT parameters in both COPD and iPAH groups, as already shown in previous studies.Citation6,Citation14,Citation23,Citation27 Regarding the relationship between PFT and mPAP in CTEPH, to the best of our knowledge, the lack of correlations between these parameters has not been reported before. However, we found a significant correlation between mPAP and TLCO in patients with severe CTEPH. Although hypoxia was believed to be a factor causing PH,Citation1,Citation28 in agreement with numerous studies, no significant correlation has been reported between PaO2 and mPAP within COPD group of severe PHCitation6,Citation23 and iPAH.Citation29 In the present study, the significant difference shown between COPD and iPAH groups is consistent with Chaouat et al’s report, in which COPD patients with severe PH showed severe hypoxia whereas patients with severe iPAH had only mild hypoxia.Citation6,Citation23,Citation29
Regarding quantitative CT parameters, there is a renewed interest in the identification and evaluation of COPD phenotypes, and pulmonary imaging biomarkers may contribute to determine these phenotypes. CT has several advantages in this field, being the most commonly used method for imaging the lung on one side, and, on the other side, being able to provide quantitative data related to alterations of components of the lung, ie, parenchyma, bronchi, and vascular compartments. In the particular setting of COPD, a close relationship between pulmonary arterial pressure and bronchial wall thickening has already been shown.Citation11 Quantitative CT data derived from small vessels analysis have also suggested that a vascular alteration is more likely to explain severe PH in COPD rather than an airway disease.Citation6,Citation23 The role of both bronchial and small vessel alteration in the prediction of severe PH in COPD patients is supported by our univariate analysis. Using quantitative CT, a previous hypothesis that only tissue destruction and emphysema extent could lead to the increase of mPAP in COPD patients has already been disproved by recent studies.Citation6,Citation11,Citation14 The present study confirms these results, since there was no correlation between mPAP and emphysema extent.
In this study, we found that a score combining PaO2 and both bronchial and vascular quantitative CT parameters, ie, the so-called “paw score” had a greater sensitivity for detecting severe PH in COPD patients. Interestingly, although the specificity of the “paw score” cannot be calculated, since true negatives and false positives were not available, its sensitivity was significantly higher in COPD than in iPAH and CTEPH groups, further supporting the interest of calculating the “paw score” in COPD patients only. These differences might be related to different morphological and functional alterations of bronchial and vascular components in other groups.
Other non-interventional study, ie, echocardiography, is currently used to explore PH. Indeed, in the present study, we observed that the sensitivity to detect severe PH in COPD group was higher with “paw score” than that with sPAP. Conversely, we showed that the sensitivity to detect severe PH with “paw score” was lower than that of sPAP, in iPAH or CTEPH patients. Indeed, ultrasound echocardiography is a very useful tool to detect PH. However, it suffers some limitation such as, insufficient tricuspid regurgitation prevents sPAP estimation, explaining some missing values, and in COPD patients hyperinflated lung can increase the difficulty of measurement.Citation30 These observations might suggest that echocardiography should be preferred to detect severe PH in iPAH and CTEPH patients, whereas “paw score” should be preferred in COPD patients.
The present study suffers from some limitations. First, the study design was observational and retrospective. However, 1) all consecutive patients were characterized using the same processes during the whole inclusion period; 2) the definition of severe PH (ie, mPAP ≥35 mmHg) was the same for the three groups; and 3) CT scans have been acquired and analyzed consistently in the three groups. Second, since severe PH is uncommon, the number of patients in each group was limited. Third, considering small vessel measurements, veins cannot be distinguished from arteries using CT scan. The study, however, was limited to precapillary PH at RHC. Fourth, %CSA<5 is a global measurement area, irrespective of wall and lumen changes in the vessel, thus making impossible the distinction between lumen narrowing and vessel wall thickening. Finally, a multivariate analysis has not been performed since it would have been underpowered by the low number of patient in each group.
Conclusion
We demonstrated that the “paw score” (ie, combination of quantitative CT measurements of both bronchial thickness and vascular alterations with PaO2) can predict the presence of severe PH, in COPD patients only. Thus, the “paw score” is not appropriate to predict PH severity in iPAH or in CTEPH patients. Therefore, quantitative CT may be used to select among patients with COPD, who should be prioritized for RHC.
Author contributions
Conception and design: FC, GD, FL, PB; analysis and interpretation: FC, IB, GD, FL, PB; drafting the manuscript for important intellectual content: FC, IB, GD, FL, PB; revising the manuscript for important intellectual content: FC, IB, GD, RM, FL, PB; and final approval of the manuscript: FC, IB, GD, CD, EB, POG, MM, FB, FP, RM, FL, PB. All authors contributed to data analysis, drafting and revising the article, gave final approval of the version to be published, and agree to be accountable for all aspects of the work.
Acknowledgments
Berger reports grants from Laboratory of Excellence (LabEx) Transitional Research International Laboratory (TRAIL, Université de Bordeaux, France) ANR-10-LABX-57, during the conduct of the study. Laurent reports grants from TRAIL ANR-10-LABX-57, during the conduct of the study. Coste reports funding for salary from LabEx TRAIL ANR-10-LABX-57, during the conduct of the study. This study has received funding from the LabEx TRAIL, ANR-10-LABX-57.
Data availability
The datasets used and/or analyzed during the current study are available from the corresponding author on reasonable request.
Disclosure
Berger reports personal fees, nonfinancial support from Novartis, Boehringer Ingelheim, AstraZeneca, and GSK outside the submitted work; in addition, he has a patent EP N°15152886.6, ie, new compositions and methods of treating and/or preventing COPD, which is pending. Laurent reports personal fees from Boehringer Ingelheim, Roche, Novartis, Bayer, Guerbet, and Chiesi outside the submitted work. Girodet reports personal fees and nonfinancial support from Novartis, Chiesi, Takeda, Boehringer Ingelheim, and AstraZeneca outside the submitted work. The other authors report no conflicts of interest in this work.
References
- GalièNHumbertMVachieryJL2015 ESC/ERS guidelines for the diagnosis and treatment of pulmonary hypertension: the joint Task Force for the diagnosis and treatment of pulmonary hypertension of the European Society of cardiology (ESC) and the European Respiratory Society (ERS): endorsed by: association for European paediatric and congenital cardiology (AEPC), International Society for Heart and lung transplantation (ISHLT)Eur Respir J201546490397526318161
- GuignabertCTuLLe HiressMPathogenesis of pulmonary arterial hypertension: lessons from cancerEur Respir Rev20132213054355124293470
- CooperRGhaliJSimmonsBECastanerAElevated pulmonary artery pressure. An independent predictor of mortalityChest19919911121201824624
- BarstRJRubinLJLongWAA comparison of continuous intravenous epoprostenol (prostacyclin) with conventional therapy for primary pulmonary hypertensionN Engl J Med199633452963018532025
- SeegerWAdirYBarberàJAPulmonary hypertension in chronic lung diseasesJ Am Coll Cardiol20136225 SupplD109D11624355635
- CosteFDournesGDromerCCT evaluation of small pulmonary vessels area in patients with COPD with severe pulmonary hypertensionThorax201671983083727084957
- MillerMRHankinsonJBrusascoVStandardisation of spirometryEur Respir J200526231933816055882
- WangerJClausenJLCoatesAStandardisation of the measurement of lung volumesEur Respir J200526351152216135736
- MontaudonMLederlinMReichSBronchial measurements in patients with asthma: comparison of quantitative thin-section CT findings with those in healthy subjects and correlation with pathologic findingsRadiology2009253384485319789219
- BergerPPerotVDesbaratsPTunon-de-LaraJMMarthanRLaurentFAirway wall thickness in cigarette smokers: quantitative thin-section CT assessmentRadiology200523531055106415833982
- DournesGLaurentFCosteFComputed tomographic measurement of airway remodeling and emphysema in advanced chronic obstructive pulmonary disease. Correlation with pulmonary hypertensionAm J Respir Crit Care Med20151911637025393421
- HoeyETMirsadraeeSPepke-ZabaJJenkinsDPGopalanDScreatonNJDual-energy CT angiography for assessment of regional pulmonary perfusion in patients with chronic thromboembolic pulmonary hypertension: initial experienceAJR Am J Roentgenol2011196352453221343493
- MontaudonMBergerPde DietrichGAssessment of airways with three-dimensional quantitative thin-section CT: in vitro and in vivo validationRadiology2007242256357217179398
- MatsuokaSWashkoGRYamashiroTPulmonary hypertension and computed tomography measurement of small pulmonary vessels in severe emphysemaAm J Respir Crit Care Med2010181321822519875683
- MatsuokaSWashkoGRDransfieldMTQuantitative CT measurement of cross-sectional area of small pulmonary vessel in COPD: correlations with emphysema and airflow limitationAcad Radiol2010171939919796970
- UejimaIMatsuokaSYamashiroTYagihashiKKuriharaYNakajimaYQuantitative computed tomographic measurement of a cross-sectional area of a small pulmonary vessel in nonsmokers without airflow limitationJpn J Radiol201129425125521607838
- WangZChenXLiuKSmall pulmonary vascular alteration and acute exacerbations of COPD: quantitative computed tomography analysisInt J Chron Obstruct Pulmon Dis2016111965197127578971
- YoshimuraKSuzukiYUtoTSatoJImokawaSSudaTMorphological changes in small pulmonary vessels are associated with severe acute exacerbation in chronic obstructive pulmonary diseaseInt J Chron Obstruct Pulmon Dis2016111435144527418816
- BarstRJMcGoonMTorbickiADiagnosis and differential assessment of pulmonary arterial hypertensionJ Am Coll Cardiol20044312 Suppl SS40S47
- StrangeGPlayfordDStewartSPulmonary hypertension: prevalence and mortality in the Armadale echocardiography cohortHeart201298241805181122760869
- FisherMRForfiaPRChameraEAccuracy of Doppler echocardiography in the hemodynamic assessment of pulmonary hypertensionAm J Respir Crit Care Med2009179761562119164700
- MooiWWagenvoortCADecreased numbers of pulmonary blood vessels: reality or artifact?J Pathol198314144414476363654
- ChaouatABugnetASKadaouiNSevere pulmonary hypertension and chronic obstructive pulmonary diseaseAm J Respir Crit Care Med2005172218919415831842
- BarberàJAPeinadoVISantosSPulmonary hypertension in chronic obstructive pulmonary diseaseEur Respir J200321589290512765440
- RahaghiFNRossJCAgarwalMPulmonary vascular morphology as an imaging biomarker in chronic thromboembolic pulmonary hypertensionPulm Circ201661708127162616
- BurkeCMGlanvilleARMorrisAJPulmonary function in advanced pulmonary hypertensionThorax19874221311353433237
- MeyerFJEwertRHoeperMMPeripheral airway obstruction in primary pulmonary hypertensionThorax200257647347612037220
- StenmarkKRFaganKAFridMGHypoxia-induced pulmonary vascular remodeling: cellular and molecular mechanismsCirc Res200699767569117008597
- KanemotoNSasamotoHPulmonary hemodynamics in primary pulmonary hypertensionJpn Heart J1979204395405470138
- ArcasoySMChristieJDFerrariVAEchocardiographic assessment of pulmonary hypertension in patients with advanced lung diseaseAm J Respir Crit Care Med2003167573574012480614