
 ?Mathematical formulae have been encoded as MathML and are displayed in this HTML version using MathJax in order to improve their display. Uncheck the box to turn MathJax off. This feature requires Javascript. Click on a formula to zoom.
Abstract
Purpose
The purpose of this study was to investigate the reproducibility of fluid-phase measurements in PBS-treated sputum supernatant, processed using the two-step method, of healthy and stable COPD individuals.
Methods
Nine healthy subjects and 23 stable COPD patients provided sputum twice within 6 days. A two-step sputum processing method was used to obtain PBS-treated supernatant and sputum cells. Soluble protein markers and IgG and IgM autoantibody profiles in PBS supernatant were analyzed using customized microarrays. Repeatability of measurements was assessed by paired-sample testing and an intraclass correlation coefficient, then graphically reported by Bland–Altman plot.
Results
There was no significant difference between the repeated detection of 8/10 types of soluble protein markers, all 13 types of IgG autoantibodies, and 12/13 types of corresponding IgM autoantibodies in PBS supernatant. The repeatability of measurements in PBS supernatant was substantial to very good for interleukin 6 (IL6), IL8, IL13, IL10, IL33, vascular endothelial growth factor, soluble receptor for advanced glycation end-products, and tumor necrosis factor-α; for IgG autoantibodies against aggrecan, centromere protein B (CENP-B), collagen II, collagen IV, cytochrome C, elastin, heat shock protein 47 (HSP47), HSP70, and La/Sjögren syndrome type B antigen; for IgM autoantibodies against CENP-B, collagen I, collagen II, collagen IV, cytokeratin 18, and HSP70; and for sputum neutrophils, macrophages and eosinophils count. Bland–Altman plots suggested good consistency within repeated measurements. Stable COPD patients differed from healthy subjects in the proportion of neutrophils and eosinophils; relative fluorescence intensity of anti-cytochrome C IgG, anti-aggrecan IgM, and anti-cytochrome C IgM. There was a significant positive correlation for stable COPD patients between sputum anti-collagen II IgG and post-bronchodilator FEV1%.
Conclusion
We confirmed fluid-phase measurements in PBS-treated sputum supernatant by high-throughput techniques with good repeatability. We demonstrated the presence of IgG and IgM autoantibodies to multiple antigens in the airways of COPD patients.
Introduction
Sputum examination is increasingly used as a noninvasive tool to assess airway disease, especially asthma and COPD. The measurement of fluid-phase markers in sputum can help to explore mechanisms of airway disease progression and patient response to drugs.Citation1 The detection of cytokine levels in induced sputum (eg, interleukin 6 [IL6], IL8, tumor necrosis factor-α [TNFα], and vascular endothelial growth factor [VEGF]) contributed to investigations of the effect of cigarette smoke on chronic airway inflammation, an important pathological feature of COPD.Citation2,Citation3 In 2003, a largely unexplored role was suggested for the immune system in the pathogenesis of COPD.Citation4 Recent findings indicate that autoantibody profiles may be used to determine COPD risk and provide a diagnostic and prognostic tool.Citation5 The detection of soluble protein markers and autoantibodies in sputum may provide a basis for exploring local immune subtypes of COPD. However, there have been no available studies of sputum autoantibody profiles in COPD patients.
As noted in a recent review, the production, preparation, and dispersal of sputum all can affect the levels of fluid-phase markers in sputum.Citation16 In the traditional sputum processing method, dithiothreitol (DTT) is used to break the disulfide bonds in mucin molecules, thereby allowing the release of cells; this is more effective in dispersing cells than PBS.Citation7 However, as a strong reducing agent, DTT may decrease the biological activity of cytokines, many of which rely on disulfide bonds to provide a stable structure for bioactivity.Citation1 DTT may also disrupt the disulfide bonds present in the capture antibodies of immunoassays, resulting in reduced assay sensitivity.Citation1,Citation8 Bafadhel et al proposed a “two-step” sputum processing method for supernatant and cytospin preparation that yielded increased recovery of mediators in PBS-treated sputum, compared with DTT-treated sputum.Citation9 This method has been widely used in supernatant purification, as it involves initial PBS processing for PBS supernatant, followed by DTT to obtain cells.Citation10–Citation12 This avoids interference of DTT on soluble mediator analysis from sputum supernatant. However, the reproducibility of fluid-phase measurements in sputum treated with PBS and without DTT has not yet been investigated.
In this study, we investigated the reproducibility of fluid-phase measurements in PBS supernatant, by recruiting stable COPD and healthy subjects for comparing high-throughput measurements of soluble protein markers and autoantibody profiles of sputum obtained within a 6-day period.
Materials and methods
Study design
This was a cross-sectional study examining soluble protein markers and autoantibodies in the sputum supernatant of healthy subjects and stable COPD patients. The study was conducted in accordance with the Declaration of Helsinki and approved by The Ethics Committee of The First Affiliated Hospital of Guangzhou Medical University (No 201722). The clinical trial was registered with www.ClinicalTrials.gov (NCT 03240315).
Subjects
The study population comprised nine healthy subjects and 23 stable COPD patients. COPD was identified on the basis of the GOLD guidelines. Medications for COPD patients were unchanged during the study. Exclusion criteria for COPD patients were a history of significant inflammatory disease, a history of other lung disease, recent exacerbation of COPD treated with antibiotics or steroid, active cancer under treatment, enrollment in a long-term blinded drug study. Healthy subjects were free from significant disease as determined by history, physical examination, and screening investigations. They had post-bronchodilator FEV1/FVC ratio >70%. Signed and dated written informed consent was obtained from all subjects prior to participation. All consenting subjects provided sputum twice within 6 days. Baseline conditions were required to be constant (diet, time of collection, therapies, and absence of respiratory tract infection).
Sputum processing
Sputum was processed within 2 hours, in accordance with an adaptation of previous methodology.Citation13 Selected and weighed sputum specimens were placed in an Eppendorf tube and incubated with an 8× volume (sputum weight) of PBS, placed on ice on a bench rocker for 15 minutes, rocked for 15 seconds every 5 minutes during ice bath. The mixture was centrifuged at 1,000 ×g for 10 minutes by a low-temperature centrifuge at 4°C. The suspension was filtered through a 0.22-μm bacterial filter to remove bacteria, then a 4× volume of the supernatant was aspirated and stored in frozen storage tubes at −80°C for subsequent assays; this was identified as the PBS supernatant. The remainder of the solute was treated with a 2× volume of 0.3% DTT for cytospin preparation. Adjusting for the specimen size, the PBS supernatant of all subjects was examined for soluble protein markers; the PBS supernatant of nine healthy subjects and 19 stabilized COPD patients was used for autoantibody detection.
Microarray analysis of sputum soluble protein markers
The levels of B-cell activation factor (BAFF), interferon-γ (INFγ), IL4, IL5, IL6, IL8, IL10, IL13, IL17, IL33, IL1β, TNFα, leptin, transforming growth factor-β (TGFβ), soluble receptor for advanced glycation end-products (sRAGE), and VEGF in sputum supernatant samples were determined in quadruplicate, using a customized microarray (Human Cytokine Antibody Microarray slides; RayBiotech, Inc., Norcross, GA, USA).
Microarray analysis of sputum autoantibody profiles
The levels of IgG autoantibodies and IgM autoantibodies against elastin, aggrecan, amyloid, centromere protein B (CENP-B), collagen I, collagen II, collagen IV, cytochrome C, cytokeratin 18, heat shock protein 47 (HSP47), HSP70, La/Sjögren syndrome type B antigen (SS-B), and vimentin in sputum supernatant samples were determined in quadruplicate, using a customized microarray (Human Array-COPD Microarray slides; RayBiotech, Inc., Norcross, GA, USA).
Data analysis
We conducted statistical analysis using SPSS 19.0, MedCalc 15.8, and Origin 2017. The demographic characteristics of subjects were presented by descriptive statistics. Categorical variables were expressed in integers; differences between groups were analyzed by chi-squared tests. Parametric and nonparametric data were presented as mean and median, respectively; while differences between groups were performed by independent-samples t-test and Mann–Whitney U test, respectively.
A paired-sample test was used to compare variables between day 1 and day 2 to determine whether the overall mean effects at different times were identical. Comparisons between repeated measurements were performed using a paired t-test if the difference between 2 days (d = day 1 – day 2) was normally or logarithmically normally distributed, and using a Wilcoxon matched-pair signed-rank test if d was non-normally distributed. The repeatability of measurements was tested by intraclass correlation coefficient (ICC) and graphically depicted by Bland–Altman plotting.Citation14–Citation16 The ICC version was defined by two-way random effects model, using average and consistency measurement type with inter-item correlations. According to Landis and Koch, the degree of repeatability between 0.01 and 0.20 was deemed minor, 0.21–0.40 was fair, 0.41–0.60 was moderate, 0.61–0.80 was substantial, and 0.81–1.00 was very good.Citation17 The bias between repeated measurements was estimated as the mean difference between 2 days . The variation of
is described by the SD of the difference (SD). In Bland–Altman plotting, the limits of agreement (LoA) were estimated by 95% CI of
(
,
); adjusting for sampling error, the 95% CI of the upper and lower bounds of LoA (LOA CI) was also shown in the Bland–Altman plots. Outliers with z-scores of >3 or <−3 were removed to avoid distorting SD boundaries.
The correlation between variables was examined by Spearman rank correlation coefficient; correlation (r) values above 0.50 were considered relevant if they were significant at the 0.05 level. Between-group comparisons and correlations were examined for sputum obtained on day 1.
Results
The demographic and clinical characteristics of all subjects are shown in . There were no significant differences in age, sex, number of smokers, or smoking history (pack-years) between healthy and stable COPD groups. More than 50% of the data were undetectable for BAFF, IFN-γ, IL4, IL17, leptin, and TGFβ; thus, these markers were removed. All measurement results are provided in and basic scatter plots with the pair-wise comparisons of the two measurements are provided in –.
Table 1 Demographic and clinical characteristics of subjects
Reproducibility of soluble protein marker detections in sputum
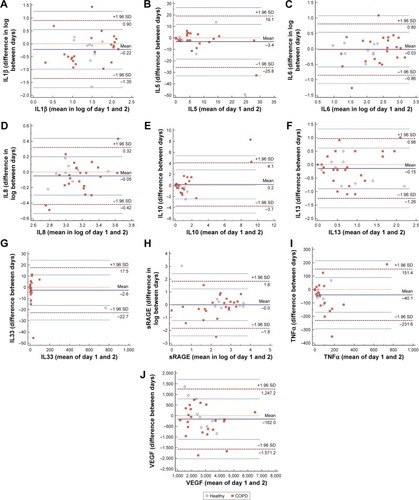
Paired t-tests and Wilcoxon matched-pair signed-rank tests showed no significant differences between the repeated detection of IL5, IL6, IL8, IL10, IL13, IL33, sRAGE, and VEGF; differences were detected for IL1β (P=0.036) and TNFα (P=0.039) (; ). The repeatability of soluble protein markers in PBS supernatant shown by ICC was very good for IL10, IL33, and VEGF; substantial for IL6, IL8, IL13, sRAGE, and TNFα; moderate for IL5; and fair for IL1β (). For IL5, IL8, IL13, and VEGF in PBS supernatant, all data points were within the LoA CI in Bland–Altman plots (). There was only 1/32 (3.1%) data point outside the LoA CI for IL1β, IL6, IL10, IL33, and TNFα; 2/32 (6.2%) data points were outside the LoA CI for sRAGE ().
Table 2 Paired-samples test results
Figure 1 Bland–Altman plots of soluble protein markers in sputum supernatant. Bland–Altman plots of (A) IL1β; (B) IL5; (C) IL6; (D) IL8; (E) IL10; (F) IL13; (G) IL33; (H) sRAGE; (I) TNFα; and (J) VEGF.
Reproducibility of autoantibody detections in sputum
There were no differences between repeated detections for all 13 types of IgG autoantibodies (aggrecan, amyloid, CENP-B, collagen I, collagen II, collagen IV, cytochrome C, cytokeratin 18, elastin, HSP47, HSP70, SS-B, and vimentin) and for 12 types of corresponding IgM autoantibodies; a difference was detected for CENP-B IgM (P=0.014) in sputum supernatant (; and ).
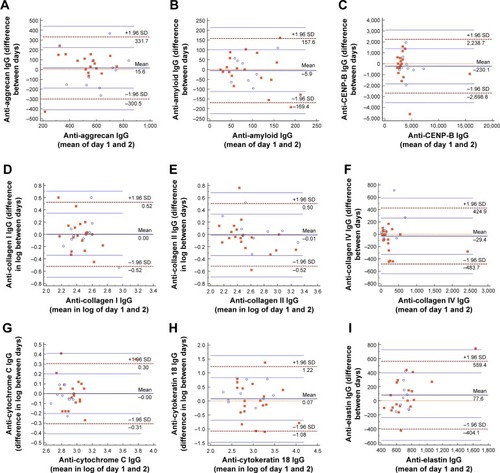
The repeatability shown by ICC was very good for IgG autoantibodies against aggrecan, CENP-B, collagen II, HSP47, HSP70, and SS-B; substantial for IgGs against cytochrome C, collagen IV, and elastin; moderate for anti-vimentin IgG; fair for anti-collagen I and anti-cytokeratin 18 IgGs; and minor for IgG against amyloid (). All data points were within the LoA CI in Bland–Altman plots for IgGs against amyloid, collagen I, cytochrome C, cytokeratin 18, HSP70, and vimentin (). There was only 1/28 (3.6%) data point outside the LOA CI for the remaining seven types of IgGs ().
Table 3 Intraclass correlation coefficient (ICC) assessment results
Figure 2 Bland–Altman plots of IgG autoantibodies in sputum supernatant. Bland–Altman plots of (A) anti-aggrecan IgG; (B) anti-amyloid IgG; (C) anti-CENP-B IgG; (D) anti-collagen I IgG; (E) anti-collagen II IgG; (F) anti-collagen IV IgG; (G) anti-cytochrome C IgG; (H) anti-cytokeratin 18 IgG; (I) anti-elastin IgG; (J) anti-HSP47 IgG; (K) anti-HSP70 IgG; (L) anti-SS-B IgG; and (M) anti-vimentin IgG.
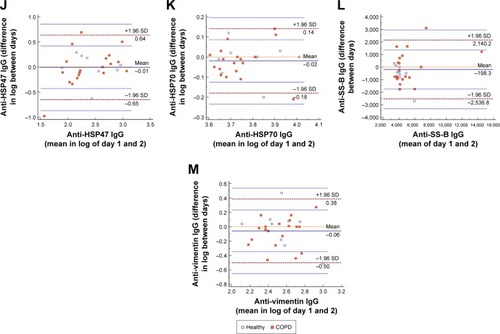
The repeatability of IgM autoantibody in PBS supernatant, shown by ICC, was very good for IgMs against CENP-B, collagen II, cytokeratin 18, and HSP70; substantial for IgMs against collagen I and collagen IV; moderate for anti-cytochrome C, anti-SS-B, and anti-vimentin IgMs; fair for anti-elastin IgM; and minor for IgMs against aggrecan, amyloid, and HSP47 (). All data points were within the LoA CI in Bland–Altman plots for IgMs against amyloid and collagen I (). There was only 1/28 (3.6%) data point outside the LOA CI for the remaining eleven types of IgM ().
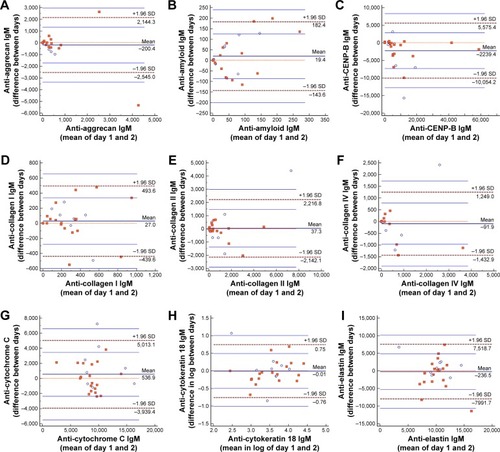
Figure 3 Bland–Altman plots of IgM autoantibodies in sputum supernatant. Bland–Altman plots of (A) anti-aggrecan IgM; (B) anti-amyloid IgM; (C) anti-CENP-B IgM; (D) anti-collagen I IgM; (E) anti-collagen II IgM; (F) anti-collagen IV IgM; (G) anti-cytochrome C IgM; (H) anti-cytokeratin 18 IgM; (I) anti-elastin IgM; (J) anti-HSP47 IgM; (K) anti-HSP70 IgM; (L) anti-SS-B IgM; and (M) anti-vimentin IgM.
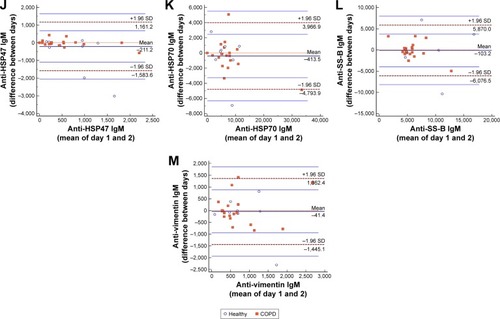
All Bland–Altman plots for fluid phase in PBS supernatant showed that the solid line representing the mean difference was close to the dotted line representing a mean difference of 0. In the assessment of the distribution of data points in Bland–Altman plots as described above, there was a good consistency in repeated measurement.
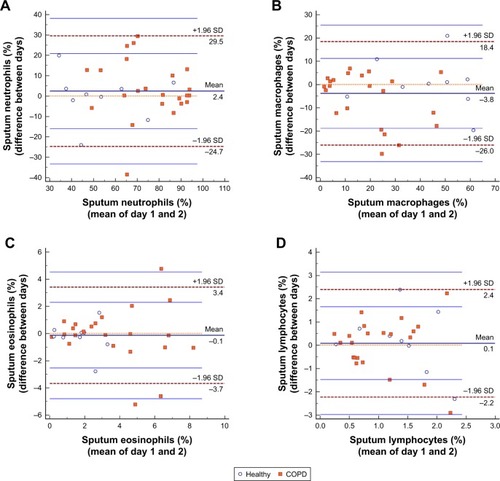
Repeatability of sputum cell counts
There were no differences between repeated detection for differential cell counts in sputum (; ). The reproducibility of sputum cell counts was very good for neutrophils (0.86), macrophages (0.87), and eosinophils (0.84); it was moderate for lymphocytes (0.40) (). All data points were within the LoA CI in Bland–Altman plots for macrophages and lymphocytes (). There was only 1/32 (3.1%) data point outside the LoA CI for neutrophils; 2/32 (6.2%) data points were outside the LoA CI for eosinophils ().
Figure 4 Bland–Altman plots of sputum cell counts. Bland–Altman plots of (A) sputum neutrophils; (B) sputum macrophages; (C) sputum eosinophils; and (D) sputum lymphocytes.
Comparison of measurements in healthy subjects and stable COPD
Compared with healthy subjects, stable COPD patients showed trends for higher relative fluorescence intensity of anti-cytochrome C IgG (665.9 vs 902.0, P=0.008) and anti-aggrecan IgM (0.0 vs 148.5, P=0.006) in sputum; they also showed trends for higher neutrophil percentage (53.3% vs 77.4%, P=0.001) and eosinophil percentage (1.6% vs 3.6%, P=0.004) in sputum (). Anti-cytochrome C IgM (11,815.6 vs 8,710.0, P=0.036) and macrophages (51.2% vs 15.1%, P=0.001) were lower in sputum of patients with COPD than in sputum of healthy subjects ().
Correlations between measurements in stable COPD patients
Correlation analysis suggested a positive correlation for stable COPD patients between sputum anti-collagen II IgG and post-bronchodilator FEV1% (r=0.670, P=0.002), as well as between sputum anti-collagen II IgG and sputum lymphocytes (r=0.649, P=0.003); there were positive correlations between anti-aggrecan IgG and eosinophils in sputum (r=0.574, P=0.010), between anti-collagen IV IgM and lymphocytes in sputum (r=0.610, P=0.006), and between post-bronchodilator FEV1% and sputum macrophages (r=0.519, P=0.002); there was a negative correlation between anti-cytochrome C IgG and sputum eosinophils (r=-0.639, P=0.003).
Discussion
In this study, we treated selected fresh sputum with PBS, followed by low-temperature centrifugation to obtain supernatant; we then investigated soluble protein markers and IgG and IgM autoantibody profiles of these PBS supernatants by microarray analysis. We found that the measurements obtained twice within 6 days were highly reproducible in healthy subjects and stable COPD patients. Notably, this is the first assessment of the repeatability of fluid-phase measurements in PBS-treated sputum supernatant with high-throughput method. This study confirmed the presence of autoantibodies in the airways of healthy subjects and COPD patients, which can be detected by microarrays in the analyses of sputum supernatant.
The “two-step” sputum processing method allows investigators to obtain supernatant by PBS processing and cell lysis with DTT; notably, it avoids the destruction of soluble media by DTT. In this study, the reproducibility of fluid-phase measurements in PBS-supernatant and cell proportion from sputum treated with “two-step” processing method was good. These results suggested the validity of this method, which may be useful in clinical analyses.
ICC and Bland–Altman plots are commonly used statistical methods for consistency testing. The paired t-test can only indicate whether the average difference between the two measurements is equal to 0, according to the current data it cannot fully reflect the consistency between these measurements. In addition, the P-value is affected by the degree of freedom; thus, it is not appropriate to use the paired t-test instead of the consistency test. The result of ICC is susceptible to the presence of the outliers, while the Bland–Altman consistency analysis method is relatively more robust. For the above reasons, a paired-samples test approach, including ICC and Bland–Altman plots, was used to evaluate repeatability in this study. We evaluated the reproducibility of 10 soluble protein markers that often serve as biomarkers for chronic inflammatory airway disease. Most of these soluble protein markers show good consistency when measured twice within 6 days. Although 96.9% of data points were inside the LoA CI for IL1β and TNFα in Bland–Altman plots, there was a significant difference between the repeated measurements. The ICC was 0.292 for IL1β and 0.698 for TNFα, indicating low to medium reproducibility, which may be because of fluctuations that occur under physiological conditions.
We tested the detection reproducibility for IgG and IgM autoantibody profiles by microarray analysis and confirmed that these autoantibodies are detectable in PBS-treated supernatant with a good reproducibility; IgG was clearly detectable. ICC indicated that results regarding IgM autoantibodies generally tended to be less reproducible than those regarding IgG autoantibodies for aggrecan, cytochrome C, elastin, HSP47, and SS-B. This might be because IgM is often produced in early stages of humoral immunity, is maintained for a short time, and then cleared rapidly. A wide variety of natural autoantibodies (NAAs) of the IgM, IgG, and IgA classes are present in normal individuals.Citation18 NAAs play an important role in maintaining the immunological homeostasis by participating in immune regulation, repertoire selection, and resistance to infections. Natural IgM antibodies are required in early effective control of bacterial and viral infections and serve to prime the ensuing IgG response.Citation19 Notably, autoantibodies restrain the harmful consequences of inflammatory autoimmune conditions.Citation20 In this study, we confirmed the existence of NAAs in normal human airway, as well as in the airway of COPD patients. The role of autoimmune pathology in the development and progression of COPD is increasingly appreciated. Packard et al demonstrated that COPD patients produce autoantibodies in serum which is correlated with the disease phenotype.Citation5 A case series identified antibody deficiency as a potentially treatable risk factor for frequent COPD exacerbations.Citation21 Collagen V-mediated autoimmunity was increased in smoking controls and may potentially contribute to the pathogenesis of COPD.Citation22 Here, we have revealed the presence of IgG and IgM autoantibodies to multiple antigens, including collagen, in the airways of COPD patients. Stable COPD patients differed from healthy subjects in anti-cytochrome C IgG and anti-aggrecan IgM and anti-cytochrome C IgM. We also found a significant positive correlation for stable COPD patients between sputum anti-collagen II IgG and post-bronchodilator FEV1%, as well as between anti-aggrecan IgG and eosinophils; and a negative correlation between anti-cytochrome C IgG and sputum eosinophils. Further studies with larger samples are warranted to explore the role of these autoantibodies in the development of COPD.
Comparison of sputum measurements in healthy subjects and COPD patients showed significant differences in the proportion of neutrophils and eosinophils, the levels of anti-cytochrome C IgG and anti-aggrecan IgM and anti-cytochrome C IgM. The comparison and the correlation between markers in sputum and the clinical parameters suggested the validity of this method. Biomarker distributions are often complex because of heterogeneities due to various disease stages and endotypes. In particular, COPD is a highly heterogeneous disease. Therefore, we believe that overlapping distributions between healthy subjects and COPD patients are logical and acceptable.
There are some limitations in this study. First, for BAFF, IFN-γ, IL4, IL17, leptin, and TGFβ, >50% of the data were undetectable. The levels of these protein markers may indeed be low in the airway secretions of healthy and COPD individuals. However, this phenomenon may be related to the reduction in soluble protein marker concentrations after ninefold dilution in sputum processing. To clarify the cause, further studies with high-speed centrifugation of the original sputum, in order to obtain supernatant for detection of soluble protein markers, can be conducted. Second, the sample size was small, although it was comparable to that of a classic study with similar design.Citation6 In the future, we will expand the sample size and evaluate the reproducibility in COPD patients and healthy subjects.
Conclusion
The current study confirms the high repeatability of fluid-phase measurements in PBS supernatant, using the two-step sputum processing method. Autoantibodies of IgG and IgM of multiple antigens were found in the airways of COPD patients and are detected by using a high-throughput protein chip for analyses of sputum supernatant. These results demonstrated the potential use of the two-step sputum processing method as a noninvasive tool for the study of biomarkers, airway inflammation, and localized immunity in COPD patients.
Data sharing statement
The authors intend to share individual deidentified participant data, including demographics, detailed clinical information, and cell and fluid-phase measurements in sputum. The data will be accessible by emailing the authors after the manuscript is published. Subjects’ identity information will not be available for privacy reasons.
Author contributions
All authors contributed to data analysis, drafting or revising the article, gave final approval of the version to be published, and agree to be accountable for all aspects of the work.
Acknowledgments
We thank Ryan Chastain-Gross, PhD, from Liwen Bianji, Edanz Group China (www.liwenbianji.cn/ac), for editing the English text of a draft of this manuscript. This study was supported by National Key R&D Program of China (2017YFC1310600, 2017YFC1310601), the Guangzhou Healthcare Collaborative Innovation Major Project (201604020012), Medical Scientific Research Foundation of Guangdong Province (C2017050), and Postdoctoral start-up funding of Guangzhou (191710).
Supplementary materials
Figure S1 Scatter plots of soluble protein markers with pair-wise comparisons of the two measurements. Scatter plots of (A) IL1β; (B) IL5; (C) IL6; (D) IL8; (E) IL10; (F) IL13; (G) IL33; (H) sRAGE; (I) TNFα; and (J) VEGF.
Abbreviations: IL, interleukin; sRAGE, soluble receptor for advanced glycation end-products; TNFα, tumor necrosis factor-α; VEGF, vascular endothelial growth factor.
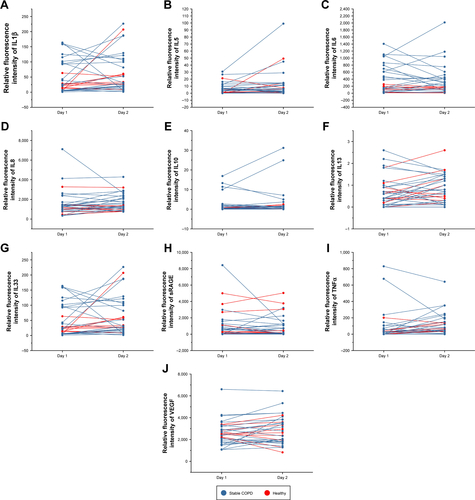
Figure S2 Scatter plots of IgG autoantibodies with pair-wise comparisons of the two measurements. Scatter plots of (A) anti-aggrecan IgG; (B) anti-amyloid IgG; (C) anti-CENP-B IgG; (D) anti-collagen I IgG; (E) anti-collagen II IgG; (F) anti-collagen IV IgG; (G) anti-cytochrome C IgG; (H) anti-cytokeratin 18 IgG; (I) anti-elastin IgG; (J) anti-HSP47 IgG; (K) anti-HSP70 IgG; (L) anti-SS-B IgG; and (M) anti-vimentin IgG.
Abbreviations: CENP-B, centromere protein B; HSP47, heat shock protein 47; HSP70, heat shock protein 70; SS-B, La/Sjögren syndrome type B antigen.
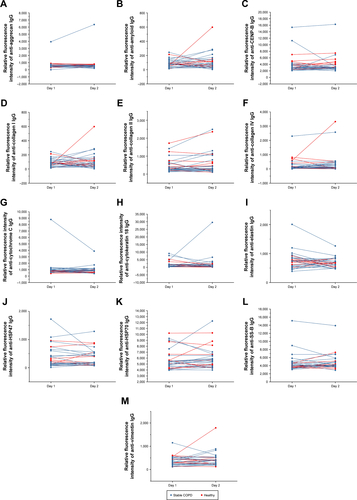
Figure S3 Scatter plots of IgM autoantibodies with pair-wise comparisons of the two measurements. Scatter plots of (A) anti-aggrecan IgM; (B) anti-amyloid IgM; (C) anti-CENP-B IgM; (D) anti-collagen I IgM; (E) anti-collagen II IgM; (F) anti-collagen IV IgM; (G) anti-cytochrome C IgM; (H) anti-cytokeratin 18 IgM; (I) anti-elastin IgM; (J) anti-HSP47 IgM; (K) anti-HSP70 IgM; (L) anti-SS-B IgM; (M) anti-vimentin IgM.
Abbreviations: CENP-B, centromere protein B; HSP47, heat shock protein 47; HSP70, heat shock protein 70; SS-B, La/Sjögren syndrome type B antigen.
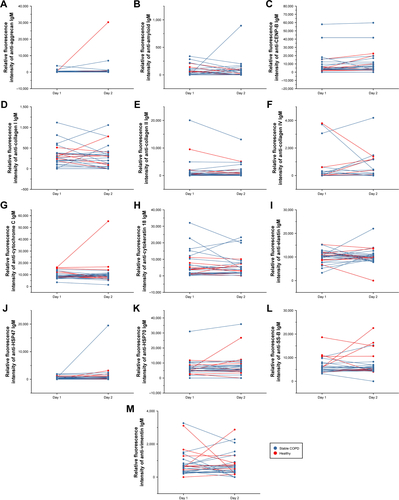
Figure S4 Scatter plots of sputum cell counts with pair-wise comparisons of the two measurements. Scatter plots of (A) sputum neutrophils; (B) sputum macrophages; (C) sputum eosinophils; and (D) scatter plots of sputum lymphocytes.
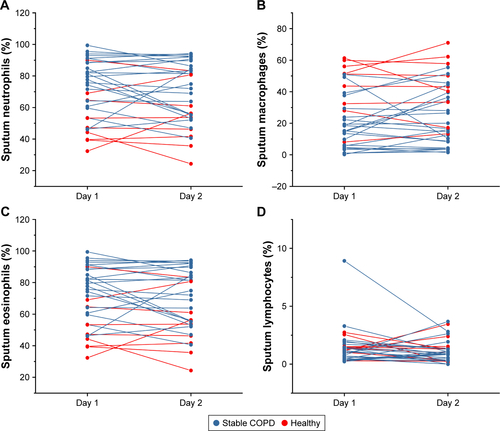
Table S1 All measurement results
Table S2 Comparison of measurements between groups
Disclosure
The authors report no conflicts of interest in this work.
References
- KellyMMKeatingsVLeighRAnalysis of fluid-phase mediatorsEur Respir J Suppl20023724s39s12361360
- HacievliyagilSSMutluLCTemelIAirway inflammatory markers in chronic obstructive pulmonary disease patients and healthy smokersNiger J Clin Pract2013161768110.4103/1119-3077.10677123377476
- RovinaNPapapetropoulosAKollintzaAVascular endothelial growth factor: an angiogenic factor reflecting airway inflammation in healthy smokers and in patients with bronchitis type of chronic obstructive pulmonary disease?Respir Res200785310.1186/1465-9921-8-9117631682
- AgustiMDonaldsonCHypothesis: does COPD have an autoimmune component?Thorax2003581083210.1136/thorax.58.10.83214514931
- PackardTALiQZCosgroveGPBowlerRPCambierJCCOPD is associated with production of autoantibodies to a broad spectrum of self-antigens, correlative with disease phenotypeImmunol Res2013551–3485710.1007/s12026-012-8347-x22941590
- PizzichiniEPizzichiniMMEfthimiadisAIndices of airway inflammation in induced sputum: reproducibility and validity of cell and fluid-phase measurementsAm J Respir Crit Care Med19961542 Pt 130831710.1164/ajrccm.154.2.87567998756799
- EfthimiadisASpanevelloAHamidQMethods of sputum processing for cell counts, immunocytochemistry and in situ hybridisationEur Respir J Suppl20023719s23s12361358
- GrebskiEPetersonCMediciTCEffect of physical and chemical methods of homogenization on inflammatory mediators in sputum of asthma patientsChest200111951521152511348963
- BafadhelMMcCormickMSahaSProfiling of sputum inflammatory mediators in asthma and chronic obstructive pulmonary diseaseRespiration2012831364410.1159/00033066721912093
- HinksTSCBrownTLauLCKMultidimensional endotyping in patients with severe asthma reveals inflammatory heterogeneity in matrix metalloproteinases and chitinase 3–like protein 1J Allergy Clin Immunol20161381617510.1016/j.jaci.2015.11.02026851968
- GhebreMADesaiDSingapuriASputum inflammatory mediators are increased in aspergillus fumigatus culture-positive asthmaticsAllergy Asthma Immun20179217710.4168/aair.2017.9.2.177
- KolsumUDonaldsonGCSinghRBlood and sputum eosinophils in COPD; relationship with bacterial loadRespir Res20171818810.1186/s12931-017-0570-528482840
- PizzichiniEPizzichiniMMEfthimiadisAMeasurement of inflammatory indices in induced sputum: effects of selection of sputum to minimize salivary contaminationEur Respir J199696117411808804934
- BartkoJJThe intraclass correlation coefficient as a measure of reliabilityPsychol Rep196619131110.2466/pr0.1966.19.1.35942109
- BlandJMAltmanDGStatistical methods for assessing agreement between two methods of clinical measurementLancet1986184763073102868172
- BlandJMAltmanDGMeasuring agreement in method comparison studiesStat Methods Med Res19998213516010.1177/09622802990080020410501650
- LandisJRKochGGThe measurement of observer agreement for categorical dataBiometrics1977331159174843571
- Lacroix-DesmazesLKaveriSVMouthonLSelf-reactive antibodies (natural autoantibodies) in healthy individualsJ Immunol Methods19982161–21171379760219
- GronwallCSilvermanGJNatural IgM: beneficial autoantibodies for the control of inflammatory and autoimmune diseaseJ Clin Immunol201434Suppl 1S12S2110.1007/s10875-014-0025-424691998
- ZoharYWildbaumGKarinNBeneficial autoimmunity participates in the regulation of rheumatoid arthritisFront Biosci20061136837916146738
- McCullaghBNComellasAPBallasZKAntibody deficiency in patients with frequent exacerbations of Chronic Obstructive Pulmonary Disease (COPD)PLoS One2017122e17243710.1371/journal.pone.0172437
- RinaldiMLehouckAHeulensNAntielastin B-cell and T-cell immunity in patients with chronic obstructive pulmonary diseaseThorax201267869470010.1136/thoraxjnl-2011-20069022442201