This article refers to:
Li H, Zeng Z, Cheng J, et al. Int J Chron Obstructive Pulm Dis. 2020;15:57–67.
On page 63, is incorrect, the authors missed to check the correct revised figures were inserted into the manuscript during the revision process.
The correct figures are as below:
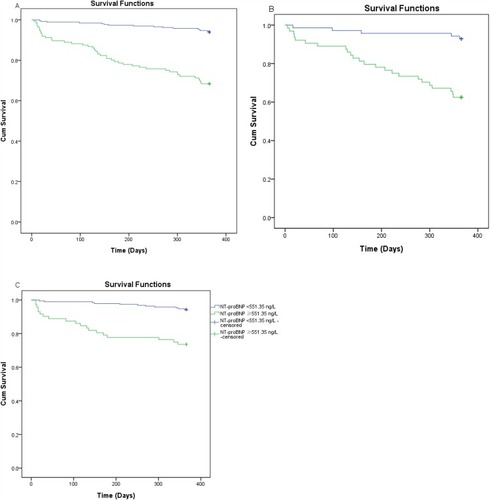
Figure 3 Kaplan–Meier survival curves evaluating the time to death in days for patients with NT-proBNP concentrations ≥551.35 ng/L and NT-proBNP concentrations <551.35 ng/L. Panel A: survival curve for all patients; Panel B: survival curve for patients with CHF; Panel C: survival curve for patients without CHF.
Abbreviation: CHF, congestive heart failure.