Abstract
Background
The aims of the study were: (1) to compare numerical parameters of specific airway resistance (total, sRawtot, effective, sRaweff and at 0.5 L · s−1, sRaw0.5) and indices obtained from the forced oscillation technique (FOT: resistance extrapolated at 0 Hz [Rrs0 Hz], mean resistance [Rrsmean], and resistance/frequency slope [Rrsslope]) and (2) to assess their relationships with dyspnea in chronic obstructive pulmonary disease (COPD).
Methods
A specific statistical approach, principal component analysis that also allows graphic representation of all correlations between functional parameters was used. A total of 108 patients (mean ± SD age: 65 ± 9 years, 31 women; GOLD stages: I, 14; II, 47; III, 39 and IV, 8) underwent spirometry, body plethysmography, FOT, and Medical Research Council (MRC) scale assessments.
Results
Principal component analysis determined that the functional parameters were described by three independent dimensions (airway caliber, lung volumes and their combination, specific resistance) and that resistance parameters of the two techniques were not equivalent, obviously. Correlative analyses further showed that Rawtot and Raweff (and their specific resistances) can be considered as equivalent and correlated with indices that are considered to explore peripheral airways (residual volume (RV), RV/ total lung capacity (TLC), Rrsslope), while Rrsmean and Raw0.5 explored more central airways. Only specific resistances taking into account the specific resistance loop area (sRawtot and sRaweff) and Rrsslope were statistically linked to dyspnea.
Conclusion
Parameters obtained from both body plethysmography and FOT can explore peripheral airways, and some of these parameters (sRawtot, sRaweff, and Rrsslope) are linked to activity-related dyspnea in moderate to severe COPD patients.
Introduction
DuBois and colleagues developed different ways of assessing airway obstruction in the late 1950s, namely airway resistance obtained from body plethysmography and respiratory system resistance from FOT.Citation1,Citation2 The former method seems neglected and is absent from the most recent international recommendations on pulmonary function testing, while the latter has regained interest and was the subject of recommendations by the European Respiratory Society (ERS) in 2003.Citation3
The American Thoracic Society (ATS)/ERS Task Force stated that “airflow resistance is rarely used to identify airflow obstruction in clinical practice. It is more sensitive for detecting narrowing of extrathoracic or large central intrathoracic airways than of more peripheral intrathoracic airways,”Citation4 which may justify its disuse. Nevertheless, there are several lines of evidence indicating that airway resistance obtained from body plethysmography is less proximal than often stated. For instance, we have established that in asthmatic children, sRaw0.5 and Raw0.5 (airway resistance at a flow of 0 ± 0.5 L/s) more closely correlated with forced expiratory flow (FEF)50% than with forced expiratory volume (FEV)1, both conceptually and empirically.Citation5 We have also shown that in COPD patients, the best correlate of Raw (inspiratory Rawtot) was the lumen area of the sixth bronchial generation on the CT scan, which is not quite proximal. Citation6 Based on these assumptions, the clinical usefulness of airway resistance measurement in COPD patients deserves to be investigated together with the determination of which numerical parameters should be chosen.
Indeed, the different numerical parameters that can be calculated from the specific resistance loop further complicate matters. The content of the sRaw loop is often quite complex and is not a simple narrow linear oval loop, especially in COPD patients. Consequently, different investigators have utilized different portions of the loop to approximate a representative value for the entire cycle. The total specific resistance (sRawtot), effective specific resistance (sRaweff), and the specific resistance at 0.5 L . s−1 (sRaw0.5) have been well established, which further allows the calculation of Rawtot, Raweff, and Raw0.5, respectively.Citation1,Citation7–Citation10 As stated by Dab and Alexander in their initial description of specific resistance measurement, sRaw “is a volume-corrected resistance which better describes an individual’s pulmonary function than the use of either Raw or Thoracic Gas Volume alone.”Citation11 Nevertheless, the comparison of sRaw and Raw numerical parameters in COPD patients is still lacking, to the best of our knowledge.
The resistive component of respiratory impedance, Rrs, includes proximal and distal airways, lung tissue, and chest wall resistance.Citation3 In healthy subjects, Rrs is almost independent of oscillation frequency and mainly assesses airway resistance. In distal airway obstruction, Rrs is highest at low oscillation frequencies and falls with increasing frequency. As a consequence, it has been stated that FOT includes functional assessment of peripheral airways, which may explain the regain of interest in it.Citation3 Overall, the analysis of the relationships between all functional parameters obtained from spirometry, body plethysmography, and FOT in COPD patients would help to better define their functional redundancy and their respective contribution to activity-related dyspnea. Therefore, our first objective was to compare the different parameters characterizing resistance obtained from both whole-body plethysmography and FOT in COPD patients, while the second objective was to assess their clinical usefulness using correlative analyses with activity-related dyspnea. Since multiple parameters are obtained from pulmonary function tests, the first objective was achieved using a specific statistical approach, principal component analysis that also allows graphic representation of all correlations, allowing visualization of their similarities and differences.
Patients and methods
This was a cross-sectional study in which informed consent was obtained and ethical approval was received from an Institutional Review Board Committee (CPP IDF IV, n° 1391593 v0). These results constitute an ancillary study of a project designed for dyspnea assessment in patients with altered ventilatory capacity (DYSPNEE1 study, manuscript submitted). Only data from COPD patients (smoking history >15 pack-years and post-bronchodilator FEV1/ forced vital capacity (FVC) < 70%)Citation12 who underwent respiratory system impedance (Oscilink; Datalink-MSR, Rungis, France), spirometry, and body plethysmography measurements (MasterScreenBody, Jaeger, CareFusion, San Diego, CA) according to ATS/ERS recommendations,Citation3,Citation13–Citation15 while receiving their regular COPD treatment, were included in the present analyses. Patients were not included if they had (1) other unstable medical conditions that could cause or contribute to breathlessness (ie, metabolic, cardiovascular, or other respiratory diseases), (2) pulmonary hypertension (systolic pulmonary artery pressure >35 mmHg at rest on echocardiography), or (3) a severe psychiatric condition.
Dyspnea during daily activities was assessed using the Medical Research Council (MRC) Scale.Citation16
The different indices characterizing sRaw were:Citation9,Citation10 sRawtot (parameter line connecting the flow points at maximum change in plethysmographic volume (pressure)), sRaw0.5 (parameter line connecting the points where the flow reaches a fixed value of 0.5 L/s), and sRaweff (calculated from multiple points throughout the breathing cycle: the integration method).Citation3 From the FOT technique, the following indices were obtained: the average resistance between 4 and 30 Hz (Rrsmean, kPa · s−1 · L−1), the intercept (Rrs0 Hz, resistance extrapolated to 0 Hz: obtained by linear regression analysis over the 4 to 16 Hz frequency range), the resistance/ frequency slope (Rrsslope, between 4 and 16 Hz: null to negative values), and the compliance of the respiratory system (Cp, mL · hPa−1 using model fitting on the reactance data). All these parameters have previously been described extensively and were standardized as percentages of predicted normal values.Citation3,Citation4,Citation17–Citation19
Statistical analyses
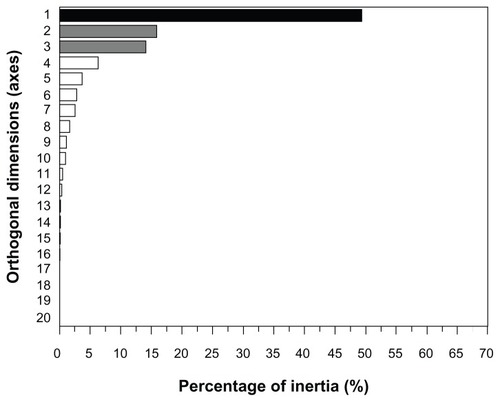
Since multiple parameters were obtained from pulmonary function tests, we first reduced the number of parameters to fewer relevant dimensions based on a statistical approach, namely principal component analysis (PCA). To obtain reliable results, we determined that the minimum number of subjects providing usable data for the analysis should be five times the number of variables being analyzed (n = 20).Citation20 This transformation is defined in such a way that the first principal component has a variance as high as possible and each succeeding component in turn has the highest variance possible under the constraint that it is orthogonal to (uncorrelated with) the preceding components. PCA is the simplest of the true eigenvector-based multivariate analyses. Its operation is often thought of as revealing the internal structure of the data in a way that best explains the variance in the data (see the legend of for additional explanation). We used the “cumulative percentage of variance accounted for” as the criterion for solving the problem with the number of components and retained enough components so that the cumulative percentage of variance accounted for at least ~70% (this was further confirmed via a Cattell scree plot: ). Correlative analyses between the MRC score and pulmonary function parameters used the Pearson coefficient. A P value <0.05 was considered significant. The statistical software SAS (release 9.2; SAS Institute Inc, Cary, NC, USA) was used for all analyses.
Figure 1 Percentage of inertia explained by the orthogonal axes obtained by principal component analysis.
Results
Patients
A total of 108 patients were enrolled into the study. The clinical and functional characteristics of the patients are described in . The initial sample size of the COPD group was 128, but four had lung volume measurement using helium dilution and FOT measures were lacking for 16 additional patients.
Table 1 Clinical and functional characteristics of the COPD patients
Relationships between functional indices
Principal component analysis
The PCA allowed the description of all functional parameters according to the three axes responsible for 79.3% of total inertia. displays the functional indices in three different planes that help explain their respective relationships. The upper and middle panels show that axis 1 (responsible for the main part of inertia ~variance) is well described by specific resistances (mixed parameter: airway obstruction and volume, analogous to viscosity according to its unit). Axis 2 is probably related to lung volumes; among static volumes, TLC is closer to the axis than functional residual capacity (FRC) and RV due to increasing contribution of obstruction to these latter volumes. This axis may be related to compliance/ elastance of the respiratory system. Finally, axis 3 is mainly related to airway caliber: increased resistance for positive values and hyperinflation for negative values, which is related to the resistance/conductance of the respiratory system. FEV1%pred/RV%pred was also computed because this new index may theoretically describe both airflow limitation and hyperinflation.
Figure 2 Correlation circles in two-dimensional maps.
Abbreviations: Rrs, resistance of the respiratory system (mean over 4–30 Hz; 0 Hz, resistance extrapolated to 0 Hz; slope, resistance/frequency slope); Ca, capacitance of the respiratory system obtained by FOT (~compliance); Raw, airway resistance (tot [total], eff [effective], 0.5 [at 0.5 L/s]) and their specific resistances (sRaw); TLC, total lung capacity; FRC, functional residual capacity; RV, residual volume; FEV1, forced expiratory flow at 1 s; FEF25%–75%, forced expiratory flow between 25% and 75% of vital capacity; FEF50%, forced expiratory flow at 50% vital capacity; FVC, forced vital capacity; IC, inspiratory capacity.
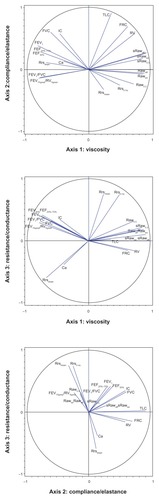
emphasizes the pathophysiological indication of the indices obtained from FOT in COPD; compliance is weakly described by the three axes that have been chosen. The Rrsslope (negative values) is in the opposite direction to Raw and is better described by the first axis, while Rrsmean and Rrs0 Hz are parameters of airway obstruction that are influenced by a decrease in lung volume (possibly due to airway closure).
Correlations between the functional parameters
Airway resistance
In our patients, Raweff and Rawtot (and their specific resistances) can be regarded as equivalent (Pearson correlation coefficient, r = 0.96, P < 0.0001, and r = 0.98, P < 0.0001, respectively). Among the other functional indices (except resistances), the best correlates to Rawtot were FEV1 and RV/TLC (r = −0.63 and r = −0.62, respectively; both P values < 0.0001), while the best correlates to sRawtot were RV and FEV1/FVC (r = 0.75 and r = −0.66, respectively; both P values < 0.0001).
Respiratory system resistance
All the functional indices (except other indices obtained from FOT measurement) weakly correlated with Rrsmean and Rrs0 Hz (r values < 0.50). The best correlates of the slope of the respiratory system resistance were Rawtot, Raweff, sRawtot, and sRaweff (all r values ~ −0.60, all P values <0.0001).
Relationships with activity-related dyspnea (MRC score)
All parameters that statistically correlated with the MRC score had a similar degree of explained variance (for instance, FEV1: r = −0.23 [−0.40; −0.04], P = 0.025). Among the resistance measurements, the only indices that significantly correlated with the MRC score were sRawtot and sRaweff (r = 0.24 [0.05; 0.41], P = 0.012 and r = 0.23 [0.04; 0.40], P = 0.017, respectively). The only parameter obtained from the FOT measurement that significantly correlated with the MRC score was Rrsslope (r = −0.25 [−0.42; −0.06], P = 0.010).
Discussion
The main result of this study is that all parameters characterizing resistance obtained from both whole-body plethysmography and FOT in COPD patients were not equivalent. The PCA analysis allows the visualization of their relationships. Our results demonstrated that Rawtot and Raweff (and their specific resistances) can be considered as equivalent and correlated with indices that are considered to explore peripheral airways (RV, RV/TLC, Rrsslope), while Rrsmean (and possibly Raw0.5) explored more central airways. We further showed that only specific resistances (sRawtot and sRaweff) and Rrsslope were statistically linked to activity-related dyspnea in COPD patients.
Methodological issues
First, the choice of the statistical analysis needs justification. When dealing with multiple parameters that are in essence correlated, it is difficult to obtain an overall view of their similarities and differences. PCA allows this overall view, since it creates from all the parameters the independent dimensions that need further “physiological interpretation”: the three axes in our study, which may represent specific resistance, volume, and airway caliber. Each parameter is then characterized by a vector and its location in each plane may characterize its functional meaning. Correlative analyses between parameters are provided to further illustrate the strength of the relationships, and two parameters can be considered as equivalent when the Pearson correlation coefficient is >0.85.
As stated by the ERS task force, since the first FOT measurements,Citation2 numerous variants of the FOT have been developed in terms of measurement configuration, oscillation frequencies and evaluation principles.Citation3 It has to be stated that some of the calculated parameters as Rrs0 Hz, Rrsslope and Cp are still under debate.Citation3 Nevertheless, in adult patients with intrapulmonary airway obstruction, Rrs increases at the lower frequencies (characterized by Rrs0 Hz, resistance extrapolated to 0 Hz) and decreases when frequency increases (characterized by the resistance/frequency slope, Rrsslope).
Relationships between resistance parameters
The choice of the most clinically useful measure of airway resistance varies in different countries. Most North American clinicians use Raw0.5 (the parameter initially described by DuBois and colleagues),Citation1 which primarily reflects the resistance in the larger central airway. Nevertheless, based on theoretical grounds, physical meaning can be attributed only to Raweff, which corresponds to a linear resistor accounting for the dissipation of the nonlinear and time variant airway system,Citation7 whereas the empirical measure Raw0.5 approximates the lowest resistance. The sRaw loop is not a simple narrow linear oval loop, especially in COPD patients. The area of the loop (taken into account in Raweff measurement)Citation7 is related to the flow-resistive work of breathing, which may explain its correlation with activity-related dyspnea.
Our study demonstrates that among the numerical parameters obtained from sRaw measurements, either the sRawtot or sRaweff can be used interchangeably. These two parameters are the only ones that significantly correlate with activity-related dyspnea. To the best of our knowledge, this study is the first demonstration that specific resistance is one of the better descriptors of lung function due to its dual nature, including resistance and volume components that may be related to the viscoelastic behavior of the lung (kPa.s is a dynamic viscosity unit). In COPD patients with nonhomogeneous small airway partial obstruction, the sRaw loop area increases, especially during expiratory flow. Such alinearity represents expiratory flow limitation and/or dynamic airway compression, the former being clearly linked to activity-related dyspnea in COPD patients,Citation21 which may explain our results.
We further observed that Rrs0 Hz and Rrsmean were not closely associated with Raw indices, except Raw0.5, which suggests that these measures assess more central airways. The Rrsslope, which has been suggested to assess more peripheral airways,Citation17 was quite closely linked to Rawtot, suggesting that airway resistance in COPD is not as proximal as often statedCitation4 and that is in agreement with ex vivo measurements.Citation22 It has been reported that FOT may provide useful clinical information in COPD patientsCitation23 beyond that available from commonly used pulmonary function tests.Citation17 Surprisingly, few investigators have assessed the degree of correlation between Rrs and Raw (with the exception of the assessment of bronchodilator response). The first assessment of patients with obstructive lung diseases using both techniques was made by Fisher, DuBois and Hyde.Citation2 They showed that airway resistance represents approximately 60% of respiratory resistance, which also incorporates tissue resistance,Citation2 possibly explaining the absence of a close relationship between Raw0.5 and Rrs.
Limitations
From our results, we cannot determine formally which index better assesses peripheral airways in the absence of a gold standard. Furthermore, since the majority of patients had overt airflow limitation, our study was not designed to evaluate the sensitivity of the indices for early disease. It should be noted that we described the reactive component of respiratory impedance only by the compliance describing the ability of the respiratory tract to store capacitive energy, primarily present in the lung periphery. One may hypothesize that within-breath tracking of respiratory impedance may give additional information.Citation24
Assessment of activity-related dyspnea
Finally, our study showed that specific resistance and spirometry indices similarly but weakly explained activity- related dyspnea, as assessed by the MRC score. The MRC score is a crude assessment of activity-related dyspnea, but it is the most widely used dyspnea score.Citation25 Since dyspnea of COPD patients results from both altered ventilatory capacity (assessed by resistance or spirometry) and ventilatory demand (increased wasted ventilation for instance),Citation26–Citation28 the weak relationship between dyspnea and the indices of airway obstruction was not unexpected.
In conclusion, parameters obtained from both body plethysmography and forced oscillation technique can explore peripheral airways, and some of these parameters (sRawtot, sRaweff and Rrsslope) are linked to activity-related dyspnea in moderate to severe COPD patients.
Authors’ contributions
The listed authors made substantial contributions to conception and design (ACP, BM, PB, CD), acquisition of data (LP, KGJ, EC, BCB, OS), or analysis (ACP) and interpretation of data (all authors). The listed authors made substantial contributions to drafting the article (BM, ACP, PB, CD), revising it critically for important intellectual content (LP, KGJ, EC, BCB, OS), and final approval of the version to be published (all authors).
Acknowledgments
The authors wish to thank Prof Hervé Guénard for his proposal of the FEV1%pred/RV%pred as a new index. The authors wish to thank the technicians of the pulmonary function laboratory for their expert assistance (Martine Riquelme, Françoise LeBihan, Mireille Morot, Marien Bokouabassa), the different contributors from the Clinical Research Unit (URC: Ludovic Trinquart and Severine Peyrard for statistical advice, Jean-François Leforestier and Romain Chenu for data management, Yann Guivarch for expert financial management, Noël Lucas and Gilles Chatellier for supervision), the Department of Medical Informatics (DIM: Abden Naji El Fadly for merging the databases, Christel Daniel for supervision [RE-USE project]), and the Direction de la Recherche Clinique et du Développement (DRCD of AP-HP: Christophe Aucan) for sponsorship.
Funding
This study was funded by a grant from AP-HP (Assistance Publique – Hôpitaux de Paris, Direction de la Recherche Clinique et du Développement). The Unité de Recherche Clinique was responsible for independent data monitoring and analysis (Mrs Caumont-Prim) under the supervision of our sponsor (project code: SRC06002-DYSPNEE1).
Disclosures
BM declares no competing interests. ACP declares no competing interests. LP declares no competing interests. KGJ declares no competing interests. EC declares no competing interests. OS declares no competing interests. BCB declares no competing interests. PB declares no competing interests. CD declares no competing interests.
References
- DuBoisABBotelhoSYComroeJHJrA new method for measuring airway resistance in man using a body plethysmograph: values in normal subjects and in patients with respiratory diseaseJ Clin Invest195635332733513295397
- FisherABDuBoisABHydeRWEvaluation of the forced oscillation technique for the determination of resistance to breathingJ Clin Invest1968479204520575675425
- OostveenEMacLeodDLorinoHThe forced oscillation technique in clinical practice: methodology, recommendations and future developmentsEur Respir J20032261026104114680096
- PellegrinoRViegiGBrusascoVInterpretative strategies for lung function testsEur Respir J200526594896816264058
- MahutBTrinquartLBokovPRelationships between specific airway resistance and forced expiratory flows in asthmatic childrenPLoS One200944e527019381269
- BokovPMauroyBRevelMPLumen areas and homothety factor influence airway resistance in COPDRespir Physiol Neurobiol2010173111020478416
- JaegerMJOtisABMeasurement of airway resistance with a volume displacement body plethysmographJ Appl Physiol196419481382014195600
- MatthysHOrthUComparative measurements of airway resistanceRespiration19753221211341118676
- BisgaardHNielsenKGPlethysmographic measurements of specific airway resistance in young childrenChest2005128135536216002957
- KirkbyJStanojevicSWelshLReference equations for specific airway resistance in children: the asthma UK initiativeEur Respir J201036362262920150205
- DabIAlexanderFA simplified approach to the measurement of specific airway resistancePediatr Res19761012998999995503
- RabeKFHurdSAnzuetoAGlobal strategy for the diagnosis, management, and prevention of chronic obstructive pulmonary disease: GOLD executive summaryAm J Respir Crit Care Med2007176653255517507545
- MillerMRCrapoRHankinsonJGeneral considerations for lung function testingEur Respir J200526115316115994402
- MillerMRHankinsonJBrusascoVStandardisation of spirometryEur Respir J200526231933816055882
- WangerJClausenJLCoatesAStandardisation of the measurement of lung volumesEur Respir J200526351152216135736
- BestallJCPaulEAGarrodRGarnhamRJonesPWWedzichaJAUsefulness of the Medical Research Council (MRC) dyspnoea scale as a measure of disability in patients with chronic obstructive pulmonary diseaseThorax199954758158610377201
- BrochardLPelleGde PalmasJDensity and frequency dependence of resistance in early airway obstructionAm Rev Respir Dis198713535795843826883
- ChinetTPelleGMacquin-MavierILorinoHHarfAComparison of the dose-response curves obtained by forced oscillation and plethysmography during carbachol inhalationEur Respir J1988176006053181406
- ZerahFLorinoAMLorinoHHarfAMacquin-MavierIForced oscillation technique vs spirometry to assess bronchodilatation in patients with asthma and COPDChest1995108141477606989
- MahutBPeyrardSDelclauxCExhaled nitric oxide and clinical phenotypes of childhood asthmaRespir Res2011126521599913
- EltayaraLBecklakeMRVoltaCAMilic-EmiliJRelationship between chronic dyspnea and expiratory flow limitation in patients with chronic obstructive pulmonary diseaseAm J Respir Crit Care Med19961546172617348970362
- HoggJCMacklemPTThurlbeckWMSite and nature of airway obstruction in chronic obstructive lung diseaseN Engl J Med196827825135513605650164
- HarunaAOgaTMuroSRelationship between peripheral airway function and patient-reported outcomes in COPD: a cross-sectional studyBMC Pulm Med2010101020205936
- DellacaRLDuffyNPompilioPPExpiratory flow limitation detected by forced oscillation and negative expiratory pressureEur Respir J200729236337417079262
- CelliBRCoteCGMarinJMThe body-mass index, airflow obstruction, dyspnea, and exercise capacity index in chronic obstructive pulmonary diseaseN Engl J Med2004350101005101214999112
- GiuntiniCCamiciottoliGMaluccioNMMarianiLLavoriniFPistolesiMChronic effort dyspnea explained by lung function tests and by HRCT and CRX radiographic patterns in COPD: a post-hoc analysis in 51 patientsCOPD20074316917617729059
- O’DonnellDEWebbKABreathlessness in patients with severe chronic airflow limitation. Physiologic correlationsChest199210238248311516410
- SahebjamiHSathianpitayakulEInfluence of body weight on the severity of dyspnea in chronic obstructive pulmonary diseaseAm J Respir Crit Care Med20001613 Pt 188689010712338