Abstract
Background and objective
Chronic obstructive pulmonary disease (COPD) is characterized by persistent airflow limitation consisting of airway obstruction and parenchymal emphysema, with loss of elastic recoil. The forced oscillation technique can detect impairment of lung function by measuring lung impedance during normal tidal breathing. Respiratory resistance (Rrs) in COPD has been well-studied, but the differences in Rrs in the inspiratory and expiratory phases between mild and moderate COPD remain poorly understood. Since airway obstruction in COPD is known to change dynamically during tidal breathing and might affect Rrs, the differences in Rrs during tidal breathing between mild and moderate COPD were evaluated.
Methods
Mild (n = 13) and moderate (n = 13) COPD patients were recruited at Tokyo University Hospital (Tokyo, Japan). Rrs was measured using MostGraph-01 (Chest MI, Inc, Tokyo, Japan), which depicted Rrs in a frequency-and respiratory cycle-dependent manner in three-dimensional graphics. Rrs was evaluated at 4–35 Hz during tidal breathing.
Results
Rrs changed dynamically during tidal breathing in COPD. The mean Rrs values were significantly greater in the moderate COPD group than in the mild group. The maximal and minimal Rrs values at higher frequencies in the respiratory cycle were significantly greater in moderate COPD. In inspiratory–expiratory breath analysis, the maximal and minimal Rrs values at 20 Hz and 35 Hz were significantly greater in the moderate group, whereas at 4 Hz they did not differ significantly between the groups.
Conclusion
Rrs changed dynamically during tidal breathing in patients with COPD. The Rrs values at higher frequencies were greater in moderate COPD than in mild COPD. Rrs at higher frequencies might reflect the degree of airway obstruction in tidal breathing in patients with COPD and might be a useful marker for evaluation of airway obstruction at an early stage of COPD.
Introduction
Chronic obstructive pulmonary disease (COPD) is characterized by persistent airflow limitation that is not fully reversible and is defined as a decrease in the forced expiratory volume in 1 second (FEV1) as measured by spirometry.Citation1 Measurement of FEV1 by spirometry is necessary and required for estimating the airflow limitation and diagnosing COPD. Airflow limitation is caused by a mixture of small airway disease and parenchymal destruction, and is enhanced during forced expiration due to passive collapse of the peripheral airways induced by positive pressure in the thoracic cavity. Therefore, airflow limitation in forced expiration suggests the presence of airway obstruction and lung parenchymal emphysematous destruction, with loss of elastic recoil, in COPD. However, the forced expiration in spirometry is a burden on patients with COPD, and it would be better to detect and estimate airway obstruction in patients with COPD without performing forced expiration or special breathing maneuvers.
Measurement of respiratory resistance (Rrs) during tidal breathing achieves better physiological assessment of airflow obstruction than spirometry does.Citation2 The forced oscillation technique (FOT) can determine respiratory system impedance, which consists of a real part as Rrs and an imaginary part as reactance (Xrs), and is measured over a wide range of frequencies during tidal breathing.Citation2,Citation3 Previous studies demonstrated that Rrs and Xrs were able to distinguish airway obstructive diseases from normal, with Rrs at lower frequencies in airway obstruction being greater than normal.Citation4,Citation5 Also, since the mean whole-breath Rrs and Xrs values were reported to reflect the severity of airway obstruction in COPD, more severe COPD showed greater Rrs.Citation6,Citation7 In particular, recent studies showed that an increase in Rrs in the expiratory phase of tidal breathing was characteristic of patients with airway obstruction, such as COPD,Citation6–Citation9 indicating that airway obstruction was increased in the expiratory phase even in tidal breathing, although not in forced expiration. Moreover, the airway obstruction in COPD was reported to be due to dynamic motion consisting of airway narrowing in the expiratory phase and airway dilation in the inspiratory phase of tidal breathing.Citation10 Accordingly, Rrs in the inspiratory phase of tidal breathing might be expected to reflect the changes in airway dilation in that phase and change dynamically during tidal breathing in patients with COPD. The changes in Rrs during inspiration might be different from the changes in Rrs during expiration in COPD, and this difference might be related to the severity of COPD. However, there have been no reports regarding differences in the dynamic change in Rrs between mild and moderate COPD.
Taken together, FOT measurement of Rrs would be a useful method for detecting patients with COPD without placing any burden on the patients. However, the role of clinical application of FOT in COPD remains to be established. Therefore, the characteristic features of Rrs during the respiratory cycle in tidal breathing in mild and moderate COPD were evaluated. First, it was studied whether the behavior of Rrs showed dynamic changes as the airway obstruction changed dynamically during the respiratory cycle in tidal breathing in COPD. Next, it was evaluated whether the mean, maximal, and minimal Rrs during the respiratory cycle were different in mild and moderate COPD since airway obstruction is more severe in moderate COPD than in mild COPD. Finally, the differences in the changes in Rrs during the inspiratory and expiratory phases between mild and moderate COPD were evaluated. These findings might be helpful for distinguishing mild and moderate COPD by tidal breathing without using any forced expiratory maneuvers.
Materials and methods
Subjects
A total of 26 patients with stable COPD, as defined by the Global Initiative for Obstructive Lung Disease,Citation1 were recruited at Tokyo University Hospital (Tokyo, Japan). All patients had smoking-related COPD without alpha-1 anti-trypsin deficiency and had a smoking history of more than 20 pack years. COPD was diagnosed based on a clinical history of exertional dyspnea and pulmonary function characterized by airflow obstruction that was not fully reversible. Patients were classified into mild (stage I) (n = 13) and moderate (stage II) (n = 13) COPD groups according to the Global Initiative for Obstructive Lung Disease guidelines (). This study was approved by the Ethics Committee of Tokyo University, and all subjects gave prior written informed consent.
Table 1 Clinical characteristics of the patients with chronic obstructive pulmonary disease
FOT
Measurements of respiratory impedance
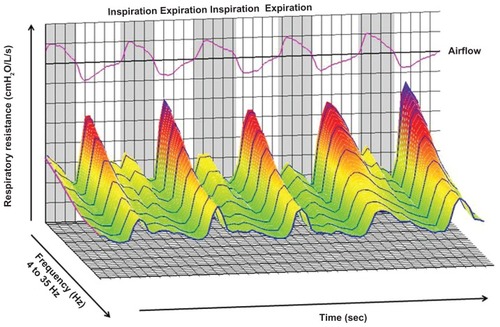
Impedance of the respiratory system was measured using a commercially available FOT device, MostGraph-01 (Chest MI, Inc, Tokyo, Japan). Continuous impulses consisting of multispectrum oscillation were applied to the airway four times per second, every 0.25 seconds. Impulse pressure was applied in two directions in accordance with the airflow direction in tidal breathing: positive in inspiration and negative in expiration. The respiratory system impedance, including Rrs and Xrs, was automatically calculated using MostGraph-01 software (version 1.31; Chest). Rrs between 4 Hz and 35 Hz was depicted with three-dimensional graphics (), and the data were plotted versus the frequency and timecourse and labeled as inspiratory phase or expiratory phase based on the spontaneous airflow direction. The airflow sensor calibration was checked using a 3-L syringe, and the pressure calibration was performed daily against a reference resistance (2 cm water/L/second).
Figure 1 Representative sample of respiratory resistance in a three-dimensional graphic generated by MostGraph-01 (Chest MI, Inc, Tokyo, Japan). The X-axis shows the frequency from 4 Hz to 35 Hz, the Y-axis shows respiratory resistance, and the Z-axis shows the timecourse. The inspiratory and expiratory phases were based on the airflow of the subjects. The image was created based on the measured results for respiratory impedance.
Procedure
The subjects, in the sitting position with the head in a natural position, firmly supported their cheeks using both hands to reduce the influence of the upper airway shunt effect. The subjects wore a noseclip and closed their lips tightly around the mouthpiece to prevent air leakage. After the spontaneous volume and airflow of the subjects were monitored and stable tidal breathing was confirmed, respiratory impedance was measured during five technically acceptable periods of stable tidal breathing or 60 seconds of tidal breathing.
Data analysis
All FOT data were manually checked for the value of “coherence,” which was calculated based on the percentage of the similarity of tidal breathing in each respiratory cycle. Because stable tidal breathing is recommended for Rrs measurement, inadequate breathing events – including artifacts such as coughing and swallowing – which cause the value of coherence in each respiratory cycle to be less than 75% were excluded from the analysis. After this editing, the mean respiratory cycle periods were tabulated, including the inspiratory and expiratory phase periods, mean Rrs, and mean Xrs at 4–35 Hz for three to four satisfactory tests. In whole-breath analysis, the averages of the mean, maximal, and minimal Rrs values at 4–35 Hz were evaluated. For analysis of the pattern of change in Rrs, COPD subjects were tentatively classified into two patterns, based on the behavior of changes in Rrs at 4 Hz during the respiratory cycle. One pattern was a sinusoidal pattern that consists of one peak and one valley per respiratory cycle, and the other was a bimodal pattern that consists of two peaks and two valleys per respiratory cycle. In inspiratory–expiratory breath analysis, the averages of the maximal and minimal values for inspiratory and expiratory Rrs at 4 Hz, 20 Hz, and 35 Hz were evaluated. The difference between the maximal and minimal values of Rrs (ΔRrs) during the respiratory cycle, inspiratory phase, and expiratory phase were also evaluated. In this study, due to the desire to focus on the changes in Rrs in whole-breath and inspiratory–expiratory breath analysis, mainly Rrs was targeted and analyzed and Xrs excluded, even though Most-Graph-01 can also depict Xrs.
Lung function tests
All patients underwent spirometry using a FUDAC-77 (Fukuda Denshi Co, Tokyo, Japan). The predicted values of spirometry were calculated in accordance with the Japanese Respiratory Society guidelines.Citation11
Statistical analysis
Comparisons between the two groups were performed using Student’s t-test, and comparisons of Rrs between the inspiratory and expiratory phases were performed by oneway analysis of variance, followed by multiple comparisons using the Bonferroni method. Relationships between the FOT parameters, respiratory cycles, and the pulmonary function test parameters were evaluated using Pearson’s correlation coefficient (r). All data are expressed as the mean ± standard error of the mean unless otherwise specified. Significance was defined as a P value of < 0.05. All analyses were performed using PASW® Statistics 18 (SPSS Japan, Tokyo, Japan).
Results
Whole-breath analysis
Respiratory cycle during tidal breathing in patients with COPD
First, the respiratory cycle during tidal breathing between mild and moderate COPD patients was compared using MostGraph-01. The respiratory cycle in spontaneous tidal breathing was similar in both the mild and moderate groups (). The inspiratory and expiratory phases also showed no significant differences between the groups. However, the ratio of the inspiratory to expiratory phases was significantly lower in moderate COPD than in mild COPD. Additionally, the ratio of the inspiratory to expiratory phase showed moderate correlations with each of FEV1, FEV1 (percent predicted), and FEV1/forced vital capacity (r = 0.568, P = 0.02; r = 0.610, P = 0.01; and r = 0.467, P = 0.016, respectively), indicating that prolonged expiration was a characteristic of moderate COPD compared with mild COPD.
Table 2 Respiratory cycle period during tidal breathing in patients with chronic obstructive pulmonary disease
Patterns of Rrs change in tidal breathing in COPD
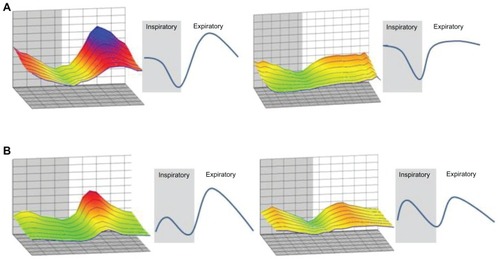
Since Rrs in patients with COPD appeared to change dynamically during tidal breathing in the three-dimensional graphics created by MostGraph-01 (), it was evaluated whether the means of the maximal and minimal values of R4, R20, and R35 differed significantly between the inspiratory and expiratory phases of tidal breathing (). The maximal and minimal Rrs values at 4 Hz during tidal breathing were significantly different between the inspiratory and expiratory phases in the COPD patients (). During tidal breathing, Rrs at 4 Hz changed dynamically during the respiratory cycle, with the minimal Rrs at 4 Hz occurring at the end of the inspiratory phase and the maximal Rrs at 4 Hz occurring in the middle of the expiratory phase. Rrs at 20 Hz and 35 Hz () showed similar trends to Rrs at 4 Hz, although some of the maximal and minimal Rrs values were not significantly different. The behavior of Rrs was thought to be dynamic change during tidal breathing in COPD ( and ). Next, since the behavior of the dynamic Rrs change seemed to have some cyclic regularity, the pattern of Rrs changes during tidal breathing in COPD was evaluated. Based on the changes in Rrs at 4 Hz in the three-dimensional graphics, they were tentatively classified into two patterns (). One was a sinusoidal pattern (n = 8), and the other was a bimodal pattern (n = 18), as described in Methods. The differences in the respiratory cycle, the pulmonary function, and the severity of COPD between these two patterns were evaluated (). The sinusoidal pattern group had a longer breathing period and a longer expiratory phase than the bimodal pattern group. The two pattern groups showed no significant differences in regard to the pulmonary function test parameters. Although the sinusoidal pattern was predominant in moderate COPD and the bimodal pattern was predominant in mild COPD, the numbers of patients were too small to show statistically significant differences between the groups.
Table 3 Comparison of respiratory parameters between the patterns of change in respiratory resistance during tidal breathing in chronic obstructive pulmonary disease
Figure 2 Comparison of respiratory resistance between the maximal and minimal values in the inspiratory and expiratory phases in chronic obstructive pulmonary disease. (A) Left panel: maximal and minimal respiratory resistance in the inspiratory and expiratory phases in a representative three-dimensional graphic image, created by MostGraph-01 (Chest MI, Inc, Tokyo, Japan), in patients with chronic obstructive pulmonary disease. Right panel: upper, middle, and lower panels show the changes in respiratory resistance at 4 Hz, 20 Hz, and 35 Hz, respectively, during the respiratory cycle. Comparison of the maximal and minimal respiratory resistance values at (B) 4 Hz, (C) 20 Hz, and (D) 35 Hz during the respiratory cycle are also shown.
Notes: Comparison of respiratory resistance between the inspiratory and expiratory phases was performed by one-way analysis of variance followed by multiple comparisons using the Bonferroni method. *P < 0.05 for each group.
Abbreviations: ex max, maximal value in the expiratory phase; ex min, minimal value in the expiratory phase; ins max, maximal value in the inspiratory phase; ins min, minimal value in the inspiratory phase; Rrs, respiratory resistance; R4, respiratory resistance at 4 Hz; R20, respiratory resistance at 20 Hz; R35, respiratory resistance at 35 Hz.
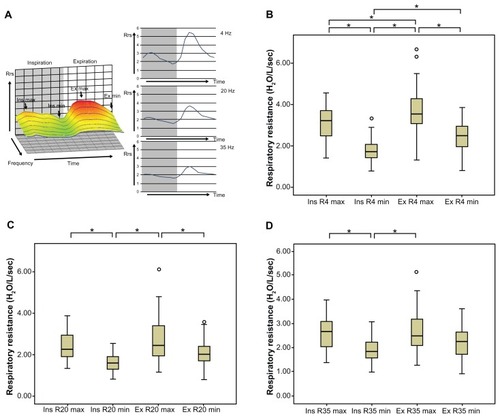
Figure 3 Patterns of change in respiratory resistance during tidal breathing in patients with chronic obstructive pulmonary disease. Respiratory resistance in three-dimensional graphics generated by MostGraph-01 (Chest MI, Inc, Tokyo, Japan) for patients with chronic obstructive pulmonary disease changed dynamically. Based on respiratory resistance at 4 Hz, the changes were classified into two patterns: (A) the sinusoidal pattern, which consisted of one peak and one valley in each respiratory cycle, and (B) the bimodal pattern, which consisted of two peaks and two valleys in each respiratory cycle.
Comparison of whole-breath Rrs between mild and moderate COPD
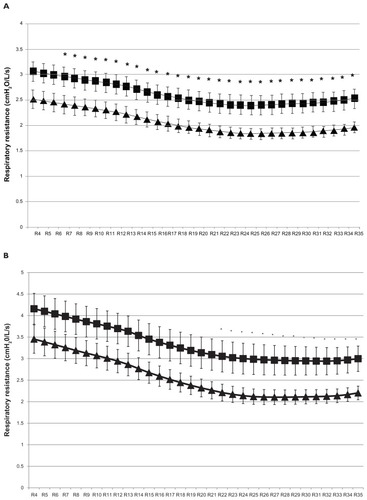
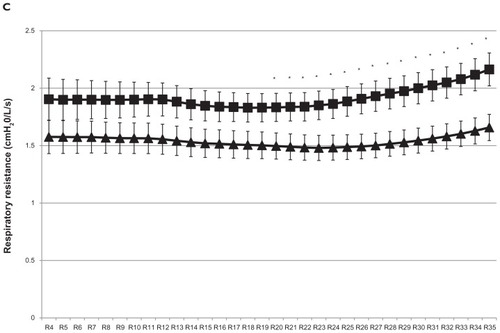
The averages of the mean whole-breath Rrs at 4–35 Hz in mild and moderate COPD are plotted in . The mean Rrs values at more than 7 Hz were significantly greater in the moderate COPD group. It is seen that the mean whole-breath Rrs at 4–35 Hz followed a frequency-dependent manner, with Rrs at lower frequencies being greater in more severe airway obstructive disease. The averages of the maximum whole-breath Rrs at 4–35 Hz in mild and moderate COPD are plotted in . The maximum Rrs values at more than 22 Hz were significantly greater in moderate COPD than in mild COPD, although the maximum values of Rrs at lower frequencies did not differ significantly between mild and moderate COPD in spite of their frequency-dependent change. plots the averages of the minimal whole-breath Rrs values at 4–35 Hz in mild and moderate COPD; the minimal Rrs values at more than 20 Hz were significantly greater in the moderate COPD group than in the mild COPD group. Interestingly, the averages of the minimal Rrs values at the lower frequencies could not be confirmed to change in a frequency-dependent manner, although the mean and maximal Rrs were confirmed to do so. Moreover, the minimal Rrs at the higher frequencies of 20 Hz through 35 Hz showed an increasing trend and were significantly greater in the moderate COPD group. Thus, a trend of increase in the minimal Rrs at higher frequencies during tidal breathing may be a characteristic finding in moderate COPD compared with mild COPD.
Figure 4 Comparison of respiratory resistance at 4–35 Hz in whole-breath between mild (▴) and moderate (■) chronic obstructive pulmonary disease. Comparison of whole-breath (A) mean respiratory resistance, (B) maximal respiratory resistance, and (C) minimal respiratory resistance are shown.
Inspiratory–expiratory breath analysis
Comparison of Rrs in inspiratory and expiratory phases between mild and moderate COPD
As already seen in , the maximal and the minimal values of Rrs during tidal breathing differed significantly between the inspiratory and expiratory phases in COPD. In order to clarify whether Rrs in the inspiratory and expiratory phases can be used to evaluate the severity of COPD, Rrs values at 4 Hz, 20 Hz, and 35 Hz were compared between mild and moderate COPD. The maximal and minimal values of Rrs at 4 Hz in the inspiratory and expiratory phases were similar in both groups, but the minimal value of Rrs at 4 Hz in the expiratory phase was greater in moderate COPD than in mild COPD (). The maximal and minimal values of Rrs at 20 Hz and 35 Hz in the inspiratory and expiratory phases were significantly greater in the moderate COPD group.
Table 4 Comparison of the maximal and minimal respiratory resistance at 4 Hz, 20 Hz, and 35 Hz in inspiratory and expiratory phases between mild and moderate chronic obstructive pulmonary disease
Comparison of ΔRrs in inspiratory and expiratory phases between mild and moderate COPD
Differences in Rrs during the respiratory cycle might reflect differences in airway obstruction during the respiratory cycle in each stage of COPD. To evaluate this, it was determined whether the values of ΔRrs for the respiratory cycle, the inspiratory phase, and the expiratory phase differed between the two COPD groups (). The inspiratory, expiratory, and respiratory ΔRrs at 4 Hz and 20 Hz were similar in both the mild and moderate COPD groups. Although the expiratory and respiratory ΔRrs values at 35 Hz were similar in the two COPD groups, the inspiratory ΔRrs at 35 Hz was significantly greater in moderate COPD. Inspiratory ΔRrs at 35 Hz was examined to test for relationships with the pulmonary function test parameters and respiratory cycle parameters. Inspiratory ΔRrs at 35 Hz showed no correlations with the pulmonary function test parameters, but it showed a moderate positive correlation with the expiratory phase (r = 0.469, P = 0.016) and a moderate negative correlation with the ratio of the inspiratory to expiratory phases (r = −0.434, P = 0.027).
Table 5 Comparison of the change in respiratory resistance at 4 Hz, 20 Hz, and 35 Hz in inspiratory and expiratory phases between mild and moderate chronic obstructive pulmonary disease
Discussion
It was found that prolonged expiration was more predominant in moderate COPD than mild COPD, although the respiratory cycle duration was similar in both groups. In the respiratory cycle, Rrs demonstrated dynamic and cyclic change during tidal breathing in patients with COPD. The mean and maximal whole-breath Rrs values showed a frequency-dependent manner and were greater in moderate COPD than in mild COPD. The minimal whole-breath Rrs values did not show a frequency-dependent manner, and they tended to increase and be greater in the moderate COPD group at higher frequencies, ie, 20 Hz through 35 Hz. Inspiratory–expiratory breath analysis revealed that the maximal and minimal Rrs values at 20 Hz and 35 Hz in the inspiratory and expiratory phases were greater in moderate COPD than in mild COPD. Inspiratory ΔRrs at 35 Hz was significantly greater in moderate COPD than in mild COPD. These results demonstrate that the Rrs values at higher frequencies in the inspiratory and expiratory phases are distinct during the earlier stages of COPD and suggest the importance of measurement of Rrs during the respiratory cycle, even in the inspiratory phase, in COPD patients.
Airflow limitation during the expiratory phase in airway obstructive disease causes prolonged expiration, which is one of the hallmarks of COPD. Since moderate COPD has more severe airway obstruction than mild COPD, the results confirmed that moderate COPD showed more greatly prolonged expiration than mild COPD, as reported by others,Citation12 despite the similar respiratory cycle in both groups.
During tidal breathing in COPD patients, Rrs changed dynamically in synchrony with the dynamic narrowing of the airway in COPD.Citation7 It was found that Rrs at 4–35 Hz, especially at 4 Hz, changed dynamically and cyclically during the respiratory cycle, showing maximal and minimal Rrs values in the inspiratory and expiratory phases. Previous reports regarding the average Rrs in the inspiratory and expiratory phases showed mainly that the Rrs values at lower frequencies in the expiratory phase were greater than those in the inspiratory phase in COPD.Citation8,Citation9,Citation13,Citation14 The dynamic change in Rrs that was demonstrated during tidal breathing was similar to the findings of some earlier reportsCitation7,Citation14 that showed dynamic change in Rrs at 5 Hz and 8 Hz. Ohishi et alCitation7 reported that the time courses of Rrs were notably dependent on the respiratory cycle and that the increase in Rrs at 5 Hz was most prominent in the middle of the expiratory phase. In the current study, it was confirmed that the changes in Rrs during tidal breathing were highly dependent on the respiratory cycle. In addition, it was demonstrated that the minimal Rrs value was most prominent at the end of the inspiratory phase and that Rrs at not only lower frequencies but also higher frequencies changed dynamically in the inspiratory and expiratory phases of tidal breathing in COPD (). These findings are thought to reflect the changes in airway obstruction that occur during the whole respiratory cycle of tidal breathing in patients with COPD.
The pattern of the changes in Rrs at 4 Hz during the respiratory cycle appeared to have some cyclic regularity, although the pattern differed among the severities of COPD. Therefore, the results were tentatively classified into a sinusoidal pattern and a bimodal pattern, even though previous reports had not done this. However, Farre et alCitation14 reported two representative patterns of Rrs variation at 8 Hz: one seemed like bimodal and the other seemed like sinusoidal. They suggested that the pattern of change in Rrs might be related to the respiratory flow or volume in patients with severe airway obstruction. In the current study, it was found that the sinusoidal pattern group had longer respiratory and expiratory phases than the bimodal pattern group and that those phases of the respiratory cycle were associated with the severity of COPD. Thus, the respiratory cycle might be affected by the respiratory flow, which depends on the severity of COPD. However, the respiratory flow was not compared between the two groups. Further research is needed to clarify the mechanism underlying this phenomenon.
The within-breath behavior of the oscillatory mechanics has been well documented for patients with COPD.Citation7–Citation9,Citation13–Citation15 Earlier reports demonstrated that Rrs at lower frequencies was greater in COPD patients compared with healthy subjects, in a frequency-dependent manner. Di Mango et al reported that severe COPD showed greater Rrs at lower frequencies, in accordance with the degree of airway obstruction. Citation6 However, in the current study, the mean Rrs at 4 to 6 Hz and the maximal Rrs at 4 to 21 Hz were not found to differ significantly between patients with mild and moderate COPD. Meanwhile, the mean and maximal Rrs at higher frequencies differed significantly between the two COPD groups. In addition, the minimal Rrs at higher frequencies in moderate COPD increased more with the progression of the frequencies than those in mild COPD, showing significant differences. These findings may be associated with the upper airway shunt effect,Citation16–Citation18 which increases as the respiratory impedance and/or oscillation frequency rises.Citation2 Because of the possibility of this shunt effect, previous reports did not discuss the minimal Rrs at higher frequencies in COPD. However, these findings were thought to explain the severity of airway obstruction during tidal breathing in COPD. Thus, these findings might be characteristic respective features in mild and moderate COPD, even though the upper airway shunt effect might hide the increase in Rrs at higher frequencies. Rrs at higher frequencies might be a useful property for diagnosing the early stage of COPD.
The Rrs values are reported to increase in accordance with the severity of COPD.Citation6 It is well known that the airway resistance to airflow in the respiratory tract decreases inversely with the fourth power of the radius of the respiratory tract and increases in proportion to the length of the tract during turbulent gas flow, in accordance with Poiseuille’s Law. The length of the airways in moderate COPD might be longer than in mild COPD, and the radiuses of the airways in moderate COPD might be smaller than in mild COPD, because hyperinflation of the lungs increases airway length and decreases airway diameter due to the loss of elastic recoil and compression caused by the emphysematous change. Thus, theoretically the Rrs values would be greater in moderate COPD than in mild COPD. The current results support this theoretical explanation of airway resistance. In particular, the finding that the maximal and minimal Rrs at higher frequencies in the inspiratory and expiratory phases were significantly different between mild and moderate COPD can be explained by this theory. Moreover, the finding that inspiratory ΔRrs at 35 Hz was significantly greater in moderate COPD might indicate that the change in the airway radius in the inspiratory phase is greater in moderate COPD than in mild COPD. In other words, the airway changes dynamically in the inspiratory phase, being narrower at the beginning and wider at the end of the inspiratory phase in moderate COPD compared with mild COPD. In addition, the finding that inspiratory ΔRrs at 35 Hz correlated with a prolonged expiratory phase might suggest that the degree of small airway collapse is greater during a prolonged expiratory phase in COPD. Also, Most- Graph-01, which was used in this study, might be a useful device for detecting changes in Rrs – which might indicate changes in airway diameter – during tidal breathing in patients with COPD.
A limitation of this study was that the sample number was too small to demonstrate statistical significance. Moreover, the findings concerning the pathophysiology of COPD were very limited in this study. A larger number of subjects will be necessary for precise evaluation of the pathophysiological features of COPD. Another limitation is that the study did not enroll age-matched normal individuals. Therefore, further studies are needed to fully clarify the potential of Rrs at higher frequencies for evaluation of early-stage COPD. Although this study might be considered a pilot study, the findings are potentially of clinical value for evaluation of COPD.
This report did not focus on Xrs during tidal breathing. The results for Xrs (not shown) found that the mean values at 4 Hz during the respiratory cycle did not differ significantly between mild and moderate COPD. The Xrs values at 4 Hz in the inspiratory and expiratory phases also did not differ significantly between the groups. Previous reports showed that the behavior of Xrs in the respiratory cycle in COPD was the inverse of the behavior of Rrs.7–9,13,19,20 In addition, earlier reports demonstrated the importance of XrsCitation7,Citation8 and suggested that it reflects advance of the disease in late-stage COPD.Citation6 No significant difference was found in the mean Xrs during the respiratory cycle between mild and moderate COPD. Moreover, since Xrs at 4 Hz fluctuated greatly during tidal breathing in some patients, ie, not smoothly or dynamically, it was too difficult to define the maximal and minimal Xrs at 4 Hz during tidal breathing. Thus, regarding the dynamic changes during tidal breathing, no difference in Xrs in the inspiratory and expiratory phases during tidal breathing could be demonstrated between mild and moderate COPD. Moreover, Xrs is a negative value, and it is rather confusing and difficult to simultaneously understand the changes in both Rrs and Xrs. This study aimed to focus on the differences in Rrs between mild and moderate COPD and sharpen the focus of the findings in this report. Thus, it was decided to describe mainly the changes in Rrs in the inspiratory and expiratory phases of tidal breathing in patients with early-stage COPD, without showing Xrs.
Conclusion
It was demonstrated that the Rrs values changed dynamically over the course of lower to higher frequencies during stable tidal breathing and showed the characteristics of frequency-specificity in whole-breathing, not only in the expiratory phase but also the inspiratory phase, in patients with COPD. The Rrs values at higher frequencies in the inspiratory and expiratory phases in patients with moderate COPD were greater than those in mild COPD. Rrs at higher frequencies has potential as a useful marker for detecting progression of airway obstruction at an early stage of COPD.
Acknowledgments
The authors wish to thank Hajime Kurosawa, Yoshio Shimizu, and Hajime Takizawa for their general assistance. The authors are also very grateful to Lawrence W Stiver (Quality Translation Co, Ltd, Tokyo, Japan) for improving the readability of the manuscript. This work was supported by Grants-in-Aid for Scientific Research from the Ministry of Education, Culture, Sports, Science, and Technology of Japan and grants from the Ministry of Health, Labor and Welfare, Japan. Some of the results of this study have previously been presented in abstract form at international conferences.
Disclosure
The authors report no conflicts of interest in this work.
References
- RabeKFHurdSAnzuetoAGlobal strategy for the diagnosis, management, and prevention of chronic obstructive pulmonary disease: GOLD executive summaryAm J Respir Crit Care Med2007176653255517507545
- OostveenEMacLeodDLorinoHThe forced oscillation technique in clinical practice: methodology, recommendations and future developmentsEur Respir J20032261026104114680096
- LaPradASLutchenKRRespiratory impedance measurements for assessment of lung mechanics: focus on asthmaRespir Physiol Neurobiol20081631–3647318579455
- GoldmanMDClinical application of forced oscillationPulm Pharmacol Ther200114534135011603948
- GrimbyGTakishimaTGrahamWMacklemPMeadJFrequency dependence of flow resistance in patients with obstructive lung diseaseJ Clin Invest1968476145514655653219
- Di MangoAMLopesAJJansenJMMeloPLChanges in respiratory mechanics with increasing degrees of airway obstruction in COPD: detection by forced oscillation techniqueRespir Med2006100339941016115754
- OhishiJKurosawaHOgawaHIrokawaTHidaWKohzukiMApplication of impulse oscillometry for within-breath analysis in patients with chronic obstructive pulmonary disease: pilot studyBMJ Open201112e000184
- ParediPGoldmanMAlamenAComparison of inspiratory and expiratory resistance and reactance in patients with asthma and chronic obstructive pulmonary diseaseThorax201065326326720335298
- KubotaMShiraiGNakamoriTKokuboKMasudaNKobayashiHLow frequency oscillometry parameters in COPD patients are less variable during inspiration than during expirationRespir Physiol Neurobiol20091662737919429522
- KurosawaHKohzukiMImages in clinical medicine. Dynamic airway narrowingN Engl J Med200435010103614999115
- Japanese Respiratory SocietyPredicted values of spirometry and arterial blood gas analysisNihon Kokyuki Gakkai Zasshi200139117 Japanese
- CommeyJOLevisonHPhysical signs in childhood asthmaPediatrics1976584537541972794
- KandaSFujimotoKKomatsuYYasuoMHanaokaMKuboKEvaluation of respiratory impedance in asthma and COPD by an impulse oscillation systemIntern Med2010491233020045997
- FarreRPeslinRRotgerMBarberaJANavajasDForced oscillation total respiratory resistance and spontaneous breathing lung resistance in COPD patientsEur Respir J199914117217810489847
- OfficerTMPellegrinoRBrusascoVRodarteJRMeasurement of pulmonary resistance and dynamic compliance with airway obstructionJ Appl Physiol1998855198219889804607
- PeslinRDuvivierCJardinPUpper airway walls impedance measured with head plethysmographJ Appl Physiol19845725966006469826
- CauberghsMVan de WoestijneKPEffect of upper airway shunt and series properties on respiratory impedance measurementsJ Appl Physiol1989665227422792745290
- IwatsuboYLorinoHHubertCMeasurement of respiratory impedance by forced oscillation: comparison of the standard and head generator methodsEur Respir J1994759019068050547
- KolsumUBorrillZRoyKImpulse oscillometry in COPD: identification of measurements related to airway obstruction, airway conductance and lung volumesRespir Med2009103113614318760576
- DellacaRLSantusPAlivertiADetection of expiratory flow limitation in COPD using the forced oscillation techniqueEur Respir J200423223224014979497