
Abstract
Purpose
Smoking is recognized as a risk factor for Chronic Obstructive Pulmonary Disease (COPD), yet only 20–25% of smokers eventually develop COPD. Since its molecular pathogenesis remains unclear, there is an important need to further understand genetic differences between smokers with COPD and healthy smokers, screen out high-risk and susceptible groups among smokers, and find effective therapeutic targets.
Methods
Bioinformatics tools were used to screen biomarkers that were significantly associated with COPD smokers and healthy smokers. qRT-PCR and Western blotting analysis were used to detect hub gene expression in CSE-treated BEAS-2B cells and lung tissue of COPD mouse models.
Results
Our study identified 132 DEGs. The GO and KEGG analyses suggested that the ECM-receptor interaction, MAPK signaling pathway, Chemokine signaling pathway, PI3K-Akt signaling pathway, extracellular matrix organization and collagen fibril organization were associated with the occurrence and development of COPD. In addition, WGCNA analysis of GSE1650 showed that the brown module was most correlated with COPD. The intersection between the brown module and DEGs was used to identify 9 HUB genes (COL14A1, SULF1, MOXD1, CXCL12, CHRNA1, COMP, POU2AF1, MMP11, THBS2) that showed consistent expression and upregulation. Both the mRNA and protein expression levels of the Hub genes (except that of MMP11) were significantly upregulated in tobacco smoke exposed mouse emphysema models and CSE treated BEAS-2B cells.
Conclusion
Our results suggest that COL14A1, SULF1, MOXD1, CXCL12, CHRNA1, COMP, POU2AF1, and THBS2 may be potentially useful biomarkers for identifying smokers with a risk of developing COPD. The GO and KEGG functional enrichment analyses further confirmed the significant role played by ECM in the pathogenesis of COPD. The results of this study may provide further insights into the pathogenetic mechanisms involved in COPD.
Keywords:
Introduction
Chronic obstructive pulmonary disease (COPD) will become the third leading cause of death worldwide.Citation1,Citation2 The incidence of COPD worldwide is 13.1%Citation3 and is 13.7% in the Chinese population over 40 years of age.Citation4 Emphysema is one of the most common phenotypes.Citation1 Over the past few decades, we have conducted much research has been conducted on COPD, but due to a low level of understanding of the pathogenesis of COPD, the lack of special treatment means, disease prevention and control is a problem worldwide. Smoking is a recognized cause of disease, but only 20–25% of smokers eventually develop COPD,Citation5 while up to 25% of COPD patients have never smoked.Citation1 This suggests that there are differences in individual susceptibility (eg genetic factors, genetic polymorphisms) for the pathogenesis of COPD.Citation6 Therefore, it is crucial to further understand the genetic differences between smokers with COPD and healthy smokers, screen out high-risk and susceptible groups among smokers, and identify effective therapeutic targets.
In recent decades, high-throughput sequencing has been widely used in various fields of life science and clinical diseases, including COPD. Combined with bioinformatics analysis, it can help explore disease-related genes and mechanisms and predict molecular targets for precision therapy.Citation7,Citation8
In this study, we performed an integrated analysis on gene expression profiling data obtained from two microarray datasets (GSE1650 and GSE76925) containing lung tissues of smokers with severe COPD and smokers with normal lung function, with the aim of identifying potential molecular mechanisms and biomarkers for COPD. R software was used to identify DEGs and were subsequently analyzed using bioinformatic methods. The screened key genes were validated using a COPD mouse model and BEAS-2B cells.
Materials and Methods
Gene Data
Shared lung tissue chip data on COPD patients were obtained from the GEO database (https://www.ncbi.nlm.nih.gov/gds/?). Microarrays with accession no. GSE1650 and no. GSE76925 were used in this study. GSE1650 assessed gene expression (GPL96 [HG-U133A] Affymetrix Human Genome U133A Array) in 18 patients with severe emphysema and compared it to data on 12 matched phenotypically normal smokers.Citation9 GSE76925 (GPL10558Illumina HumanHT-12 V4.0 expression beadchip) assessed gene expression data on 111 patients with severe emphysema and compared it to data on 40 phenotypically normal smokers.Citation10
Data Pretreatment and Screening of Differentially Expressed Genes (DEGs)
First, the quality of the raw data in GSE1650 and GSE76925 and the grouping of samples were analyzed using PCA and a sample correlation graph. After quality control, the differential expression analysis on mRNA was performed using the Limma and AFFy package in R 4.0.5 software (https://www.r-project.org/). The DEGs between smokers with severe COPD and smokers with normal lung function were identified using a P-value of <0.05 and |fold change|≥1.5 as the cutoff for screening. The volcano map and heatmap of the DEGs were respectively generated using the ggplot2 and pheatmap packages in R software.
Gene Ontology (GO) and Kyoto Encyclopedia of Genes and Genomes (KEGG) Pathway Enrichment Analyses of the DEGs
GO functional annotation includes biological processes (BPs), cellular components (CCs), and molecular functions (MFs), which can be used to clarify the potential biological functions of the target genes. Pathway enrichment analysis can be used to identify the main biochemical metabolic pathways and signal transduction pathways involved in target genes. GO and KEGG enrichment analysis of the DEGs were performed using the ClusterProfiler R package (http://bioconductor.org/packages/release/bioc/html/clusterProfiler.html). A P-value of ≤ 0.05 was used as the cutoff for screening.
Construction of Protein–Protein Interaction (PPI) Network
The STRING database (https://string-db.org/cgi/input.pl) was used to identify interactions between the DEGs. Subsequently, Hub DEGs in the PPI regulatory network were identified using the cytoHubba plugin in CYTOSCAPE (version 3.8.2; http://cytoscape.org/, all filters use default parameters). The role of the gene is greater in the PPI network the darker the color it is.Citation11
Weighted Gene Co-Expression Analysis (WGCNA)
WGCNA can be used to identify highly correlated gene clusters and to determine the association between module and sample traits.Citation12 First, the expression matrix was normalized using the Limma package, and then the clinical or grouping information was sorted. All genes with a P<0.05 in GSE1650 were used for subsequent WGCNA, and discrete samples were evaluated. The WGCNA R package (https://cran.r-project.org/web/packages/WGCNA/index.html) was used to identify coexpression modules. The soft threshold power (β= 6) was selected so that the resulting adjacency matrix approximated a scale-free topology criterion. The adjacency matrix was transformed into a topological overlap matrix (TOM)Citation13 and modules were defined as branches of a hierarchical clustering tree using a dissimilarity measure, and color was assigned to each module.
Screening Hub Genes
Correlation coefficient and P-values were used to analyze the correlation between each module and COPD phenotype, and the gene module with the highest degree of correlation were selected and the intersection between these module genes and the DEGs were defined as key genes. The brown module contained 150 genes, intersected with 132 DEGs and identified 13 key genes. Then, genes with consistent expression and up-regulation in the two datasets were defined as HUB genes and selected for further verification.
Mice
C57BL/6 mice (6–8 week old, male, 20–25 g) were purchased from the Guangxi Medical University Laboratory Animal Center (Nanning, China) and were exposed to air or cigarette smoke (CS) (zhenlong unfiltered cigarettes) for 24 weeks (n=6 per group), as previously described.Citation7,Citation14 All animal studies were reviewed and approved by the Laboratory Animal Ethics Committee of Guangxi Medical University (NO.2017-KY-NSFC-111) and in line with the Laboratory animal—Guideline for ethical review of animal welfare (GB/T 35892-2018).
Evaluation of an Experimental Mouse Model of Emphysema
After cigarette smoke exposure, the mice were anesthetized and sacrificed. The right lungs were fixed in 4% neutral formalin, embedded in paraffin and cut into 5 µm transverse sections and stained with H&E solution to conduct histopathological studies. We quantified the severity of emphysema by determining the mean linear intercept (Lm).Citation7,Citation14 For each animal, three fields on the right lobe of the lung were randomly selected (excluding large airways and vessels) and were examined by two independent observers.
Cigarette Smoke Extract (CSE) Preparation
Cigarette smoke was slowly dissolved in DMEM medium to obtain a concentration of 20% CSE, which was filtered and sterilized using a 0.22 um filter and kept for use in subsequent experiments.Citation15
BEAS-2B Cell Culture and Treatment
Cells of the normal human bronchial and lung epithelial cell line, BEAS-2B (China Center for Type Culture Collection, CCTCC), were cultured in DMEM medium (Gibco, Shanghai, China) containing 10% fetal bovine serum and 1% penicillin/streptomycin (Solarbio, Beijing, China) at 37°C in a 5% CO2 humidified atmosphere. The BEAS-2B cells were seeded into 10 cm petri dishes and were stimulated with 0.15% (final concentration) CSE for 24 h. The cells were collected and proteins were extracted to conduct the Western blotting analysis.
Cell Viability Assay
Cell viability was assessed using the cell counting kit 8 (CCK-8; Vazyme Biotech, Nanjing, China) according to the manufacturer’s instructions. The BEAS-2B cells (1×10⁴/well) were incubated with different concentrations of CSE in 96-well plates for 24 h, and then 10 ul of CCK-8 solution was added to the culture medium. The cells were further incubated for 50 min at 37°C, and the optical density was measured at 450 nm and was considered the indirect index of relative cell viability.
RNA Extraction and Quantitative Real-Time Polymerase Chain Reaction (qRT-PCR)
Total RNA was extracted from the left lung using TRIzol reagent (Sangon Biotech, Shanghai, China) and was reverse-transcribed into complementary DNA, following the manufacturer’s protocol. Then, the samples were evaluated on a RT-PCR system (Thermo Fisher Scientific) using the ChamQ SYBR qPCR Master Mix (Vazyme Biotech, Nanjing, China) kit, following the manufacturer’s instructions. The primers of these mRNAs were obtained from Sangon Biotech (Shanghai, China). The ΔΔCT method was used to evaluate the relative expression level of each target gene after normalization using GAPDH. The primer sequences used for each target gene are listed in .
Table 1 Primers Used for qPCR in This Study
Western Blotting Analysis
Total protein was extracted from BEAS-2B cells and lung tissue using RIPA lysis buffer containing PMSF (Solarbio, Shanghai, China) and protein concentration was determined using a BCA protein assay kit. Then, the proteins were isolated using 8–15% SDS-PAGE and transferred onto PVDF membranes, which were blocked at room temperature with 5% skim milk for 1 hour. The membranes were incubated overnight at 4°C with primary antibodies, including anti-COL14A1 (1:1000, Invitrogen), anti-SULF1, anti-MOXD1, anti-CXCL12, anti-CHRNA1, anti-MMP11, anti-THBS2, anti-POU2AF1 (1:1000, ABclonal), anti-COMP (1:1000, Proteintech), and GAPDH as the control (1:2500, SAB). The next day the membranes were washed with TBST, and then incubated for 1 h at room temperature with HRP labeled secondary antibodies (goat-anti-rabbit as appropriate, 1:2500, Proteintech), and visualized using the ECL detection system (Beyotime Institute of Biotechnology). Band intensity was analyzed using ImageJ software. Each assay was performed in triplicate.
Statistical Analyses
The two-tailed Student’s t-test was employed to compare the expression at mRNA and protein levels between the two groups. All statistical analyses were performed using GraphPad Prism 8 (Graph-Pad Software, Inc., La Jolla, CA, USA). Differences in a P-value of <0.05 were considered statistically significant.
Results
Identification of DEGs in COPD
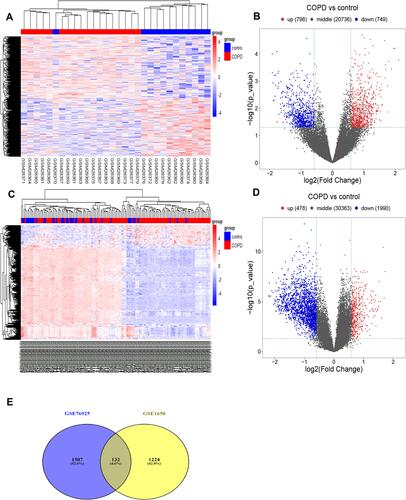
After the PCA analysis of sample grouping and quality control were conducted, the DEGs between COPD and the control group in each dataset were analyzed using the Limma and AFFy packages, and were visualized using a heat map and a volcano map, as shown in . Then, the intersection between different genes in the two datasets is shown using a Venn diagram (). 132 different genes were shared between the two datasets.
Figure 1 Identification of DEGs in the GSE1650 and GSE76925 datasets.
Gene Function and Annotation Enrichment Analysis of DEGs
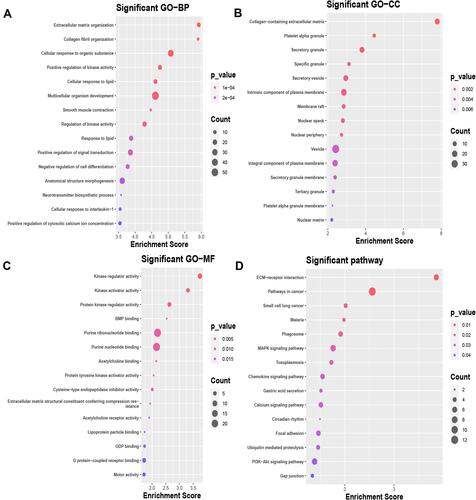
To understand the biological classification and function of the 132 DEGs, the ClusterProfiler R Package was used to conduct the GO and KEGG pathway enrichment analyses. GO functional notes in the BP suggested that the DEGs were enriched in “extracellular matrix organization”, “collagen fibril organization”, and “cellular response to organic substance” (). In the CC category, the DEGs were enriched in “collagen-containing extracellular matrix”, “platelet alpha granule,” and “secretory granule” (). In the MF category, the DEGs were involved in “kinase regulator activity”, “protein kinase regulator activity”, and“Acetylcholine binding” (). The KEGG pathway analysis indicated that the DEGs were associated with the following pathways: ECM-receptor interaction, MAPK signaling pathway, Chemokine signaling pathway, and the PI3K-Akt signaling pathway (). Enrichment analyses identify major biochemical metabolic pathways and signal transduction pathways involved in the DEGs and may reveal new pathways of pathogenesis.
Figure 2 GO and KEGG pathway enrichment analyses of the DEGs.
PPI Network Analysis of the DEGs
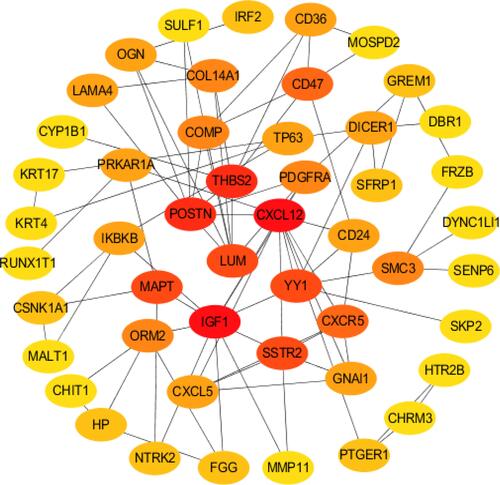
To further study interactions between the 132 DEGs, we constructed a PPI network using the STRING database using a combined score > 0.4 as the cutoff criterion. The PPI network for the integrated top 50 DEGs is shown in . To more accurately locate potential target genes, we performed a WGCNA analysis on the dataset.
Figure 3 PPI diagram of the top 50 HUB genes. STRING database was used to identify the interactions between the DEGs. A confidence score >0.4 was used as the cutoff criterion. In addition, Hub DEGs were identified with cytoHubba plugin of CYTOSCAPE: The black lines indicate that the genes are interacting with each other, and the role of the gene is greater in the PPI network with the darker color.
Weighted Gene Co-Expression Network Construction
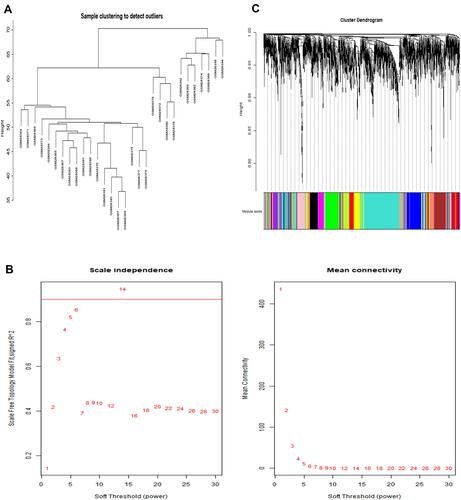
In this study, the WGCNA R package was used to identify coexpression modules for all genes with P-value of <0.05 in the GSE1650 dataset. The clinical or grouping information was sorted and the discrete samples were evaluated, with the results presented in the . In this study, we used β=6 as the soft-threshold to ensure a scale-free network ().
Figure 4 WGCNA.
Identification of Modules
After determining the optimal soft-threshold to be used to construct the co-expression network and dividing genes into different modules, we plotted the gene cluster tree. A total of 13 gene modules were obtained through clustering (). To screen for the gene module with the strongest degree of correlation with COPD and to understand the relationship between each module and gene expression, we analyzed the correlation between the module and phenotype using the correlation coefficient and the p-value ( and ). We found that the brown module showed the highest degree of correlation with disease development, compared with other disease modules. The brown module was therefore identified as a clinically significant module and was selected for use in further analyses.
Figure 5 Identification of modules relevant to clinical features of COPD.
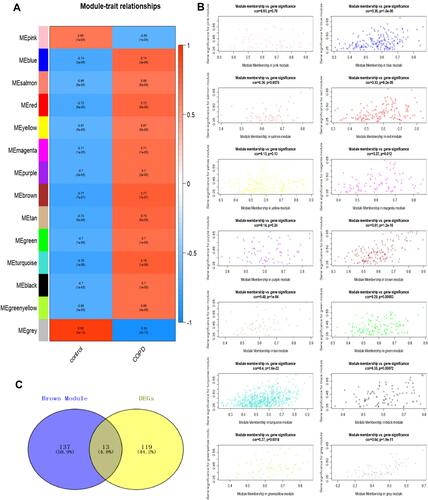
Selection of Key Genes
The brown module containing 150 genes was intersected with 132 DEGs to obtain 13 key genes (). We further selected 9 genes (COL14A1, SULF1, MOXD1, CXCL12, CHRNA1, COMP, POU2AF1, MMP11, THBS2) from among the 13 genes, which had an expression level that was consistent with our results and was upregulated in the two datasets, for further verification.
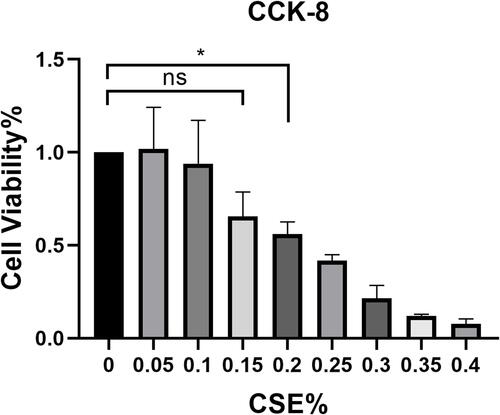
Effect of CSE Concentration on Cell Viability
Cell viability was assessed using the cell counting kit 8 according to the manufacturer’s instructions. The BEAS-2B cells (1×10⁴/well) were incubated with different concentrations of CSE (final concentration 0.05%, 0.1%, 0.15%, 0.2%, 0.25%, 0.3%, 0.35%, 0.4%) in 96-well plates for 24 h. The results showed that 0.15% CSE final concentration had no significant effect on cell viability. The results were presented in the .
Figure 6 CCK-8 detected the effect of CSE on BEAS-2B cytotoxicity, and 0.15%CSE had no significant effect on cell viability. *, p<0.05.
Expression of the 9 Key Genes in the Mouse Model of Emphysema and CSE-Induced BEAS-2B Cells
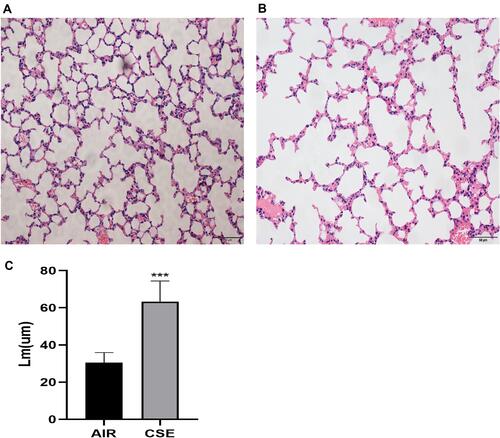
First, the success of the CS-induced emphysema mouse model was confirmed. Second, we discussed whether the 9 key genes were associated with the pathogenesis of emphysema. According to our previous studies,Citation7,Citation14 the Lm of mice exposed to tobacco smoke was significantly higher than that of control mice, indicating that an emphysema model was successfully established ().
Figure 7 HE micrographs of lung tissues of mice exposed to AIR (A) and CS (B) at a magnification of ×20. (C) The mean linear intercept (Lm) in the lung of mice exposed to AIR and CS.
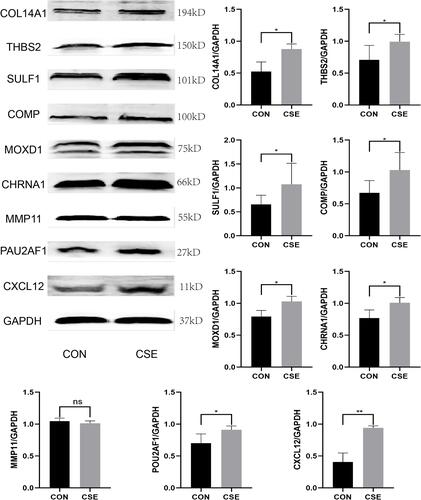
Next, as shown in , compared with the control mice, the mRNA expression level of the 9 hub genes were found to be higher in the lung tissue of CS-exposed mice. Second, the protein expression level of all these 9 key genes in the lung tissue of COPD mouse model () and BEAS-2B cells stimulated using 0.15% CSE () were measured. and shows that after CSE treatment, the protein expression levels of 8 of these genes, except MMP11, were significantly increased.
Figure 8 The mRNA expression level of the 9 key genes in the lung tissues of CS-exposed and control mice (n=6). *, p<0.05; **, p<0.01; ***, p<0.001.
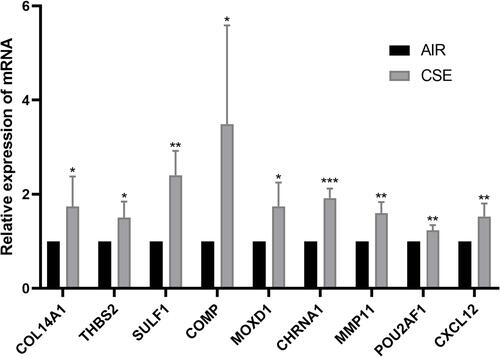
Figure 9 The protein expression level of the 9 key genes in lung tissues of mouse exposed to AIR and CSE. *, p<0.05; **, p<0.01; ****, p<0.0001.
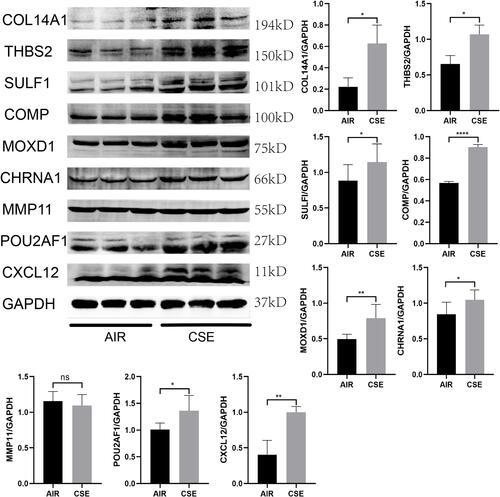
Figure 10 The protein expression level of the 9 key genes in control and CSE treated BEAS-2B cells. *, p<0.05; **, p<0.01.
Discussion
COPD is a major global health problem due to its high prevalence and ever increasing incidence.Citation2 Chronic bronchiolitis and emphysema are the most notable phenotypes of COPD.Citation15 Over the past few decades, we have conducted many research on COPD, but unfortunately, due to limited understanding of its pathogenesis and a lack of specific methods of treatment, these patients still show an unfavorable prognosis. Smoking is recognized as the most important risk factor for COPD, but only 20–25% of smokers eventually develop COPD.Citation5 Therefore, there is a need to further explore the genetic differences and potential methods of pathogenesis between smokers with COPD and healthy smokers.
After the rapid developments over the past decade, high-throughput sequencing has penetrated into all fields of life science and has managed to not only effectively cause developments in research, but has also gradually been applied in clinical practice. High-throughput sequencing can identify many differentially expressed genes in a short duration. Combined with bioinformatics analysis, it can help to explore disease-related genes and mechanisms to predict molecular targets to develop precision therapies.Citation7,Citation8 WGCNA results are highly reliable as it can comprehensively evaluate the correlation between co-expression modules and clinical features.Citation12,Citation16 Therefore, bioinformatics methods in conjunction with WGCNA were used in our study to screen differential genes.
In this study, we analyzed gene expression profile data on the lung tissues of smokers with severe COPD and smokers with normal lung function to identify potential differential biomarkers. First, 132 differentially expressed genes were identified. Subsequently, the ClusterProfiler R package was used to conduct GO and KEGG analyses. The GO analysis showed that the DEGs were mostly enriched in extracellular matrix organization, collagen fibril organization, and cellular response to organic substance. The KEGG analysis showed that the DEGs were mostly enriched in ECM-receptor interaction, MAPK and PI3K-Akt signaling pathways, and the Chemokine signaling pathway. Next, we used WGCNA to identify the brown modules as the most associated with COPD emphysema phenotypes in the GSE1650 dataset and intersected it with the 132 DEGs. 9 key genes (COL14A1, SULF1, MOXD1, CXCL12, CHRNA1, COMP, POU2AF1, MMP11, THBS2) were found to be strongly associated with the occurrence of COPD. qRT-PCR and Western blotting analysis were used to validate the expression of these genes in a mouse emphysema model and in CSE-induced BEAS-2B cells, respectively. The results indicated that the mRNA expression levels of the 9 hub genes were higher in the lungs of CS-exposed mice compared with AIR-exposed mice (). The protein expression levels of the other 8 genes, except MMP11, were also significantly elevated in lung tissue of COPD mouse model and BEAS-2B cells stimulated using 0.15% CSE ( and ). Among these 9 hub genes, except for POU2AF1 and CXCL12, the other 7 genes have not yet been studied in COPD.
COL14A1 encodes for the XIV collagen α chain and interacts with decorin to regulate cell growth and survival.Citation17 At present, abnormal methylation of COL14A1 has been found in a variety of diseases, including esophageal squamous cell carcinoma,Citation18 renal cell carcinoma,Citation17 and coronary artery disease.Citation19 MOXD1, a member of the monooxygenase family, is potentially involved in the biosynthesis of norepinephrine.Citation20,Citation21 MOXD1 is widely expressed in the brain, kidney, heart, and lung.Citation21 However, since the substrate of MOXD1 has not been determined, its function is still unknown. MOXD1 is located in the endoplasmic reticulum of cells and cannot be secretedCitation21 but may be involved in the regulation of sex-biased behaviors and physiologyCitation22 and is associated with schizophrenia.Citation20 MOXD1 knockdown suppresses the proliferation and xenograft tumor growth in osteosarcoma cells via inducing apoptosis.Citation23 MOXD1 has not yet been studied in COPD. CHRNA1, encode for the α1 subunit of the adult nicotinic acetylcholine receptor, whose mutation is known to cause Congenital myasthenic syndromes,Citation24 as well as multiple pterygium and fetal akinesia syndrome.Citation25 CHRNA1 was also identified to be associated with disuse atrophy of skeletal musclesCitation26 and macrophage inflammation,Citation27 but studies have not been conducted on CHRNA1 in the lung tissue of COPD yet. COMP can interact with multiple extracellular matrix proteins in cartilage and other tissues. COMP plays a role in fibrogenesis, chondrocyte proliferation, and collagen secretion.Citation28 Abnormal COMP expression has been found in many diseases, including cardiomyopathy,Citation29 fibrosisCitation30,Citation31 and many types of cancer.Citation32,Citation33 COMP has been shown to be a biomarker of IPF (idiopathic pulmonary fibrosis), osteoarthritis, rheumatoid arthritis, and a prognostic marker of joint injury.Citation28,Citation30,Citation34 THBS2 is a member of the thrombospondins family and is released from several types of cells, including endothelial cells and immune cells. THBS2 can bind to extracellular matrix (ECM) proteins and cell surface receptors to exert diverse biological effects, such as proliferation, apoptosis, cell adhesion, and migration.Citation35 Thus far, studies conducted on THBS2 have mainly focused on its effect on tumors. In some tumors, THBS2 acts as a negative regulator of tumor aggressiveness, and in others, it may promote tumor growth.Citation36,Citation37 However, COL14A1, MOXD1, CHRNA1, COMP, and THBS2 have not been studied in COPD. Our study found that the mRNA and protein expression levels of these genes were significantly elevated in both the COPD mouse model and CSE treated normal human bronchial epithelial cells, which may indicate its involvement in the pathogenesis of COPD. However, whether these genes can be used as biomarkers to distinguish COPD patients from healthy smokers and their specific roles needs to be studied further.
MMP11 (Matrix metalloproteinase 11) is an extracellular proteolytic enzyme that belongs to the matrix metalloproteinase family. These proteases are involved in extracellular matrix remodeling and recent studies on MMP11 have mainly focused on their effect on tumors. MMP11 has been found to be upregulated in a variety of tumors, accelerates tumor growth, and is associated with poor survival.Citation38,Citation39 However, MMP11 has not been studied in COPD. Our bioinformatics analysis found that MMP11 expression increased in smoking COPD lung tissue samples, but we found no evidence of elevated MMP11 expression in CSE-stimulated human bronchial epithelial cells. Therefore, the expression and role of MMP11 in COPD patient lung tissues needs to be studied further. Sulf1 can regulate the sulfate state of heparin sulfate proteoglycans (HSPGs), one of the main components of ECM. HSPGs play a variety of signal transduction functions by binding to cytokines, matrix proteins, chemokines.Citation40 Therefore, SULF1 is released by a variety of cells and may alter the function of ECM, which plays a significant role in the pathogenesis of COPD, by altering the structure of HSPGs.Citation41 SULF1 gene expression was found to be elevated in various cancers.Citation42,Citation43 These results are inconsistent with the results of previous studies, which considered SULF1 to be a tumor suppressor.Citation44 This effect may be related to the alternative splicing of the Sulf1 gene. The full length SULF1 shows opposite effects with the shorter splicing variant.Citation45 SULF2 levels in the serum of COPD patients has been found to be elevated, but there have not been any recent studies conducted on SULF1 in COPD.Citation43 At present, SULF1 has been confirmed to be significantly elevated in a mouse emphysema model and in vitro in bronchial epithelial cells stimulated by tobacco smoke, but its specific mechanism of action on the pathogenesis of COPD needs to be further elucidated. POU2AF1, previously thought to be expressed specifically in lymphocytes, regulates the expression of immunoglobulin and other host defense genes.Citation46,Citation47 A previous study found that smoking can downregulate the expression of POU2AF1 and host defense-related genes in airway epithelial cells. The upregulation of POU2AF1 can attenuate the downregulation of smoking-related airway epithelial-host defense genes.Citation48 However, our study found that POU2AF1 was upregulated in the cigarette smoke-stimulated mouse emphysema model and in vitro in CES-stimulated human bronchial epithelial cells. Therefore, the role of this gene in COPD needs to be studied further.
Cigarette smoke and other irritants may be able to activate innate cells in the lung to release chemokines and damage-associated molecular patterns (DAMPs). Chemokines can interact with endogenous DAMPs. For example, high mobility group box 1 can form a complex with CXCL12 (a chemokine) to enhance CXCL12 activityCitation49 and protect CXCL12 from degradation.Citation50 Therefore, chemokines play a key role in the pathogenesis of COPD patients. Studies have found that CXCL12 is significantly upregulated in the serum of COPD patients compared with that of healthy controls, and is positively correlated with small airway disease and emphysema detected using high-resolution chest CT scans.Citation51 When the Cxcl12/Cxcr4 signaling axis was blocked, the number of neutrophils decreased, and reverse migration increased inflammation levels.Citation52 The CXCL12 antagonist, AMD3100, can ameliorates emphysema-like manifestations in mice induced using cigarette smoke.Citation53 Consistent with the results of previous reports, our study also found that CXCL12 was significantly elevated in the lungs of mouse COPD models, but the specific role of CXCL12 in COPD requires further investigation.
Among the 9 HUB genes identified in our study, MMP11, CXCL12, COMP, SULF1, COL14A1, and THBS2 have all been reported to be associated with ECM, which has been confirmed to play a significant role in the pathogenesis of COPD. KEGG enrichment analysis also showed that the DEGs were mainly enriched in ECM-receptor interactions. This result confirms the reliability of our research study.
However, our study has some limitations. First, due to the lack of prognostic information included with the data, the relationship between these HUB genes and prognosis could not be analyzed. Second, our findings mainly focused on gene expression, and in-depth functional research and mechanism analysis was not conducted. Third, the expression of these genes has not been further verified in human tissues. In future studies, the collection of clinical data (including general conditions, lung function, and prognosis) should be improved as much as possible and verified in human lung tissue or peripheral blood samples as much as possible, while specific functional genes should be further identified and confirmed through mechanism studies.
In conclusion, this study provides a basis for exploring the genetic differences between smokers with severe COPD and smokers with normal lung function. Further, functional enrichment analysis using GO and KEGG analyses further confirmed the significant role of ECM in the pathogenesis of COPD. Therefore, this study provides new insights for identifying biomarkers and therapeutic targets for smokers with severe COPD.
Conclusion
Our results revealed that COL14A1, SULF1, MOXD1, CXCL12, CHRNA1, COMP, POU2AF1, and THBS2 are highly expressed in COPD, and that these genes can be potentially used as biomarkers and even therapeutic targets for COPD. Additionally, the functional enrichment analyses conducted further confirmed the significant role played by ECM in the pathogenesis of COPD. Therefore, this research study may provide insights into the pathogenetic mechanisms involved in COPD.
Author Contributions
Lin Chen designed the study, completed the experiment and data analysis, and wrote the manuscript. Xiaoning Zhong proposed the conception and designed the experiment, and reviewed the paper and made the final revision. Donglan Zhu and Jinfu Huang helped complete the experiment and constructed the animal model of COPD. Hui Zhang and Guang Zhou assisted in analyzing the data and gave valuable suggestions for the paper writing. Everyone reviews and agrees to be responsible for the content of the article.
Disclosure
The authors report no conflicts of interest in this work.
References
- Labaki WW, Rosenberg SR. Chronic obstructive pulmonary disease. Ann Intern Med. 2020;173(3):ITC17–ITC32. doi:10.7326/AITC202008040
- Soriano JB, Abajobir AA, Abate KH; GBD 2015 Chronic Respiratory Disease Collaborators. Global, regional, and national deaths, prevalence, disability-adjusted life years, and years lived with disability for chronic obstructive pulmonary disease and asthma, 1990–2015: a systematic analysis for the Global Burden of Disease Study. Lancet Resp Med. 2017;5(9):691–706. doi:10.1016/S2213-2600(17)30293-X
- Blanco I, Diego I, Bueno P, Casas-Maldonado F, Miravitlles M. Geographic distribution of COPD prevalence in the world displayed by geographic information system maps. Eur Respir J. 2019;54(1):1900610. doi:10.1183/13993003.00610-2019
- Wang C, Xu J, Yang L, et al.; China Pulmonary Health Study Group. Prevalence and risk factors of chronic obstructive pulmonary disease in China (the China Pulmonary Health[CPH]study): a national cross-sectional study. Lancet. 2018;391(10131):1706–1717. doi:10.1016/S0140-6736(18)30841-9
- Løkke A, Lange P, Scharling H, Fabricius P, Vestbo J. Developing COPD: a 25 year follow up study of the general population. Thorax. 2006;61(11):935–939. doi:10.1136/thx.2006.062802
- Mannino DM, Buist AS. Global burden of COPD: risk factors, prevalence, and future trends. Lancet. 2007;370(9589):765–773. doi:10.1016/S0140-6736(07)61380-4
- Lin YZ, Zhong XN, Chen X, Liang Y, Zhang H, Zhu DL. Roundabout signaling pathway involved in the pathogenesis of COPD by integrative bioinformatics analysis. Int J Chron Obstruct Pulmon Dis. 2019;18(14):2145–2162. doi:10.2147/COPD.S216050
- Huang X, Li Y, Guo X, et al. Identification of differentially expressed genes and signaling pathways in chronic obstructive pulmonary disease via bioinformatic analysis. FEBS Open Bio. 2019;9(11):1880–1899. doi:10.1002/2211-5463.12719
- Spira A, Beane J, Pinto-Plata V, et al. Gene expression profiling of human lung tissue from smokers with severe emphysema. Am J Respir Cell Mol Biol. 2004;31(6):601–610. doi:10.1165/rcmb.2004-0273OC
- Morrow JD, Zhou X, Lao T, et al. Functional interactors of three genome-wide association study genes are differentially expressed in severe chronic obstructive pulmonary disease lung tissue. Sci Rep. 2017;7(1):44232. doi:10.1038/srep44232
- Chin CH, Chen SH, Wu HH, Ho CW, Ko MT, Lin CY. cytoHubba: identifying hub objects and sub-networks from complex interactome. BMC Syst Biol. 2014;8 Suppl 4(Suppl4):S11. doi:10.1186/1752-0509-8-S4-S11
- Langfelder P, Horvath S. WGCNA: an R package for weighted correlation network analysis. BMC Bioinform. 2008;9(1):559. doi:10.1186/1471-2105-9-559
- Yip AM, Horvath S. Gene network interconnectedness and the generalized topological overlap measure. BMC Bioinform. 2007;8(1):22. doi:10.1186/1471-2105-8-22
- Kuang L-J, Deng -T-T, Wang Q, et al. Dendritic cells induce Tc1 cell differentiation via the CD40/CD40L pathway in mice after exposure to cigarette smoke. Am J Physiol Lung Cell Mol Physiol. 2016;311(3):L581–L589. doi:10.1152/ajplung.00002.2016
- Mirza S, Clay RD, Koslow MA, Scanlon PD. COPD guidelines: a review of the 2018 GOLD report. Mayo Clin Proc. 2018;93(10):1488–1502. doi:10.1016/j.mayocp.2018.05.026
- Kong Y, Feng ZC, Zhang YL, et al. Identification of immune-related genes contributing to the development of glioblastoma using weighted gene co-expression network analysis. Front Immunol. 2020;11(11):1281. doi:10.3389/fimmu.2020.01281
- Morris MR, Ricketts C, Gentle D, et al. Identification of candidate tumour suppressor genes frequently methylated in renal cell carcinoma. Oncogene. 2010;29(14):2104–2117. doi:10.1038/onc.2009.493
- Li X, Zhou F, Jiang C, et al. Identification of a DNA methylome profile of esophageal squamous cell carcinoma and potential plasma epigenetic biomarkers for early diagnosis. PLoS One. 2014;9(7):e103162. doi:10.1371/journal.pone.0103162
- Guay SP, Brisson D, Mathieu P, Bossé Y, Gaudet D, Bouchard L. A study in familial hypercholesterolemia suggests reduced methylomic plasticity in men with coronary artery disease. Epigenomics. 2015;7(1):17–34. doi:10.2217/epi.14.64
- Duan J, Martinez M, Sanders AR, et al. Polymorphisms in the trace amine receptor 4 (TRAR4) gene on chromosome 6q23.2 are associated with susceptibility to schizophrenia. Am J Hum Genet. 2004;75(4):624–638. doi:10.1086/424887
- Xin X, Mains RE, Eipper BA. Monooxygenase X, a member of the copper-dependent monooxygenase family localized to the endoplasmic reticulum. J Biol Chem. 2004;279(46):48159–48167. doi:10.1074/jbc.M407486200
- Tsuneoka Y, Tsukahara S, Yoshida S, et al. Moxd1 is a marker for sexual dimorphism in the medial preoptic area, bed nucleus of the stria terminalis and medial amygdala. Front Neuroanat. 2017;11:26. doi:10.3389/fnana.2017.00026
- Han X, He J, Wang Z, Bai Z, Wang W, Li X. Monooxygenase DBH like 1 (MOXD1) knockdown suppresses the proliferation and xenograft tumor growth of osteosarcoma cells via inducing apoptosis. Panminerva Med. 2019;30. doi:10.23736/s0031-0808.19.03717-0
- Tei S, Ishii HT, Mitsuhashi H, Ishiura S. Antisense oligonucleotide-mediated exon skipping of CHRNA1 pre-mRNA as potential therapy for congenital myasthenic syndromes. Biochem Biophys Res Commun. 2015;461(3):481–486. doi:10.1016/j.bbrc.2015.04.035
- Shamseldin HE, Swaid A, Alkuraya FS. Lifting the lid on unborn lethal Mendelian phenotypes through exome sequencing. Genet Med. 2013;15(4):307–309.
- Fisher AG, Seaborne RA, Hughes TM, et al. Transcriptomic and epigenetic regulation of disuse atrophy and the return to activity in skeletal muscle. FASEB J. 2017;31(12):5268–5282. doi:10.1096/fj.201700089RR
- Zhang G, Thomas AL, Marshall AL, et al. Nicotinic acetylcholine receptor α1 promotes calpain-1 activation and macrophage inflammation in hypercholesterolemic nephropathy. Lab Invest. 2011;91(1):106–123. doi:10.1038/labinvest.2010.135
- Posey KL, Coustry F, Hecht JT. Cartilage oligomeric matrix protein: cOMPopathies and beyond. Matrix Biol. 2018;71–72:161–173. doi:10.1016/j.matbio.2018.02.023
- Huang Y, Xia J, Zheng J, et al. Deficiency of cartilage oligomeric matrix protein causes dilated cardiomyopathy. Basic Res Cardiol. 2013;108(5):374. doi:10.1007/s00395-013-0374-9
- Vuga LJ, Milosevic J, Pandit K, et al. Cartilage oligomeric matrix protein in idiopathic pulmonary fibrosis. PLoS One. 2013;8(12):e83120. doi:10.1371/journal.pone.0083120
- Magdaleno F, Arriazu E, Ruiz de Galarreta M, et al. Cartilage oligomeric matrix protein participates in the pathogenesis of liver fibrosis. J Hepatol. 2016;65(5):963–971. doi:10.1016/j.jhep.2016.06.003
- Liu TT, Liu XS, Zhang M, et al. Cartilage oligomeric matrix protein is a prognostic factor and biomarker of colon cancer and promotes cell proliferation by activating the Akt pathway. J Cancer Res Clin Oncol. 2018;144(6):1049–1063. doi:10.1007/s00432-018-2626-4
- Li Q, Wang C, Wang Y, et al. HSCs-derived COMP drives hepatocellular carcinoma progression by activating MEK/ERK and PI3K/AKT signaling pathways. J Exp Clin Cancer Res. 2018;37(1):231. doi:10.1186/s13046-018-0908-y
- Laudon J, Whittaker JL, Ren G, Jaremko JL, Emery CA, Krawetz RJ. Serum cartilage oligomeric matrix protein (COMP) expression in individuals who sustained a youth sport-related intra-articular knee injury 3–10 years previously and uninjured matched controls. Osteoarthritis Cartilage. 2019;27(2):286–293. doi:10.1016/j.joca.2018.09.011
- Bao Y, Wang L, Shi L, et al. Transcriptome profiling revealed multiple genes and ECM-receptor interaction pathways that may be associated with breast cancer. Cell Mol Biol Lett. 2019;24(1):38. doi:10.1186/s11658-019-0162-0
- Zou S, Li J, Yan J, Xu J, Lin M, Cao D. Distribution of serum Thrombospondin-2, a novel tumor marker, in general population and cancer patients in China. Clin Chim Acta. 2021;518:123–127. doi:10.1016/j.cca.2021.03.022
- Weng TY, Wang CY, Hung YH, Chen WC, Chen YL, Lai MD. Differential expression pattern of THBS1 and THBS2 in lung cancer: clinical outcome and a systematic-analysis of microarray databases. PLoS One. 2016;11(8):e0161007. doi:10.1371/journal.pone.0161007
- Eiro N, Carrión JF, Cid S, et al. Toll-like receptor 4 and matrix metalloproteases 11 and 13 as predictors of tumor recurrence and survival in stage II colorectal cancer. Pathol Oncol Res. 2019;25(4):1589–1597. doi:10.1007/s12253-019-00611-6
- Yang H, Jiang P, Liu D, et al. Matrix metalloproteinase 11 is a potential therapeutic target in lung adenocarcinoma. Mol Ther Oncolytics. 2019;14:82–93. doi:10.1016/j.omto.2019.03.012
- De Pasquale V, Pavone LM. Heparan sulfate proteoglycan signaling in tumor microenvironment. Int J Mol Sci. 2020;21(18):6588. doi:10.3390/ijms21186588
- Brandsma CA, Van den Berge M, Hackett TL, Brusselle G, Timens W. Recent advances in chronic obstructive pulmonary disease pathogenesis: from disease mechanisms to precision medicine. J Pathol. 2020;250(5):624–635. doi:10.1002/path.5364
- Uddin MN, Li M, Wang X. Identification of transcriptional signatures of colon tumor stroma by a meta-analysis. J Oncol. 2019;2(2019):8752862.
- Yang YW, Jablons DM, Lemjabbar-Alaoui H. Extracellular sulfatases as potential blood-based biomarkers for early detection of lung cancer. Exp Lung Res. 2021;47(6):261–279. doi:10.1080/01902148.2021.1885525
- Zhou Q, Jiang Y, Yin W, Wang Y, Lu J. Single-nucleotide polymorphism in microRNA-binding site of SULF1 target gene as a protective factor against the susceptibility to breast cancer: a case-control study. Onco Targets Ther. 2016;9:2749–2757. doi:10.2147/OTT.S102433
- Sahota AP, Dhoot GK. A novel SULF1 splice variant inhibits Wnt signalling but enhances angiogenesis by opposing SULF1 activity. Exp Cell Res. 2009;315(16):2752–2764. doi:10.1016/j.yexcr.2009.06.029
- Brunner C, Laumen H, Nielsen PJ, Kraut N, Wirth T. Expression of the aldehyde dehydrogenase 2-like gene is controlled by BOB.1/OBF.1 in B lymphocytes. J Biol Chem. 2003;278(46):45231–45239. doi:10.1074/jbc.M302539200
- Teitell MA. OCA-B regulation of B-cell development and function. Trends Immunol. 2003;24(10):546–553. doi:10.1016/j.it.2003.08.002
- Zhou H, Brekman A, Zuo WL, et al. POU2AF1 functions in the human airway epithelium to regulate expression of host defense genes. J Immunol. 2016;196(7):3159–3167. doi:10.4049/jimmunol.1502400
- Schiraldi M, Raucci A, Muñoz LM, et al. HMGB1 promotes recruitment of inflammatory cells to damaged tissues by forming a complex with CXCL12 and signaling via CXCR4. J Exp Med. 2012;209(3):551–563. doi:10.1084/jem.20111739
- Campana L, Bosurgi L, Bianchi ME, Manfredi AA, Rovere-Querini P. Requirement of HMGB1 for stromal cell-derived factor-1/CXCL12-dependent migration of macrophages and dendritic cells. J Leukoc Biol. 2009;86(3):609–615. doi:10.1189/jlb.0908576
- Hao W, Li M, Pang Y, Du W, Huang X. Increased chemokines levels in patients with chronic obstructive pulmonary disease: correlation with quantitative computed tomography metrics. Br J Radiol. 2021;94(1118):20201030. doi:10.1259/bjr.20201030
- Isles HM, Herman KD, Robertson AL, et al. The CXCL12/CXCR4 signaling axis retains neutrophils at inflammatory sites in Zebrafish. Front Immunol. 2019;10:1784. doi:10.3389/fimmu.2019.01784
- Barwinska D, Oueini H, Poirier C, et al. AMD3100 ameliorates cigarette smoke-induced emphysema-like manifestations in mice. Am J Physiol Lung Cell Mol Physiol. 2018;315(3):L382–L386. doi:10.1152/ajplung.00185.2018