Abstract
Background
The purpose of this study was to examine changes in the airway lumen and parenchyma in relation to lung function in patients with chronic obstructive pulmonary disease (COPD) compared with controls.
Methods
We studied 70 patients with COPD and 15 normal subjects. Using reconstructed computed tomography (CT) images, we traced the bronchial trees and reconstructed 3 cm circle images around the airways exactly perpendicular to the airway axis at the peripheral, middle, and central zones of the bronchi. We measured the number of airways and vessels, the airway inner diameter, and the area of emphysema in the circles, and analyzed the relationship of these image parameters to lung function.
Results
Reduced airway numbers and increased upper lobe emphysema were observed even in early spirometric stages in patients with COPD compared with controls. Other findings included decreased airway inner diameter in advanced spirometric stages. The numbers of peripheral zone bronchi, the extent of the middle zone emphysematous area, and the mean airway inner diameter of the airways were the best predictors of spirometric parameters. A portion of the airways in patients with COPD showed a loss of airway patency at middle or central zone bronchi predominantly in the late spirometric stages. Lumen-obliterated bronchial trees could be traced into emphysematous areas showing air trapping.
Conclusion
Compared with controls, our CT observations in patients with COPD showed that airway lumen and lung parenchyma changes along airways differed by spirometric stage, and these changes were associated with decreased lung function. A portion of CT-identified emphysema in patients with COPD appeared to be due to lumen-obliterated airways in the bronchial tree.
Introduction
Chronic obstructive pulmonary disease (COPD) is characterized by reduced airflow at forced expiration.Citation1 This airflow reduction may be caused by the loss of alveolar attachment to airways and the narrowing of the small airways, defined as 2 mm in diameter and characteristic of COPD.Citation2–Citation6 However, the reduced airflow in COPD may not be fully explained by structural changes in the small airways. The differences in the cross-sectional area between the central and peripheral airways cause airflow through the central airways to be rapid compared with that through the peripheral airways. Collapse of the central airways at expiration occurs easily in patients with COPD.Citation7 Therefore, the large airways might be also involved in the flow limitation associated with COPD. Recently, other structural changes, notably in the small airways, have been postulated as contributing to COPD pathology. McDonough et alCitation8 showed that the number of small airways was significantly reduced in patients with COPD. Computed tomography (CT) allows study of both emphysema and the small airways in COPD, and we sought to amplify on the studies of McDonough et al by looking at in vivo CT scan data in association with Global initiative for chronic Obstructive Lung Disease (GOLD) stages,Citation1 which is different from the in vitro lung slice CT scan data used by McDonough et al.
Based on recent pathologic concepts of COPD, we hypothesized that lung structures at different levels along the airways at rest (ie, airway numbers, airway diameter, and emphysema around airways) might correlate differently with reduced airflow at forced expiration.
In this study, we first evaluated airways from the level of the segmental bronchi to peripheral airways that were less than 1 mm in diameter by reconstructing the airway longitudinal structure with ultrahigh resolution (UHR) CT and noise reduction software (iDose4; Philips Healthcare, Cleveland, OH, USA). We then reconstructed a 3 cm circle around the airway perpendicular to the long axis at the peripheral, middle, and central zones of the airway in the right B1–B10 bronchial trees. We subsequently studied whether airway inner diameter (Di), low attenuation area, and numbers of airways and vessels in the circles at the three levels of bronchi were associated with different severity of airflow limitation in patients with COPD, and examined the relationship between these lung structures and spirometric parameters.
Materials and methods
Patients
The study was prospective, and consecutive patients with COPD who visited Saitama Cardiovascular and Respiratory Center (a tertiary referral hospital for respiratory disease with 315 beds) were recruited from March 1, 2012 to October 31, 2012. The institutional review board of Saitama Cardiovascular and Respiratory Center approved this study (2011002), and only patients who gave their written informed consent were included.
Since female patients with COPD make up less than 5% of the patients in our clinic, we studied male patients with COPD who underwent high-resolution CT for evaluation of emphysema. All patients were clinically stable at the time of the study. Exclusion criteria were a history of allergy, episodic wheeze, and high serum immunoglobulin E. The control group consisted of normal male patients who underwent chest high-resolution CT for minor chest abnormalities noted on chest radiographs.
Pulmonary function tests
Pulmonary function tests were performed with a CHESTAC-8800 (Chest MI Inc, Tokyo, Japan). Pulmonary function test data included measurements of forced vital capacity (FVC), forced expiratory volume in one second (FEV1), and maximum expiratory flow at 75% FVC (MEF75), 50% FVC (MEF50), and 25% FVC (MEF25). Methods and predicted values for spirometric measurements were derived from the guidelines for pulmonary function tests issued by the American Thoracic Society/European Respiratory Society and Japanese Respiratory Society.Citation9,Citation10 Spirometry was performed before and 30 minutes after inhalation of 200 μg of salbutamol, and the data obtained after inhalation of salbutamol were used for evaluation. Since CT scanning and pulmonary function tests were done in stable patients, the pulmonary function test results obtained within one month of the CT study were considered acceptable for the analysis.
CT data acquisition and reconstruction
A multislice (256 slices) CT scanner (Brilliance iCT; Philips Healthcare) was used. CT scans were acquired with the following parameters: a tube voltage of 120 kilovolts peak (kVp); a tube current-time product of 200 milliamperes per second (mAs); a detector configuration of 20 × 0.625 mm collimation with UHR mode; a reconstruction section thickness of 0.67 mm; helical mode with 0.55 pitch; gantry rotation time 0.4 seconds; and display field of view 200 mm. The radiation dose in our study protocol was about 11.2 mSv (conventional posterior-anterior and lateral chest X-ray is about 0.1 or 0.2 mSv).
UHR mode introduces a collimator in front of the detectors so that after the beam emerges from the patient, it is collimated before hitting the detectors. Collimators increase spatial resolution, but at the expense of lower dose efficiency because they absorb half of the photon flux before reaching the detectors. As a result, and because of the high-pass reconstruction kernel design, image noise was increased. All images were reconstructed from UHR data using an iterative reconstruction algorithm (iDose4).Citation11–Citation13 The iDose4 offers six levels of image noise reduction in the UHR mode. We selected the highest level (level 6) to obtain maximum noise reduction of almost 50%. Patients were asked to continue deep inspiration for a while and all scans were obtained immediately afterward. Reconstructed data were transferred to the workstation (Philips Healthcare), and then superimposed on a curved multiplanar reconstruction of the airways.
Analysis of airway structure
We measured lung structures in one airway for each of the ten segments in the right upper lobe (ie, B1b, B2b, and B3b), right middle lobe (ie, B4b and B5b), and right lower lobe (B6b, B7b, B8b, B9a, and B10b). Each bronchial tree was traced from the most peripheral point of the airway (within 2 cm of the pleura) to the entrance of the segmental bronchus. We designated the point in the airway 2 cm from the pleura as the peripheral zone, the point 2 cm from the entrance of the segmental bronchus as the central zone, and the point halfway between those two points as the middle zone. At each point, we reconstructed perpendicular images to the axis of the airway and placed a 3 cm circle with the selected airway in the center. In a preliminary study, we determined that the 3 cm circle was the largest circle that could be used to avoid overlapping circles in the central zone and to avoid chest wall, diaphragm, or pleura in the middle and peripheral zones. For this reason, we could select only one airway in each segment to examine in detail. Using a method previously reported, with minor modifications, the percentage of low attenuation area (%LAA) was calculated in the circle.Citation14–Citation16 The cutoff level between normal lung density and LAA was defined as −960 Hounsfield units. The numbers of airways, the numbers of arteries and veins, and the Di of the airway in the center of the circle were measured. Di of an obliterated airway was calculated as zero. Nodular structures and linear structures other than membranous structures (presumably interlobular septa) were considered vessels (ie, artery or veins). The peripheral point on the airway in each segment was determined by the consensus of two observers (KK, TH, TK, or MU). We independently reviewed all the CT data, such as counting of number of airways and vessels on the same acquired images. The mean values were calculated and used for this study.
Phantom study
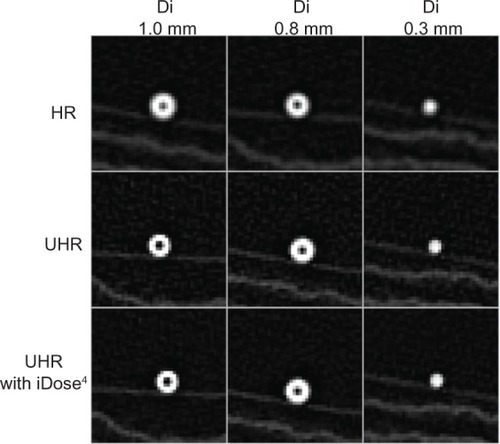
We performed validation analysis by using two phantoms (A and B) to test the software, as previously described.Citation17 Phantom A had a Di of 0.8 mm and a wall thickness of 0.7 mm. Phantom B had a Di of 1.0 mm and a wall thickness of 0.6 mm.
Statistical analysis
Demographic data were expressed as the mean (standard deviation), and values for each parameter are expressed as the mean (standard error). Analysis of variance with the Tukey–Kramer multiple comparison test was used to compare groups. Nonparametric comparison by segments was performed using the Kruskal–Wallis test. Linear regression analysis and stepwise multiple regression analysis were used to evaluate the relationship between CT parameters and outcomes of the pulmonary function tests. An intraclass correlation coefficient over 0.6 was considered acceptable for variability between observers and repeated measurements. Statistical significance was set at P<0.05.
Results
CT measurements and reconstructed lung airway images
Phantom study
Images of the two phantoms (A and B) and a reference phantom (Di of 0.3 mm) by high-resolution CT and by UHR CT with and without iDose4 software are shown in . Measurements were repeated three times for each phantom. The intraclass correlation coefficients were 0.76 and 0.62, respectively, for phantom A and phantom B. The results of the Di (0.8 mm) and wall thickness (0.7 mm) measurements of phantom A were 0.85±0.05 mm (mean coefficient of variation, 5.96%) and 0.71±0.03 mm (mean coefficient of variation, 4.06%). The results of Di (1 mm) and wall thickness (0.6 mm) for phantom B were 0.91±0.03 mm (mean coefficient of variation, 3.17%) and 0.59±0.04 mm (mean coefficient of variation, 6.06%), respectively. These data indicate that measurement of airway dimensions by the software is very accurate and reproducible for airways with a Di ≥0.8 mm.
Figure 1 Computed tomography images of phantoms by high-resolution CT, ultrahigh-resolution CT, and ultrahigh-resolution CT with iDose4 (Philips Healthcare) software.
Reconstructed lung airway images
shows how we reconstructed the longitudinal airway view and the view perpendicular to the airway axis compared with the conventional CT images. They show the relationships of one airway to other airways, lung vessels, and interlobular septa, many of which cannot be recognized on conventional CT images. shows definition of measurement points in a longitudinal image of the bronchial tree, and images exactly perpendicular to the airway axis at each point. An airway lumen of 0.8 mm was clearly identifiable.
Figure 2 Comparison of conventional view of ultrahigh-resolution CT, reconstructed longitudinal airway view, and perpendicular image of airway axis in two patients with chronic obstructive pulmonary disease. (A–C) Patient 1 and (D–F) patient 2.
Abbreviation: CT, computed tomography.
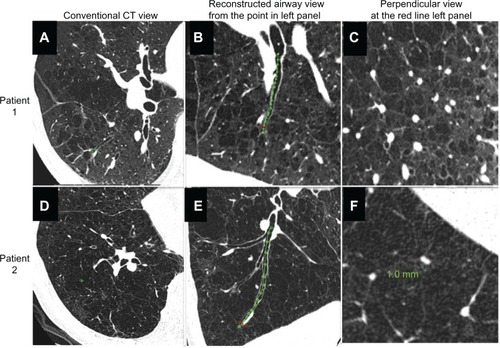
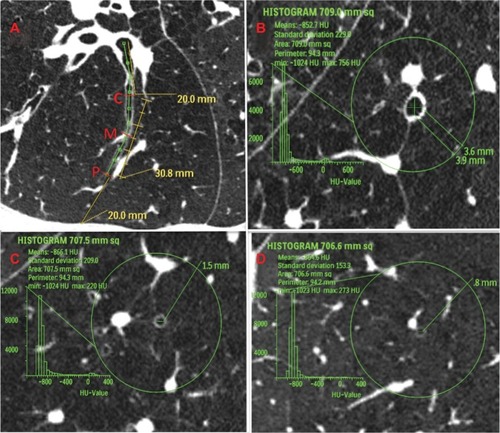
Figure 3 Definition of measurement area in computed tomography images of airways in patients with chronic obstructive pulmonary disease. (A) Longitudinal image of right B9a. Central zone (C) was defined as the point 2 cm from the entrance to the segmental bronchus; peripheral zone (P) was defined as the point 2 cm from the pleura; and middle zone (M) was defined as the point halfway between P and C. (B–D) Images exactly perpendicular to airway axis at each point (part B shows central zone; part C shows middle zone; and part D shows peripheral zone). The 3 cm circle indicates the selected airway. Within this circle, we measured the percentage of low attenuation area, number of bronchi, number of vessel structures, and the inner diameter of the center airway.
Patient demographic data and types of emphysema correlated with longitudinal airway structure
shows the patient demographic data. Overall, we studied a total of 700 airways in the 70 COPD patients and 150 airways in the 15 normal controls. In the course of the study, we found that there were two types of emphysema in regard to middle or central zone airway luminal patency. Panel A in shows an airway that was patent from the central zone to just beneath the pleura. All airways in normal subjects and 90.3% of the airways in patients with COPD (632/700 airways) were patent at the peripheral zone (2 cm from the pleura).
Table 1 Comparison of 70 male patients with COPD and 15 male controlsTable Footnotea
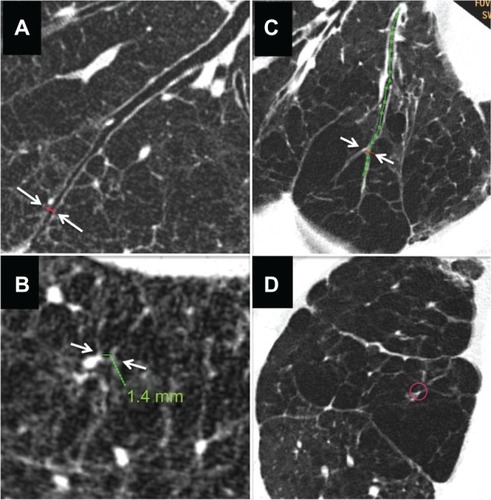
Figure 4 Computed tomography images of severe emphysema and airway lumen-obliterated emphysema. (A) Reconstructed image of longitudinal airway view of severe emphysema with little parenchyma around septum or vessels (arrows indicate the point where image B was reconstructed within 2 cm from pleura). (B) Reconstructed image of view exactly perpendicular image to airway axis at red line in panel A (arrows indicate the airway used for image reconstruction). Even in peripheral airway within 2 cm from the pleura airway lumens could be observed. Green line indicates the size of the airway. (C) Reconstructed image of longitudinal airway view of airway lumen-obliterated emphysema. The airway lumen is obliterated at the proximal levels of the bronchi (>2 cm apart from the surface of the lung), and subsegmental areas lacking parenchyma were observed. The obliterated bronchus could be traced into the air-trapped emphysematous area (arrows indicate the point where image D was reconstructed). (D) Reconstructed image of view exactly perpendicular to the long axis of the bronchus at the red line in panel C. Red circle indicates the airway which was used for image reconstruction.
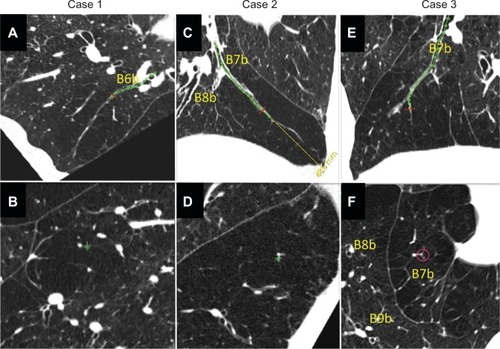
Airway luminal obliteration was found in 9.7% of the airways studied in patients with COPD (68/700 airways in 28/70 COPD patients) at the middle or central zone airway (>2 cm apart from the pleura) as shown in panel C of . Occlusion of the middle zone airways seemed to have a subsegmental distribution, the subpleural parenchyma was replaced by emphysema, and the lumen-obliterated airways could be traced into the emphysematous area. We labeled this type of emphysema as “airway lumen-obliterated emphysema”. More examples of airway lumen-obliterated emphysema are shown in .
Figure 5 Three cases of airway lumen-obliterated emphysema. (A, C and E) Reconstructed images of longitudinal airway view of airway lumen-obliterated emphysema. Red lines indicate the points where perpendicular images were reconstructed. (B, D and F) Reconstructed images of view exactly perpendicular image to airway axis at red lines in panel A, C, and E, respectively.
Lung structure and GOLD airflow limitation stages
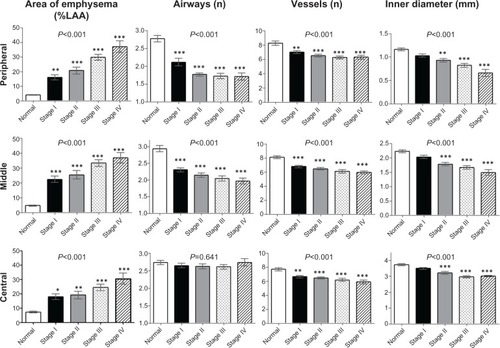
summarizes the lung structure measured in the right B1–B10 bronchi for all cases grouped by GOLD stage. Intraclass correlation coefficients for every image parameter between two observers were over 0.6. The upper limit of %LAA in normal subjects was 6.5%, 7.6%, and 11.9% for the peripheral, middle, and central zone, respectively. Each zone showed significantly high %LAA even in spirometric stage I of COPD. Reductions in airways and vessels at the peripheral and middle zones were observed even in the early stages of COPD, and there was little difference between GOLD spirometric stage II and stage IV. In contrast, the Di of the peripheral, middle, and central zone airways was smaller in advanced spirometric stages.
Figure 6 Percentage of low attenuation area, number of airways, number of vessels and airway inner diameter in patients with chronic obstructive pulmonary disease grouped by GOLD stage and compared with controls. Bar graphs show summaries of lung structures in the 3 cm circle around the selected bronchus measured in right B1 to B10 bronchi. Means and standard error bars are shown. The peripheral zone was defined as the point 2 cm from the pleura; the central zone was defined as the point 2 cm from the entrance to the segmental bronchus; the middle zone was designated as the point half-way between the peripheral and central zone. Analysis of variance was used to determine the overall difference among groups, and the Tukey–Kramer multiple comparison test was used to compare groups. Significances between the controls (normal) and each GOLD airflow limitation stage (I–IV) are shown. Asterisks indicate *P<0.05, **P<0.01, and ***P<0.001 compared with controls.
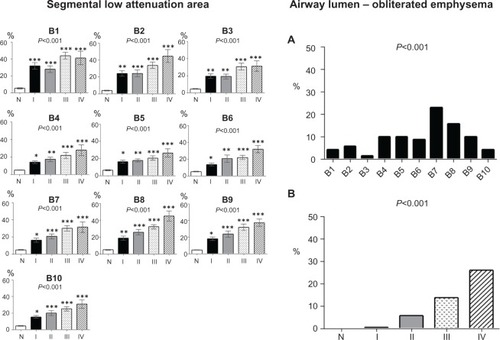
shows the segmental %LAA (left panels) and percentage of airway lumen-obliterated emphysema according to GOLD spirometric stages (right panels). Segmental emphysematous areas were high in segment 1 in all stages, but the %LAA in the lower lobe segments was also high in advanced spirometric stages. Airway lumen-obliterated emphysema was predominantly observed in the segments of lower lobe in the advanced spirometric stages.
Figure 7 Segmental low attenuation area by GOLD stage and percentages of airway lumen-obliterated emphysema by GOLD stage. (Left panels) The segmental low attenuation area (LAA) is a mean of the LAA in the peripheral, middle, and central zones of each bronchus. Analysis of variance with the Tukey–Kramer multiple comparison test was used to compare groups. Asterisks indicate *P<0.05; **P<0.01; and ***P<0.001 compared with controls. (Right panels) The percentage of airway lumen-obliterated emphysema in each segment (part A) and according to GOLD airflow limitation stages (part B) were significantly different with the Kruskal–Wallis test.
Relationship between lung structure and pulmonary function
All image parameters except the numbers of central zone airways were significantly associated with every spirometric parameter (). Stepwise multiple regression analysis of CT image parameters versus spirometric parameters showed that spirometric parameters were best predicted by the combination of middle zone emphysema, the number of airways in the peripheral zone, and the Di, including total zone area (mean of three levels) or central zone area (). However, correlation coefficients (r) were different among the spirometric parameters. The fast exhaled breath compartment, as expressed by FEV1 was largely predicted by total Di, whereas slow exhaled breath compartments, such as MEF50, was more predicted by middle zone emphysema and numbers of peripheral zone airways, and MEF25 was mostly predicted by numbers of peripheral zone airways.
Table 2 Relationships between airway dimensions and pulmonary function in COPD
Table 3 Standard regression coefficients and correlation coefficient (r values) of stepwise multiple regression analysis for PFTs
Discussion
In this study, we showed that airway numbers, airway diameter, and extent of emphysematous change as identified and measured on CT are all associated with spirometric parameters. Mean airway diameter of the three levels of bronchi, an emphysematous area at the middle zone, and number of peripheral airways were independent predictors of FEV1. Since FEV1 was not a sensitive marker for emphysema in this study, significant emphysema predominant in the upper lobe could be observed, even in early spirometric stages. In addition, the longitudinal airway view revealed a distinctive type of emphysema characterized by middle or central zone airway lumen obliteration and destruction of subsegmental parenchyma; this was found predominantly in the late spirometric stages.
Until recently, it has not been possible to observe an airway less than 1 mm in diameter with high-resolution CT directly. The current study used three technical modifications or enhancements to observe such airways directly in patients with COPD. The first was the use of a thin detector filter (0.39 × 0.39 mm matrix) to increase resolution (UHR mode). However, use of a thin detector filter reduces the signal level and enhances noise. Removal of this CT noise and motion noise by the heart was obtained by the second modification, which involved use of hybrid interactive reconstruction software (iDose4). The third and most important technical enhancement was the reconstruction of longitudinal airway images of select airways and perpendicular short-axis images at any airway level. By cutting the airway image exactly perpendicular to its long axis, we could observe and measure thin-walled airways less than 1 mm in diameter and the interlobular septa, structures that are not usually visible with conventional high-resolution CT.Citation18 In patients with emphysema, most of the peripheral zone airways, ie, those 2 cm from the pleura, were patent, and subpleural lung parenchyma was partially preserved between the airways and the pleura. Reconstructed longitudinal images of the airways revealed that interstitial tissue around the airways was preserved to varying extents and connected with lung vessels and airways in emphysematous lung tissue.
Airway resistance is well known to exist largely in the small airways of patients with COPD.Citation4,Citation19 Our results are not necessarily discordant with this, because airway resistance and airflow limitation at spirometry would reflect different lung structures. In addition, our data showed that the middle zone airways were not small airways in controls, but mean Di at the middle zone was less than 2 mm in advanced stages of COPD. Therefore, a considerable portion of the middle zone airways were small airways in this study.
Hasegawa et alCitation20 previously showed that the luminal area in the peripheral airways correlated more with FEV1 than the luminal area in the central airways. However, Hasegawa et al used a lower limit of peripheral airway diameter of 2 mm, which corresponds approximately to the middle zone in this study. In accordance with their data, our findings show that Di in the middle zone and in the peripheral zone correlate more with FEV1 than Di in the central zone (). Previous studies also compared dimensions of the airways by extent of airway generation.Citation17,Citation20,Citation21 Since the number of airway generations differs depending on the length of the pathway followed,Citation22 we analyzed peripheral, middle, and central zone airways as determined by distance from the pleura and entrance to the segmental bronchus, rather than by specific airway generation.
Nakano et alCitation23 reported that the airway wall of a single apical bronchus of the right upper lobe and total lung LAA predicted percent FEV1. Diaz et alCitation24 showed the relationship between FEV1 and a reduction in the number of airways in the right B1. In our study, we found that the fast exhaled breath compartment, as expressed by FEV1, correlated best with airway diameter, whereas the slow exhaled breath compartment, such as MEF50 and MEF25, correlated best with the extent of middle zone emphysema and number of peripheral airways. Because elastic recoil and speed of airflow are greatest near total lung capacity, airflow may become progressively more dependent on extent of emphysema and airway number as lung volume decreases. Recent studies have shown that the extent of emphysema in COPD is associated with COPD prognosis, the annual decline in FEV1, and systemic complications.Citation25–Citation27 However, our findings suggest that FEV1 may not be a sensitive marker for emphysema as detected on CT scan.
Our results suggest that there are two types of airway loss in COPD. One type is the actual disappearance of airways. Previously, McDonough et alCitation8 showed that the number of airways measuring 2.0–2.5 mm in diameter was reduced in patients with COPD. In addition to the disappearance of airways, we identified airways with complete luminal obliteration associated with surrounding emphysema (ie, airway lumen-obliterated emphysema). We identified this type of emphysema on longitudinal view of the airways. As seen on CT scans, in this type of emphysema, the middle or central zone airway has a gradually tapered inner lumen that eventually ends in a blind pouch. A luminal-obliterated airway may still be apparent as a line in the air-trapped emphysematous area, and is accompanied by destruction of the surrounding subsegmental parenchyma (ie, emphysema). Although not supported by direct pathologic data, the images imply that permanent proximal airway obliteration caused distal air trapping and destruction of the segmental parenchyma. Simple loss of airway patency could be observed due to mucus in the airway in COPD or bronchoconstriction in asthma. However, these situations can be reversible, differ on CT imaging, and are not accompanied by parenchymal destruction of the affected airway segments (images not shown). Our preliminary observation in only a few cases suggests that some of the airway lumen-obliterated emphysema had developed by one or 2 years after bronchopneumonia in patients with COPD (unpublished data). However, the mechanisms and clinical significance of this type of emphysema should be studied further in the future.
There are several limitations to this study that should be noted. Professional guidelines from the American Thoracic Society and European Respiratory Society state that quantifying the number of lung structures in two-dimensional images should accurately represent three-dimensional structures when special sampling and analytical strategies are used.Citation28 We set the two-dimensional area perpendicular to the airway axis for sampling. This might not represent all three-dimensional structures; however, it is an objective scheme that avoids bias at all three levels of the airway. Another limitation is that all the patients entered into this study were men. Finally, the pathology of airway lumen-obliterated emphysema is not clear; well preserved specimens are difficult to come by, and such a change would be difficult to examine pathologically because there is so little parenchyma around the remnant airways.
In conclusion, percent FEV1, a parameter of rapid expiration, is most associated with total zone airway diameter, and spirometric parameters during slow expiration are more associated with middle zone emphysema and the number of peripheral zone airways in patients with COPD. We showed that percent FEV1 is not a sensitive marker for severity of emphysema. Airway lumen-obliterated emphysema was observed predominantly in the advanced spirometric stages of COPD, and their pathologic nature and clinical significance need to be studied in the future.
Disclosure
The authors report no conflicts of interest in this work.
References
- Global initiative for chronic Obstructive Lung Disease (GOLD)Global Strategy for the Diagnosis, Management and Prevention of COPD Available from: http://www.goldcopd.org/Accessed June 7, 2012
- McNamaraJJCastileRGGlassGMFredbergJJHeterogenous lung emptying during forced expirationJ Appl Physiol (1985)198763164816573693201
- MeadJTurnerJMMacklemPTLittleJBSignificance of the relationship between lung recoil and maximum expiratory flowJ Appl Physiol196722951086017658
- HoggJCMacklemPTThurlbeckWMSite and nature of airway obstruction in chronic obstructive lung diseaseN Engl J Med1968278135513605650164
- Van BrabandtHCauberghsMVerbekenEMoermanPLauwerynsJMVan de WoestijneKPPartitioning of pulmonary impedance in excised human and canine lungsJ Appl Physiol Respir Environ Exerc Physiol198355173317426662764
- YanaiMSekizawaKOhruiTSasakiHTakishimaTSite of airway obstruction in pulmonary disease: direct measurement of intrabronchial pressureJ Appl Physiol (1985)199272101610231568955
- FraserRGMacklemPTBronchial dynamics in health and obstructive airway disease: physiology and roentgenologySimonMPotchenEJLeMayMFrontiers of Chest RadiologyNew York, NYCrune and Stratton1969
- McDonoughJEYuanRSuzukiMSmall-airway obstruction and emphysema in chronic obstructive pulmonary diseaseN Engl J Med20113651567157522029978
- MillarMRHankinsonJBrusascoVStandardisation of spirometryEur Respir J20052631933816055882
- Japanese Respiratory SocietyThe predicted values of spirometry and arterial blood gas analysis in JapaneseJ Jpn Respir Soc200139117 Japanese
- NoëlPBFingerleAARengerBMünzelDRummenyEJDobritzMInitial performance characterization of a noise-suppressing reconstruction algorithm for MDCTAJR Am J Roentgenol20111971404140922109296
- MiévilleFAGudinchetFBrunelleFBochudFOVerdunFRIterative reconstruction methods in two different MDCT scanners: physical metrics and 4-alternative forced-choice detectability experiments. A phantom approachPhys Med2013299910022217444
- RajiahPSchoenhagenPMehtaDLow-dose, wide-detector array thoracic CT angiography using an iterative reconstruction technique results in improved image quality with lower noise and fewer artifactsJ Cardiovasc Comput Tomogr2012620521322612906
- SakaiNMishimaMNishimuraKItohHKunoKAn automated method to assess the distribution of low attenuation areas on chest CT scans in chronic pulmonary emphysema patientsChest1994106131913257956377
- NakanoYSakaiHMuroSComparison of low attenuation areas on CT between inner and outer segments of the lung in COPD patients: incidence and contribution to lung functionThorax19995438438910212100
- MishimaMOkuYKawakamiKQuantitative assessment of the spatial distribution of low attenuation areas on X-ray CT using texture analysis in patients with chronic pulmonary emphysemaFront Med Biol Eng1997819349083798
- KurashimaKHoshiTTakayanagiNAirway dimensions and pulmonary function in chronic obstructive pulmonary disease and asthmaRespirology201217798621883679
- WebbWRMullerNLNaidichDPHigh-Resolution CT of the Lung4th edPhiladelphia, PALippincott Williams and Wilkins, Wolters Kluwer Health2009
- MurguSDColtHGExpiratory central airway collapse: a concise reviewEgyptian Journal of Bronchology200718796
- HasegawaMNasuharaYOnoderaAirflow limitation and airway dimensions in chronic obstructive pulmonary diseaseAm J Respir Crit Care Med20061731309131516556695
- MatsuokaSKuriharaYYagihashiKHoshinoMNakajimaYAirway dimensions at inspiratory and expiratory multisection CT in chronic obstructive pulmonary disease: correlation with airflow limitationRadiology20082481042104918710993
- WeibelERThe Morphometry of the LungNew York, NYNew York Academic Press1963
- NakanoYMuroSSakaiHComputed tomographic measurements of airway dimensions and emphysema in smokers. Correlation with lung functionAm J Respir Crit Care Med20001621102110810988137
- DiazAAValimCYamashiroTAirway count and emphysema assessed by chest CT imaging predicts clinical outcome in smokersChest201013888088720558554
- HarunaAMuroSNakanoYCT scan findings of emphysema predict mortality in COPDChest201013863564020382712
- NishimuraMMakitaHNagaiKHokkaido COPD Cohort Study InvestigatorsAnnual change in pulmonary function and clinical phenotype in chronic obstructive pulmonary emphysemaAm J Respir Crit Care Med2012185445222016444
- OharaTHiraiTMuroSRelationship between pulmonary emphysema and osteoporosis assessed by CT in patients with COPDChest20081341244124918641115
- American Thoracic Society/European Respiratory SocietyStandards for quantitative assessment of lung structureAm J Respir Crit Care Med201018139441820130146