

Abstract
Two replicate, multicenter, randomized, double-blind, placebo-controlled, parallel-group, Phase III studies investigated the long-term efficacy and safety of once-daily olodaterol via Respimat® versus placebo and formoterol over 48 weeks in patients with moderate to very severe chronic obstructive pulmonary disease receiving usual-care background therapy. Patients received once-daily olodaterol 5 or 10 μg, twice-daily formoterol 12 μg, or placebo. Co-primary end points were forced expiratory volume in 1 second (FEV1) area under the curve from 0–3 hours response, FEV1 trough response, and Mahler transition dyspnea index total score after 24 weeks; secondary end points included St George’s Respiratory Questionnaire. Overall, 904 (Study 1222.13) and 934 (Study 1222.14) patients received treatment. Olodaterol significantly improved FEV1 area under the curve from 0–3 hours versus placebo in both studies (with olodaterol 5 μg, 0.151 L and 0.129 L; with olodaterol 10 μg, 0.165 L and 0.154 L; for all comparisons P<0.0001) and FEV1 trough responses versus placebo (0.053–0.085 L; P<0.01), as did formoterol. Primary analysis revealed no significant difference in transition dyspnea index focal score for any active treatment versus placebo. Post hoc analysis using pattern mixture modeling (accounting for discontinuations) demonstrated statistical significance for olodaterol versus placebo. St George’s Respiratory Questionnaire total score was significantly improved with olodaterol, but not formoterol, versus placebo. No safety signals were identified from adverse-event or other safety data. Once-daily olodaterol 5 μg and 10 μg is efficacious in patients with moderate to very severe chronic obstructive pulmonary disease on usual-care maintenance therapy, with a satisfactory safety profile.
Supplementary materials
Figure S1 Hierarchical testing model.
Abbreviations: FEV1, forced expiratory volume in 1 second; AUC0–3, area under the curve from 0–3 hours; TDI, transition dyspnea index; SGRQ, St George’s Respiratory Questionnaire.
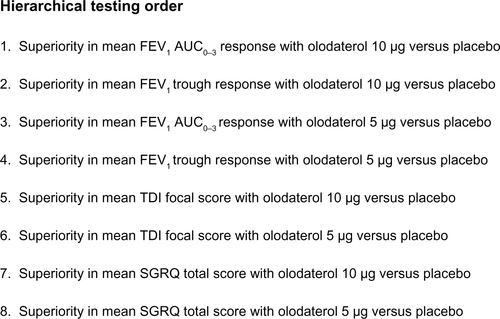
Figure S2 FEV1 profile after 24 weeks of treatment.
Notes: (A) Study 1222.13, day 1. (B) Study 1222.13, day 169. (C) Study 1222.14, day 1. (D) Study 1222.14, day 169.
Abbreviation: FEV1, forced expiratory volume in 1 second.
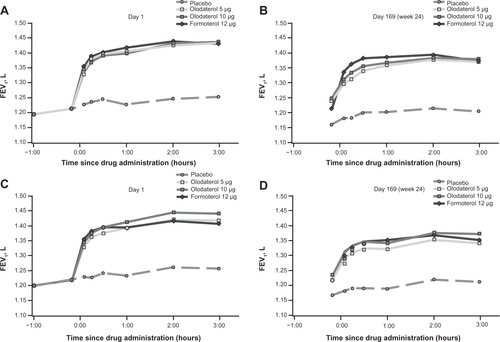
Figure S3 FEV1 AUC0–3 response (A) and trough FEV1 response (B) over 48 weeks of treatment, combined data set.
Abbreviations: FEV1, forced expiratory volume in 1 second; AUC0–3, area under the curve from 0–3 hours.
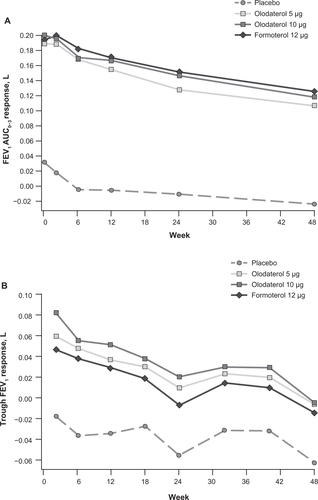
Figure S4 Adjusted mean SGRQ total score over 48 weeks of treatment, combined data set: MMRM (A) and PMM (B) analyses.
Abbreviations: SGRQ, St George’s Respiratory Questionnaire; MMRM, mixed model for repeated measurements; PMM, pattern mixture modeling.
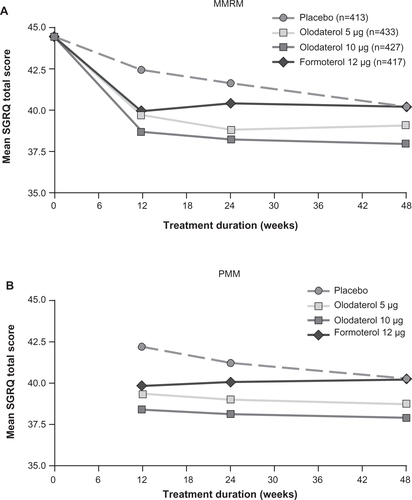
Table S1 Additional considerations for the statistical analyses
Table S2 Adjusted mean FEV1 responses at key time points
Table S3 Adjusted mean FVC responses at key time points
Table S4 Adjusted mean FEV1 responses at key time points in tiotropium and non-tiotropium strata (combined data)
Table S5 Adjusted mean (SE) Mahler TDI over 48 weeks
Table S6 Responder analysis for Mahler TDI focal scores after 24 weeks (combined data)
Table S7 Responder analysis for SGRQ total scores after 24 weeks (combined data)
Disclosure
The authors meet criteria for authorship as recommended by the International Committee of Medical Journal Editors. They take full responsibility for the scope, direction, content of, and editorial decisions relating to, the manuscript, were involved at all stages of development, and have approved the submitted manuscript. The authors received no compensation related to the development of the manuscript. This work was supported by Boehringer Ingelheim Pharma GmbH & Co. KG. Medical writing assistance was provided by Caitlin Watson, PhD, of Complete HealthVizion, which was contracted and compensated by Boehringer Ingelheim Pharma GmbH & Co. KG.