

Abstract
Background
Excluding the tropics, exacerbations of chronic obstructive pulmonary disease (COPD) are more frequent in winter. However, studies that directly relate hospitalizations for exacerbation of COPD to ambient temperature are lacking. The aim of this study was to assess the influence of temperature on the number of hospitalizations for COPD.
Methods
This was a population-based study in a metropolitan area. All hospital discharges for acute exacerbation of COPD during 2009 in Barcelona and its metropolitan area were analyzed. The relationship between the number of hospitalizations for COPD and the mean, minimum, and maximum temperatures alongside comorbidity, humidity, influenza rate, and environmental pollution were studied.
Results
A total of 9,804 hospitalization discharges coded with COPD exacerbation as a primary diagnosis were included; 75.4% of cases were male with a mean age of 74.9±10.5 years and an average length of stay of 6.5±6.1 days. The highest number of admissions (3,644 [37.2%]) occurred during winter, followed by autumn with 2,367 (24.1%), spring with 2,347 (23.9%), and summer with 1,446 (14.7%; P<0.001). The maximum, minimum, and mean temperatures were associated similarly with the number of hospitalizations. On average, we found that for each degree Celsius decrease in mean weekly temperature, hospital admissions increased by 5.04% (r2=0.591; P<0.001). After adjustment for humidity, comorbidity, air pollution, and influenza-like illness, only mean temperatures retained statistical significance, with a mean increase of 4.7% in weekly admissions for each degree Celsius of temperature (r2=0.599, P<0.001).
Conclusion
Mean temperatures are closely and independently related to the number of hospitalizations for COPD.
Supplementary materials
Method for calculating ICQA
Based on the concentration of pollutants listed in Table S1, the lowest level (worst air quality) of O3, PM10, CO, SO2, and NO2 was selected. The mean average of all the pollutants is considered the daily ICQA.
Figure S1 Method for calculating ICQA.
Note: Government of Catalonia. Department of Planning and Sustainability. Environment and Sustainability.Citation1
Abbreviation: ICQA, Catalonian Air Quality Index.
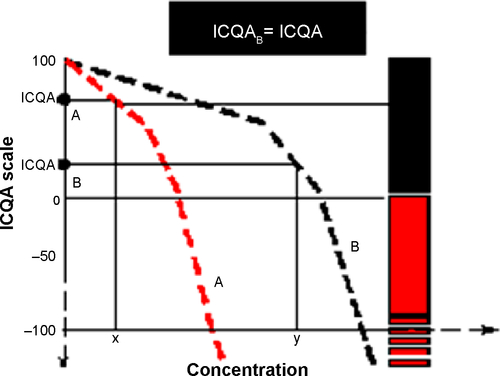
Table S1 List of emission levels/ICQA for different pollutants
Reference
- What is the Index Catalan Air Quality? [webpage on the website]Government of Catalonia (Generalitat de Catalunya) [updated 2013]. Available from: http://mediambient.gencat.cat/ca/05_ambits_dactuacio/atmosfera/qualitat_de_laire/avaluacio/icqa/que_es_lindex_catala_de_qualitat_de_laire/Accessed June 20, 2014
Acknowledgments
We thank Tom Yohannan for his editorial assistance with this paper.
Disclosure
The authors report no conflicts of interest in this work.