
 ?Mathematical formulae have been encoded as MathML and are displayed in this HTML version using MathJax in order to improve their display. Uncheck the box to turn MathJax off. This feature requires Javascript. Click on a formula to zoom.
Abstract
Purpose
Health utilities are widely used in health economics as a measurement of an individual’s preference and show the value placed on different health states over a specific period. Thus, health utilities are used as a measure of the benefits of health interventions in terms of quality-adjusted life years. This study aimed to determine the demographic and clinical variables significantly associated with health utilities for chronic obstructive pulmonary disease (COPD) patients.
Patients and methods
This was a multicenter, observational, cross-sectional study conducted between October 2012 and April 2013. Patients were aged ≥40 years, with spirometrically confirmed COPD. Utility values were derived from the preference-based generic questionnaire EQ-5D-3L applying weighted Spanish societal preferences. Demographic and clinical variables associated with utilities were assessed by univariate and multivariate linear regression models.
Results
Three hundred and forty-six patients were included, of whom 85.5% were male. The mean age was 67.9 (standard deviation [SD] =9.7) years and the mean forced expiratory volume in 1 second (%) was 46.2% (SD =15.5%); 80.3% were former smokers, and the mean smoking history was 54.2 (SD =33.2) pack-years. Median utilities (interquartile range) were 0.81 (0.26) with a mean value of 0.73 (SD =0.29); 22% of patients had a utility value of 1 (ceiling effect) and 3.2% had a utility value lower than 0. The factors associated with utilities in the multivariate analysis were sex (beta =-0.084, 95% confidence interval [CI]: −0.154; -0.013 for females), number of exacerbations the previous year (−0.027, 95% CI: −0.044; -0.010), and modified Medical Research Council Dyspnea Scale (mMRC) score (−0.123 [95% CI: −0.185; −0.061], −0.231 [95% CI: −0.301; −0.161], and −0.559 [95% CI: −0.660; −0.458] for mMRC scores 2, 3, and 4 versus 1), all P<0.05.
Conclusion
Multivariate analysis showed that female sex, frequent exacerbations, and an increased level of dyspnea were the main factors associated with reduced utility values in patients with COPD.
Introduction
Chronic obstructive pulmonary disease (COPD) is a highly prevalent and progressive respiratory disease.Citation1 Although mortality for COPD is decreasing in developed countries,Citation2 it remains a major cause of morbidity and mortality worldwide.Citation1 Up to 10.2% of adults aged 40–80 years are affected by COPD in Spain,Citation3 and individuals with COPD experience significant impairment in health-related quality of life (HRQL).Citation4
Health utility is a measurement of an individual’s preference that shows the value placed on different health states over a specific period. Health utilities are generally measured on a scale of 0–1, with 0 reflecting states of health equivalent to death and 1 reflecting the best possible health status, but sometimes negative values can be obtained, reflecting health states deemed worse than death.Citation5 Health utilities can help us to understand the impact of diseases on HRQL and are widely used in health economics, as they provide information for clinicians, managers, and other decision-makers on the individual’s preferences given to certain health states.Citation6 Health utilities also allow measuring of the benefits of health interventions in terms of quality-adjusted life years, and are an essential parameter in cost–utility analyses, which are the recommended type of economic evaluation.Citation7 Another advantage of health utilities is that they allow comparisons between different diseases.Citation5
In daily clinical practice, the most common instruments for estimating health utilities are preference-based generic HRQL questionnaires, of which the EuroQol-5D (EQ-5D) is the most widely used.Citation8 Furthermore, the EQ-5D questionnaire is recommended by health technology assessment bodies like the National Institute for Health and Care Excellence and the Haute Autorité de Santé.Citation6,Citation9
Various international and Spanish studies have estimated utilities in COPD.Citation3,Citation10–Citation18 However, information on the factors that influence the estimation of utilities in COPD is scarce. Therefore, our objective was to identify the demographic and clinical variables associated with utilities in patients with COPD.
Materials and methods
This was a multicenter, observational, cross-sectional study including COPD patients recruited between October 2012 and April 2013 from 15 Spanish hospitals with the objective of estimating utilities associated with COPD. More information about study design is detailed in a previous manuscript, wherein we reported utilities stratified by different COPD staging systems.Citation18 The study was approved by the Clinical Research and Ethics Committee of Hospital Clinic (Barcelona, Spain), and all patients gave written informed consent to participate.
Study population
Patients of both sexes, aged ≥40 years, with a diagnosis of COPD confirmed by spirometry (post-bronchodilator forced expiratory volume in 1 second [FEV1]/forced vital capacity <0.70 and FEV1 <80%) were included. All patients who attended a scheduled outpatient visit and fulfilled the inclusion/exclusion criteria were recruited consecutively by the investigator of each center until the number of patients required had been obtained. In addition, patients had to have been in a stable state for the previous 2 months (no exacerbations, hospitalizations, or changes in treatment), and be current or former smokers. Patients with other respiratory diseases, advanced cancer (with no possibility of remission), terminal patients or those receiving palliative care, and patients with cognitive impairment unable to understand or complete the informed consent form and questionnaires were excluded.
The sample size was determined by the primary objective that was to determine utilities in stable COPD patients stratified by lung function, as described previously.Citation18
Data collection and measurements
The main demographic and clinical variables were collected using a case report form specifically designed for the study. Pre- and post-bronchodilator lung function data were obtained from spirometric testing (last measurement performed in the previous 12 months or, if not available, performed during the inclusion visit).
Comorbidities were evaluated using the Charlson comorbidity index, which predicts 10-year mortality for a patient who may have a range of comorbid conditions.Citation19 In addition, each patient completed the EQ-5D-3L questionnaire as well as the COPD Assessment Test (CAT)Citation20 and the modified Medical Research Council Dyspnea Scale (mMRC)Citation21 to assess patient symptomatology.
EQ-5D-3L is a preference-based generic HRQL questionnaire consisting of five dimensions relating to health (mobility, self-care, usual activities, pain/discomfort, and anxiety/depression). Each dimension is divided into three levels of functioning (no problems, some problems, and extreme problems). Respondents are asked to describe their health status by ticking off one level of functioning for each of the five dimensions, generating up to 243 different health states. The questionnaire also includes a visual analog scale in which respondents are asked to value their overall health status on a scale from 0 (worst imaginable health state) to 100 (best imaginable health state).Citation8
CAT is a COPD-specific questionnaire that measures the impact of the disease on HRQL and allows symptoms to be described. It evaluates the following symptoms: ongoing cough, breathlessness, wheezing, chest tightness, impairment in daily activities, confidence, quality of sleep, and energy. CAT scores range from 0 to 40, with 0 representing the lowest impact on HRQL and 40 the maximum impact.Citation20
mMRC measures the impact of dyspnea on the activities of daily living. The score ranges from 0 (no dyspnea) to 4 (dyspnea preventing the patient leaving home or which appears with activities such as dressing or undressing).Citation21
Statistical analysis
In the univariate descriptive analysis, quantitative variables were described using means and standard deviations and medians and interquartile ranges. Categorical variables were described as absolute frequencies and percentages.
Utilities were derived from EQ-5D-3L scores by applying weighted Spanish societal preferences using the following formula:Citation22
To determine the association between demographic and clinical variables and utility, bivariate analyses were made using nonparametric tests (Kruskal–Wallis and Mann–Whitney U-tests for categorical variables and Kendall’s tau and Spearman’s rho for quantitative variables) due to the strong asymmetry of the utility values.Citation11,Citation12
Additionally, to determine the contribution of each of the variables, a multivariate linear regression model with utility values as dependent variable was developed based on the results of the bivariate analyses and on the clinical criterion and interest of each variable. Coding of variables was, in general, established in previous analyses, although some variables were recoded to provide practical information in the clinical context. In the case of categorical variables, the category with the highest representation was used as the reference group to obtain greater precision at baseline level. For each of the candidate variables to be entered in the multivariate model, a univariate linear regression model was fitted in order to compare the raw effects with the adjusted effects obtained in the multivariate regression. The interactions between variables were explored, but, finally, only the main effects were considered, in order to obtain a parsimonious model that was easy to use and interpret.
The model was fitted by stepwise forward regression, adding variables according to the t-statistic and the corresponding P-value, and establishing the input and output thresholds of variables as 0.05. As recommended by Brazier et al the performance of the final model was evaluated using the mean error, the mean absolute error, the mean absolute percentage error, and the root mean square error (see EquationEquations S1(S1) –EquationS4
(S4) ).Citation23 These goodness-of-fit indicators were calculated for the entire range of utilities and for intervals in order to evaluate the behavior of the model throughout the range of utilities.
Statistical significance was established as alpha =0.05. The analyses were performed using the R version 3.1.0 statistical package.Citation24
Results
A total of 358 patients were recruited, of whom 346 met all the selection criteria and were included in the final analysis. shows the characteristics of the study population.
Table 1 Characteristics of the study population
The mean utility obtained from EQ-5D-3L was 0.73 (standard deviation =0.29) and the median was 0.81 (interquartile range =0.26). The range of utilities observed was −0.482 to 1 (), and 22% of patients had a utility value equal to 1 (“ceiling effect”), which was reflected in a strong asymmetry in the distribution of utility values, where 8.1% of patients had a utility lower than 0.2, representing very poor HRQL, and 3.2% had a utility lower than 0, signifying a health status worse than death.
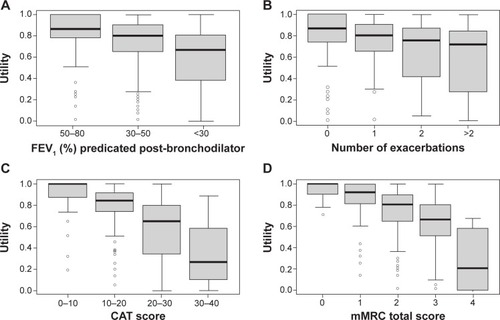
The bivariate analyses found no significant association between utility and age, smoking status, total packs-years, time since diagnosis, body mass index (BMI), the presence of comorbidities, or Charlson index (). However, a statistically significant association was found between utilities and sex, time since diagnosis, lung function, positive bronchodilator test, history of exacerbations, and CAT and mMRC scores. Utilities were significantly higher in males than in females (median 0.82 versus 0.74, P=0.002) and in patients with milder disease (P<0.001), and showed a positive association with lung function (Kendall’s tau =0.24, P<0.001, and Spearman’s rho =0.34, P<0.001). shows the box plot of utilities stratified by disease severity and illustrates that utility values decreased as lung function declined (P<0.001; all pairwise comparisons were statistically significant). In addition, utility values were significantly higher in patients with a positive bronchodilator test (median 0.89 versus 0.81, P=0.02). Patients without exacerbations had significantly higher utility values than patients with one or more exacerbations in the previous year (median 0.87 versus 0.78, P<0.001). This association was also observed when the utility values of patients with less than two exacerbations and those with two or more were compared (median 0.84 versus 0.74, P<0.001) (). Utility values were also significantly associated with both CAT (P<0.001) and mMRC (P<0.001) scores, with the lowest utility values in those patients with more symptoms and with more severe dyspnea (; ).
Table 2 Bivariate analysis: association between study variables and utility values
Figure 1 Utilities by (A) FEV1 (%) predicted post-bronchodilator, (B) exacerbations, (C) CAT score, and (D) mMRC score.
Abbreviations: CAT, COPD Assessment Test; FEV1, forced expiratory volume in 1 second; mMRC, modified Medical Research Council Dyspnea Scale.
The multivariate analysis included the variables age, sex, smoking status, time since diagnosis, BMI, the most frequent comorbidities, Charlson index, lung function measured as FEV1 predicted post-bronchodilator (continuous), positive bronchodilator test, number of exacerbations, and mMRC score. The CAT score was not included in the multivariate analysis, due to the fact that this is a questionnaire designed to measure the impact of COPD on a patient’s life and due to its correlation with the EQ-5D questionnaire.
The final fitted linear regression model included sex, the number of exacerbations, and mMRC score (), and it explained approximately 38% of the variability in utility values (R2=0.384). Of the variables included, the mMRC score had the greatest influence on the adjusted utilities in the model. The expression of the final fitted multivariate linear model detailing the calculation of the utility values adjusted by the model is shown (see EquationEquation S5(S5) ). The mean error was −1.1·10−18, ranging from −0.4169 for utilities below 0.5 to 0.0704 for utilities above 0.5. The mean absolute error was 0.1649, being 0.4333 for utilities below 0.5 and 0.1195 for utilities above 0.5. The overall root mean square error was 0.2294, being 0.4811 and 0.1497 for utilities below and above 0.5, respectively.
Table 3 Factors associated with utility values in the univariate and multivariate linear regression analyses
Comparison of the adjusted effects (obtained in the multivariate model) with the raw effects (observed in the univariate models) showed that the difference in utilities between males and females (raw effect =−0.147 [95% CI: −0.233, −0.060]) was reduced when the other factors were included in the multivariate linear model (adjusted effect =−0.084 [−0.154, −0.013]). The magnitude of the effect associated with the number of exacerbations was also reduced (raw effect =−0.067 [−0.086, −0.048], adjusted affect =−0.027 [−0.044, −0.010]). Nevertheless, the effects of dyspnea measured with the mMRC score remained about the same ().
Discussion
This study assessed HRQL, measured in terms of utility, in patients with stable COPD, and studied the relationship between the main demographic and clinical characteristics and utility values in order to show the impact of the disease and its main features on the self-perceived health status of patients.
The mean utility value obtained was 0.73, similar to the 0.69 obtained in a previous large study of 4,574 Spanish COPD patients,Citation15 but showed a significant reduction of 0.14 (P<0.001) compared to values for the current Spanish population of the same age range.Citation25 In a Spanish epidemiological population-based study, patients identified as having COPD had a mean utility value of 0.86, which rose to 0.90 in patients without a previous diagnosis of COPD, exactly the same value as control subjects from 40 to 80 years, but was reduced to 0.77 in patients with a previous diagnosis of COPD.Citation3 These values are also similar to those reported in international studies such as the Understanding the Potential Long-term Impacts on Function with Tiotropium trial (UPLIFT), wherein the mean utility value was 0.76, with significantly lower values in patients with more severe airflow limitation (from 0.79 in stage II to 0.65 in stage IV [Global initiative for chronic Obstructive Lung Disease stages]).Citation12 While most studies have found a weak relationship between low FEV1 and impaired HRQL,Citation25,Citation26 studies specifically designed to evaluate the association between utility values and FEV1 found a statistically significant association.Citation11,Citation12 We also observed lower utility values in more severe patients in previously published research,Citation18 but impairment in FEV1 did not remain as a predictor of impairment in utilities when other health determinant factors were taken into account in the multivariate analysis.
Variables significantly associated with utility scores in the multivariate analysis were sex, history of exacerbations in the previous 12 months, and the level of dyspnea. Worse utility values were found in females, as previously described in both the general population and in COPD patients.Citation16,Citation25,Citation27–Citation29 The utility values observed were 0.82 for males and 0.74 for females, similar to the 0.78 and 0.69 observed, respectively, in another large Spanish study.Citation16 Moreover, studies in COPD showed that clinical and physiological variables associated with HRQL, measured by the St George’s Respiratory Questionnaire (which is specifically for COPD), also differed between males and females.Citation28
Both dyspnea and the history of exacerbations have been reported to be two of the variables with the greatest impact on HRQL in COPD patients. The systematic review by Tsiligianni et al found that the factor that most determined HRQL was dyspnea, which was strongly negatively associated with the health status and had the highest correlations with health status questionnaires.Citation26 Likewise, studies by Miravitlles et al and Villar et al found a strong association between dyspnea and HRQL.Citation30,Citation31 Dyspnea is the starting point of a vicious circle that involves reduced physical activity and a poor health status, and which is linked to poor outcomes, such as an increased risk of hospitalization and mortality.Citation32,Citation33 A significant relationship has been found between mean time walked per day by COPD patients and utility scores, increasing from 0.49 in patients walking <30 minutes per day, to 0.66 in those walking between 30 and 60 minutes and 0.76 for those who walked >60 minutes per day (P<0.001).Citation34 In fact, utility scores were one of the three factors significantly associated with physical activity, together with the severity of COPD and the presence of depression.Citation34
The history of exacerbations has also been reported to be associated with HRQL,Citation35–Citation37 and has been described as a double effect, with worsening HRQL acting as a marker of the risk of exacerbations and more frequent hospital admissions which, in turn, affect HRQL.Citation36 In fact, utilities are significantly affected by exacerbations. In a study on 346 patients with an exacerbation of COPD, the mean utility value at the onset of the exacerbation was 0.54, rising to 0.61 at 1-month follow-up.Citation14 Interestingly, utility values at onset were a marker of the evolution of the exacerbation, with significantly worse scores in those patients who failed the treatment of the exacerbation compared with those who recovered (0.48 versus 0.57, P=0.002). Eventually, worse utility values would also identify those patients with a high health care resource utilization.Citation38
The multivariate linear model explained 38% of the variability in utility values; this percentage is similar to that found in previous multivariate analyses. Bentsen et al found that the variables analyzed explained 49.6% of the variability in reported HRQL using generic questionnaires and 19.2% when a specific questionnaire was used.Citation39 The goodness-of-fit indicators of the model show that the model predictions are more accurate for high utility values, ie, for good and/or moderate health states. Even so, the values found are within the range of values from similar models, showing that the model behaves at least as well as similar reported models.Citation23
Other variables showed an association with utility scores in the bivariate, but not in the multivariate, analysis. This was the case with low BMI, which was not significant in the multivariate analysis, probably due to the unexpected low number of patients with low BMI in our population. Similarly, another study has found an association between utility values and comorbidities, mainly heart disease and depression.Citation40 Our results did not show this association, even though patients with cardiovascular disease had a lower utility value than those without, probably due to the lack of power in the hypothesis testing.
A strong association has been found between utilities and CAT scores.Citation41 Our results confirm the value of the CAT questionnaire in the evaluation of the impact of COPD and justify its exclusion from the variables included in the multivariate analysis, since both scales measure the impact of COPD on a patient’s life. Moreover, we wanted to investigate the demographic and clinical characteristics associated with utilities and, therefore, we did not consider the inclusion of another health status questionnaire in the model.
The results of this study are relevant to the understanding of the impact of COPD on HRQL for two main reasons. First, the identification of variables that impact on HRQL may allow the incorporation of changes in the clinical management of patients with stable COPD. Second, utility values are an essential parameter in economic evaluations, specifically in cost–utility analyses in which effectiveness is measured in quality-adjusted life years. Determination of both the utility value and the influence of different variables on it may help build more accurate models for economic evaluation.
Some limitations of the study may have influenced the results. First, in the study design, the sample size calculation was designed for the primary objective of the study that was to estimate the association between utility and lung function impairment. For this reason, the power of the sample to determine other associations may be limited, particularly in the multivariate analysis, in which the impact of several factors was evaluated simultaneously. Second, patients with mild COPD were not included and, therefore, the results cannot be extrapolated to this group of patients. Similarly, in order to obtain utility estimates without the impact on quality of life of current exacerbations, we only included patients who were in a stable state during the previous 2 months. Hence, the results should be interpreted with caution when extrapolated to non-stable COPD patients. Third, the use of generic questionnaires to determine HRQL is controversial, as they may have less discriminative power.Citation42 While this may be true, the EQ-5D questionnaire was selected as it is recommended for obtaining utility values, with studies supporting its validity in assessing the impact of COPD on HRQL.Citation11,Citation12 In addition, patients also completed the specific CAT questionnaire, and there was a moderate-to-strong correlation (Spearman’s rho =−0.63 [P<0.001], Kendall’s tau =-0.48 [P<0.001]) between CAT scores and utility values obtained by the EQ-5D questionnaire. Fourth, the study confirmed the so-called ceiling effect, as 22% of patients had the best possible utility value. Although this percentage is consistent with that observed in a previous study,Citation12 the ceiling effect may limit the validity of the results obtained in the linear regression model. To overcome this potential limitation, the same multivariate analysis was performed using the Tobit and censored least absolute deviations models (Table S1), which take into account the apparent censure in utility values due to the ceiling effect. The three models showed equivalent results (the factors significantly associated with utility values were the same) and, of the three models, linear regression showed the best fit. Finally, 85.5% of the patients enrolled were males. Although this is consistent with the epidemiology of COPD in Spain,Citation3 the results should be interpreted with caution when extrapolated to females.
Conclusion
This study found that the clinical variables with the greatest influence on HRQL in COPD patients were symptoms such as dyspnea and a history of exacerbations. Lung function, despite being a significant factor in the univariate analysis, lost its significant association with utility values in the multivariate analysis. The estimates obtained from utility values and the impact that the associated variables may have on utility values may allow the incorporation of changes in the clinical management of patients with stable COPD and also could be useful in economic evaluations such as cost–utility analyses.
Acknowledgments
This study was funded by GlaxoSmithKline (study HZC116842). The authors acknowledge the participation of M Bonnin (H de Figueres, Girona); JA Riesco (H San Pedro de Alcántara, Cáceres); P Casán (Instituto de Silicosis, Oviedo); L Muñoz (H Reina Sofía, Córdoba); JL López-Campos (H Virgen del Rocío, Sevilla); L Comeche (H Quirón, Pozuelo de Alarcón, Madrid); S Alonso (H de Torrejón de Ardoz, Madrid); P García-Sidro (H Universitario de la Plana, Vila-real); JL Viejo (H General Yagüe, Burgos); P Sobradillo (H Txagorritxu, Vitoria); M Valle (H Puerta de Hierro, Madrid) and RM Gómez (H La Princesa, Madrid) for patient recruitment and data collection, and I Pérez for her support and contribution during the design of the study and the review of the manuscript.
Supplementary materials
Calculation of goodness-of-fit indicators
Mean error:
(S1)
Mean absolute error:
Mean absolute percentage error:
Root mean square error:
where n is the sample size, yi are the observed values, and ŷi are the adjusted values.
Utility values adjusted by the proposed linear model
The utility values adjusted by the proposed linear model were obtained by applying the following formula:
where mMRC is the modified Medical Research Council Dyspnea Scale.
Table S1 Multivariate linear, Tobit, and CLAD regressions
Disclosure
M Miravitlles has received speaker fees from Almirall, Boehringer Ingelheim, Pfizer, AstraZeneca, Chiesi, Esteve, GlaxoSmithKline, Menarini, Talecris-Grifols, Takeda-Nycomed, and Novartis, and consulting fees from Almirall, Boehringer Ingelheim, Pfizer, GlaxoSmithKline, Gebro Pharma, MediImmune, Novartis, Talecris-Grifols, and Takeda-Nycomed. JL López-Campos has received honoraria for lecturing, scientific advice, participating in clinical studies, or writing for publications for (in alphabetical order): Almirall, AstraZeneca, Bayer, Boehringer Ingelheim, Cantabria Pharma, Chiesi, Esteve, Faes, Ferrer, GlaxoSmithKline, Menarini, MSD, Novartis, Pfizer, and Takeda. M Valle has received honoraria for participating in clinical studies, writing for publications, and scientific advice from: Almirall, Astra Zeneca, Boehringer Ingelheim, Chiesi, Esteve, Ferrer, GlaxoSmithkline, Menarini, Novartis, Pfizer, and Takeda-Nycomed. P García-Sidro has received fees for scientific meetings, scientific advice, participating in clinical studies, or writing for publications from (in alphabetical order): Almirall, AstraZeneca, Boehringer Ingelheim, Chiesi, Esteve, Ferrer, Gebro, GlaxoSmithKline, Menarini, MSD, Novartis, Pfizer, and Takeda-Nycomed. A Huerta is employed by GlaxoSmithKline, the sponsor of the study. C Forné is employed by Oblikue Consulting, which received financing from GlaxoSmithKline to carry out the study. C Crespo was employed by Oblikue Consulting at the time of the execution and analysis of the study. GlaxoSmithKline did not place any restriction on authors about the statements made in the final paper and the decision to submit was that of the authors alone. The authors report no other conflicts of interest in this work.
References
- DecramerMJanssensWMiravitllesMChronic obstructive pulmonary diseaseLancet201237998231341135122314182
- López-CamposJLRuiz-RamosMSorianoJBMortality trends in chronic obstructive pulmonary disease in Europe, 1994–2010: a joinpoint regression analysisLancet Respir Med201421546224461902
- MiravitllesMSorianoJBGarcía-RíoFPrevalence of COPD in Spain: impact of undiagnosed COPD on quality of life and daily activitiesThorax2009641086386819553233
- FerrerMAlonsoJMoreraJChronic obstructive pulmonary disease stage and health-related quality of life. The Quality of Life of Chronic Obstructive Pulmonary Disease Study GroupAnn Intern Med199712712107210799412309
- TorranceGWMeasurement of health state utilities for economic appraisalJ Health Econ19865113010311607
- AraRWailooAJNICE DSU Technical Support Document 12: the use of health state utility values in decision modelsSheffield, UKDecision Support Unit2011 Available from: http://www.nicedsu.org.uk/TSD12%20Utilities%20in%20modelling%20FINAL.pdfAccessed October 22, 2014
- HusereauDDrummondMPetrouSISPOR Health Economic Evaluation Publication Guidelines-CHEERS Good Reporting Practices Task ForceConsolidated Health Economic Evaluation Reporting Standards (CHEERS) – explanation and elaboration: a report of the ISPOR Health Economic Evaluation Publication Guidelines Good Reporting Practices Task ForceValue Health201316223125023538175
- EuroQol GroupEuroQol – a new facility for measurement of health-related quality of lifeHealth Policy199016319920810109801
- Haute Autorité de SantéChoices in Methods for Economic EvaluationFranceDepartment of Economics and Public Health Assessment2012 Available from: http://www.has-sante.fr/portail/upload/docs/application/pdf/2012-10/choices_in_methods_for_economic_evaluation.pdfAccessed October 22, 2014
- StåhlELindbergAJanssonSAHealth-related quality of life is related to COPD disease severityHealth Qual Life Outcomes200535616153294
- PickardASWilkeCJungEPatelSStavemKLeeTAUse of a preference-based measure of health (EQ-5D) in COPD and asthmaRespir Med2008102451953618180151
- Rutten-van MölkenMPOostenbrinkJBTashkinDPBurkhartDMonzBUDoes quality of life of COPD patients as measured by the generic EuroQol five-dimension questionnaire differentiate between COPD severity stages?Chest200613041117112817035446
- RingbaekTBrøndumEMartinezGLangePEuroQoL in assessment of the effect of pulmonary rehabilitation COPD patientsRespir Med2008102111563156718693003
- MiravitllesMIzquierdoIHerrejónATorresJVBaróEBorjaJESFERA investigatorsCOPD severity score as a predictor of failure in exacerbations of COPD. The ESFERA studyRespir Med2011105574074721227672
- MiravitllesMNaberanKCantoniJAzpeitiaASocioeconomic status and health-related quality of life of patients with chronic obstructive pulmonary diseaseRespiration201182540240821778694
- NaberanKAzpeitiaACantoniJMiravitllesMImpairment of quality of life in women with chronic obstructive pulmonary diseaseRespir Med2012106336737322018505
- MiravitllesMSorianoJBAncocheaJCharacterisation of the overlap COPD-asthma phenotype. Focus on physical activity and health statusRespir Med201310771053106023597591
- MiravitllesMHuertaAFernández-VillarJAGeneric utilities in chronic obstructive pulmonary disease patients stratified according to different staging systemsHealth Qual Life Outcomes201412112025189786
- CharlsonMEPompeiPAlesKLMacKenzieCRA new method of classifying prognostic comorbidity in longitudinal studies: development and validationJ Chronic Dis19874053733833558716
- JonesPWHardingGBerryPWiklundIChenWHKline LeidyNDevelopment and first validation of the COPD Assessment TestEur Respir J200934364865419720809
- BestallJCPaulEAGarrodRGarnhamRJonesPWWedzichaJAUsefulness of the Medical Research Council (MRC) dyspnoea scale as a measure of disability in patients with chronic obstructive pulmonary diseaseThorax199954758158610377201
- BadiaXRosetMHerdmanMKindPA comparison of United Kingdom and Spanish general population time trade-off values for EQ-5D health statesMed Decis Making200121171611206949
- BrazierJEYangYTsuchiyaARowenDLA review of studies mapping (or cross walking) non-preference based measures of health to generic preference-based measuresEur J Health Econ201011221522519585162
- R Core TeamR: A Language and Environment for Statistical ComputingViennaR Foundation for Statistical Computing2013 Available from: http://www.R-project.org/Accessed October 22, 2014
- Spanish Statistical OfficeEncuesta Nacional de Salud de España 2011–2012 [Spanish National Health Survey 2011–2012] Latest published data2013 Available from: http://www.ine.es/jaxi/menu.do;jsessionid=F1AC5C5327BC8A876380E258216895FA.jaxi01?type=pcaxis&path=/t15/p419&file=inebase&L=1Accessed October 22, 2014
- TsiligianniIKocksJTzanakisNSiafakasNvan der MolenTFactors that influence disease-specific quality of life or health status in patients with COPD: a review and meta-analysis of Pearson correlationsPrim Care Respir J201120325726821472192
- Carrasco GarridoPde Miguel DíezJRejas GutiérrezJNegative impact of chronic obstructive pulmonary disease on the health-related quality of life of patients. Results of the EPIDEPOC studyHealth Qual Life Outcomes200643116719899
- de TorresJPCasanovaCHernándezCGender associated differences in determinants of quality of life in patients with COPD: a case series studyHealth Qual Life Outcomes200647217007639
- RaherisonCTillie-LeblondIPrudhommeAClinical characteristics and quality of life in women with COPD: an observational studyBMC Womens Health20141413124555562
- MiravitllesMMolinaJNaberanKCotsJMRosFLlorCEVOCA studyFactors determining the quality of life of patients with COPD in primary careTher Adv Respir Dis200712859219124350
- Villar BalboaICarrillo MuñozRRegí BosqueMMarzo CastillejoMArcusa VillacampaNSegundo YagüeMFactors associated with the quality of life in patients with chronic obstructive pulmonary diseaseAten Primaria2014464179187 Spanish24262284
- Garcia-AymerichJHernandezCAlonsoAEffects of an integrated care intervention on risk factors of COPD readmissionRespir Med200710171462146917339106
- EstebanCQuintanaJMAburtoMImpact of changes in physical activity on health-related quality of life among patients with COPDEur Respir J201036229230020075059
- MiravitllesMCantoniJNaberanKFactors associated with low level of physical activity in patients with chronic obstructive pulmonary diseaseLung2014192225926524477375
- SeemungalTADonaldsonGCPaulEABestallJCJeffriesDJWedzichaJAEffect of exacerbation on quality of life in patients with chronic obstructive pulmonary diseaseAm J Respir Crit Care Med19981575 Pt 1141814229603117
- MiravitllesMCalleMAlvarez-GutierrezFGobarttELópezFMartínAExacerbations, hospital admissions and impaired health status in chronic obstructive pulmonary diseaseQual Life Res200615347148016547786
- MiravitllesMFerrerMPontAIMPAC Study GroupEffect of exacerbations on quality of life in patients with chronic obstructive pulmonary disease: a 2 year follow up studyThorax200459538739515115864
- García-PoloCAlcázar-NavarreteBRuiz-IturriagaLAInEPOC GroupFactors associated with high healthcare resource utilisation among COPD patientsRespir Med2012106121734174223058483
- BentsenSBMiaskowskiCRustøenTDemographic and clinical characteristics associated with quality of life in patients with chronic obstructive pulmonary diseaseQual Life Res201423399199823999743
- SundhJStällbergBLisspersKMontgomerySMJansonCComorbidity, body mass index and quality of life in COPD using the Clinical COPD QuestionnaireCOPD20118317318121513436
- JonesPMiravitllesMvan der MolenTKulichKBeyond FEV1 in COPD: a review of patient-reported outcomes and their measurementInt J Chron Obstruct Pulmon Dis2012769770923093901
- PickardASYangYLeeTAComparison of health-related quality of life measures in chronic obstructive pulmonary diseaseHealth Qual Life Outcomes201192621501522