
Abstract
Background
There are limited studies directly comparing correlation and agreement between peak expiratory flow rate (PEFR) and forced expiratory volume in 1 second (FEV1) for severity classification of COPD. However, clarifying the role of PEFR as a surrogate of COPD severity classification instead of FEV1 is essential in situations and areas where spirometry is not routinely available.
Purpose
To evaluate the agreement between FEV1 and PEFR using Global initiative for chronic Obstructive Lung Disease (GOLD) severity classification criteria.
Materials and methods
This cross-sectional study included stable COPD patients. Both absolute values and % predicted FEV1 and % predicted PEFR were obtained from the same patients at a single visit. The severity of COPD was classified according to GOLD criteria. Pearson’s correlation coefficient was used to examine the relationship between FEV1 and PEFR. The agreement of % predicted FEV1 and % predicted PEFR in assigning severity categories was calculated using Kappa statistic, and identification of the limits of agreement was by Bland–Altman analysis. Statistical significance was set at P-value <0.05.
Results
Three hundred stable COPD patients were enrolled; 195 (65.0%) male, mean age 70.4±9.4 years, and mean % predicted FEV1 51.4±20.1. Both correlations between the % predicted FEV1 and PEFR as well as the absolute values were strongly significant (r=0.76, P<0.001 and r=0.87, P<0.001, respectively). However, severity categories of airflow limitation based on % predicted FEV1 or PEFR intervals were concordant in only 179 patients (59.7%). The Kappa statistic for agreement was 0.41 (95% confidence interval, 0.34–0.48), suggesting unsatisfied agreement. The calculated limits of agreement were wide (+27.1% to −28.9%).
Conclusion
Although the correlation between FEV1 and PEFR measurements were strongly significant, the agreement between the two tests was unsatisfied and may influence inappropriate clinical decision making in diagnosis, severity classification, and management of COPD.
Introduction
Both percentages of predicted forced expiratory volume in 1 second (FEV1) and peak expiratory flow rate (PEFR) are widely used to estimate the degree of pulmonary impairment in patients with COPD.Citation1–Citation3 In general, FEV1 measurements by spirometry are preferred as it is much more reproducible.Citation4 However, spirometry is not widely available, and the technical pitfalls of performing spirometry frequently limit usage, especially at a primary care level.Citation5 Using PEFR measurement is more economical and much more widely available, therefore it is proposed as an alternative to spirometry.Citation1–Citation3
Definition and severity assessments of COPD severity are now based on post-bronchodilator ratio FEV1 and forced vital capacity (FEV1/FVC) and % predicted FEV1 measurements, respectively.Citation6 Recent reports suggest that peak flow measurements may be an inexpensive way of screeningCitation7 and initial identification of severe cases of COPD for subsequent confirmatory spirometry.Citation8–Citation10 In general, the correlation coefficients between % predicted PEFR and % predicted FEV1 was moderate to good ranging from 0.5 to >0.9;Citation11–Citation13 however, the degree of agreement between the two estimates were unsatisfactory.Citation3,Citation14 The factors that precluded generalization of the results from these studies in COPD included: small numbers of patients,Citation3,Citation11,Citation12 recording multiple paired estimates on each subject and analyzing each pair as a separate variable,Citation3 and conducting in heterogeneous subjects (persistent cough subjects,Citation13 asthmaCitation12 or mixed subjects with asthma and COPD).Citation3,Citation14 Since clinical decisions are often based on results of these two measurements, we intended to clarify the role of PEFR as a surrogate for FEV1 in COPD severity classification.
Materials and methods
Outpatients aged over 40 years diagnosed with COPD by Global initiative for chronic Obstructive Lung Disease (GOLD) criteriaCitation6 were treated at the chest clinic, Chiang Mai University Hospital, Chiang Mai, Thailand from 1 April 2012 to 30 September 2012 and were screened for this study. Inclusion criteria were: smokers or ex-smokers with a smoking history of ≥10 pack-years, aged ≥40 years, and no exacerbations >6 weeks prior to enrollment. Patients were excluded if they had a history or family history of asthma, onset of breathlessness at age <40 years, and unable to perform spirometry or peak expiratory flow maneuver. Accurate measurements of both spirometry and PEFR in the same subject were administered by a qualified technician in the study team. Both FEV1 and PEFR were obtained from the same patients at a single visit using spirometer (Vmax series 22, Sensormedics, Bilthoven, Holland). All subjects were measured for post-bronchodilator FVC, FEV1, ratio of FEV1/FVC (FEV1%) using ATS/ERS standard guidelinesCitation15 and PEFR by a Mini-Wright peak flow meter (Clement Clarke International Ltd., Essex, UK). Each patient performed the test in a standing position while holding the peak flow meter horizontally without interfering with the movement of the marker (arrow) or covering the slot. Patients were instructed to take a deep breath then exhale by forceful expiration as fast as possible while maintaining an air tight seal between lip and mouth piece of the instrument with standard techniques developed by the American Thoracic Society.Citation16 Technicians recorded readings only if the instrument was held in the proper horizontal position. Both % predicted FEV1 and % predicted PEFR were calculated using Thai equations,Citation17 and categories of airflow limitation severity were classified according to GOLD criteria.Citation6 The study protocol was approved by the Ethics Committee of the Faculty of Medicine, Chiang Mai University.
Statistical analysis
Results for numerical values were expressed as mean ± standard deviation, and those for categorical data were expressed as absolute frequencies and percentages. Comparisons of the measurements between FEV1 and PEFR using paired Student’s t-test. Pearson’s correlation was used to examine the relationship between FEV1 and PEFR. COPD severity using FEV1 and PEFR were compared using Fisher’s exact tests. Measurements of lung function were used to classify the severity of airflow limitation (according to GOLD criteria)Citation6 with 0−<30%, 30−<50%, 50−<80%, and ≥80% for both predicted FEV1 and PEFR values representing very severe, severe, moderate, and mild severity, respectively. The agreement between severity category assignment using % predicted FEV1 and % predicted PEFR was calculated using Cohen’s Kappa statistic calculations.Citation18 A Kappa value of greater than 0.60 was considered sufficient to ensure agreement.Citation19 Bland–Altman analysis was used to identify the limits of agreement between the two estimates.Citation20 Statistical significance was set at P-value <0.05. All analyses were carried out using SPSS statistical package, version 16 for Windows; SPSS, Inc; Chicago, IL, USA.
Results
The demographic characteristics of the 300 enrolled COPD patients are shown in . The subjects were elderly (mean age 70.4±9.4 years), predominantly male (65%), and the largest proportion was classified with moderate to severe stages of disease (GOLD II 38% and III 38.7%).
Table 1 Baseline characteristics of all COPD patients
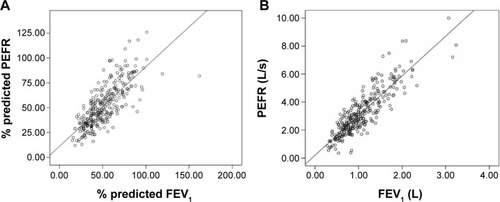
Correlations between the % predicted and absolute values for FEV1 and PEFR were strongly significant (r=0.76 and 0.87, respectively). However, the scatter was wide in patients with mild airflow limitation ().
Figure 1 Correlation between FEV1 and PEFR in patients with COPD.
Abbreviations: FEV1, forced expiratory volume in 1 second; PEFR, peak expiratory flow rate.
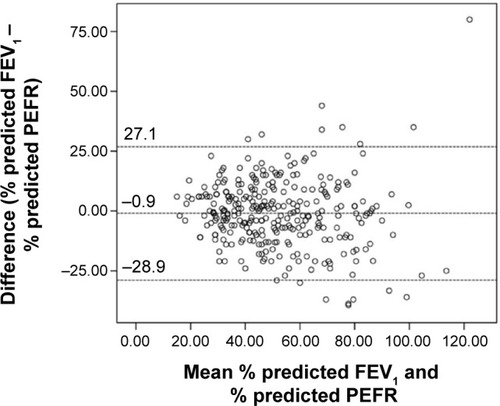
For the entire study population, the differences between % predicted FEV1 and PEFR followed a normal distribution with approximately 40% of them having a discrepancy of ≥±10% (), and % predicted PEFR overestimated % predicted FEV1 by a mean of only 0.9% (95% confidence interval; –2.6, 0.7) (). However, limits of agreement were wide (+27.1% to −28.9%) (). Mean % predicted FEV1 and PEFR in each severity category of airflow limitation were assessed (). Assignment to mild and moderate groups were insignificant (P=0.068 and P=0.855, respectively). However, % predicted PEFR significantly overestimated % predicted FEV1 in severe and very severe groups (P=0.007 and P=0.006, respectively).
Table 2 Comparison between % predicted FEV1 and % predicted PEFR in each category of airflow limitation
Figure 2 Histogram showing the near-normal distribution of differences between % predicted FEV1 and PEFR in COPD patients.
Abbreviations: FEV1, forced expiratory volume in 1 second; PEFR, peak expiratory flow rate.
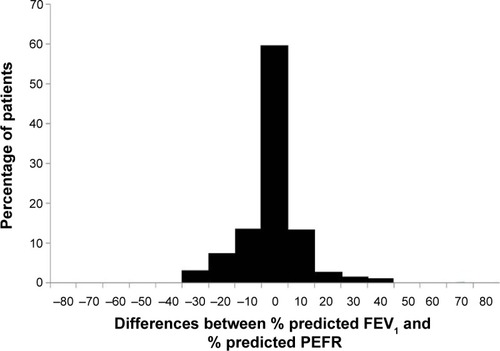
Figure 3 Bland–Altman plot highlighting magnitude of difference between % predicted FEV1 and PEFR.
Severity categories of airflow limitation based on % predicted intervals are presented in . PEFR and FEV1 severity categories were concordant in only 59.7% of the study patients. In the mild group, PEFR underestimated the severity of airflow limitation in 45% of patients whereas it overestimated the severity of airflow limitation in 36.6% of the very severe group patients. In groups with moderate and severe airflow limitation, the percentages of over- and under-estimation by PEFR for each group are also demonstrated in the table. The Kappa statistic for agreement in this table was 0.41 (95% confidence interval, 0.34–0.48), suggesting only moderate agreement between the two measurements.
Table 3 Concordance between categorization of severity of airflow limitation based on % predicted FEV1 and % predicted PEFR in COPD patients
Discussion
This study reveals a marked variability in agreement between the measurements of % predicted FEV1 and % predicted PEFR values in COPD patients. The results provide strong evidence that the two estimates are not equivalent in the assessment of severity of airflow limitation in COPD patients. The severity classification of airflow limitation between the two estimates was concordant in only 59.7% of patients evaluated, while % predicted FEV1 and % predicted PEFR values were apart more than 10% in 40% of patients. The strong correlation between the two estimates in this study was also observed in prior studies in limited subjects with asthma and COPD,Citation3 subjects with asthma,Citation12 or subjects with persistent cough.Citation13 Such a strong correlation meant that the two methods of measurements of airflow limitation in COPD patients were highly related. However, the high correlation of the two measurements is irrelevant to the question of agreement.Citation20 In our study, the Kappa statistic for agreement suggested only moderate agreement between the two measurements which was considered insufficient to ensure agreement.Citation19
PEFR is measured on the first effort dependent portion of the forced expiratory maneuver and predominantly reflects large airway function. FEV1 is determined both by the effort dependent and independent portions of this maneuver and reflects both large and peripheral airway function.Citation21 Thus, different changes in FEV1 and PEFR may be observed, depending on the amount and predominant site of airway narrowing. In COPD patients, after the initial rapid rise in expiratory flow, intrathoracic pressure is increased. This increased intrathoracic pressure causes segmental and other large airways’ collapse and obstructed passage of air through those airways which results in rapid reduction in flow after a relatively normal peak has been attained, leading to significantly lower values for FEV1 compared to PEFR. These issues could lead to a significant discordance if % predicted FEV1 is replaced by % predicted PEFR for the purpose of severity classification. The mean difference between % predicted FEV1 and % predicted PEFR in this study was only 0.9% but a discrepancy of ≥10% between % predicted FEV1 and % predicted PEFR occurred in 40% of the patients. However, some previous studies showed a much wider mean difference, with % predicted FEV1 being lower than % predicted PEFR by 9.1%–17.2% because they included patients with asthma and limited numbers of evaluated patients.Citation3,Citation12 The mean differences between % predicted PEFR and % predicted FEV1 in this study significantly increased from 0.3% in moderate to 4.3% in very severe airflow limitation. Therefore, % predicted PEFR tended to underestimate severity of airflow limitation as the severity of COPD increased. In addition, the limits of agreement were also wide and pointed toward an absence of parity between % predicted FEV1 and % predicted PEFR.
Our study found that in patients with severe airflow limitation (severe and very severe categories) % predicted PEFR underestimated % predicted FEV1, whereas the exact opposite happened in patients with less severe airflow limitation (mild to moderate categories). It is clear from these results that if GOLD guidelines are followed and % predicted PEFR is used as a surrogate for that of FEV1, then severity of obstruction would be wrongly categorized in a large proportion of patients and could result in inappropriate diagnosis, severity classification, and management. Because of strong correlations, % predicted PEFR should be used as a surrogate for % predicted FEV1. However, the limits of agreement were wide and resulted in a significant discordance in the severity categories of airflow limitation according to GOLD classification. These values render substitution of % predicted PEFR for % predicted FEV1 “ruling out” or “ruling in” severe airflow limitation.
PEFR may not be able to accurately identify GOLD stage, but previous studies indicated some usefulness of peak flow rate measurements for daily monitoring in patients with COPD,Citation22 COPD screening,Citation7 and initial identification of severe cases of COPD for subsequent confirmatory spirometry.Citation8–Citation10 Another study states that peak expiratory flow was the most important predictive value for determining the risk of death in patients who required hospitalization for acute exacerbation of COPD.Citation23 A recent prospective study from the People’s Republic of China shows that a lower value of height-adjusted peak flow measurement was associated with increased mortality from respiratory and other causes, including lung cancer and cardiovascular disease.Citation24 In addition, we did not look at changes in PEFR over time, therefore we cannot rule out that PEFR may be useful in monitoring disease progression. The strengths of our study are: first, only COPD patients were studied and to our knowledge we enrolled the largest number of COPD patients for studying the agreement between the two estimates. Second, the severity categories of airflow limitation according to GOLD criteria were applied for comparison of the two measurements. Third, the measurements of FEV1 and PEFR were highly accurate because the patients were measured within a single session to avoid diurnal and day-to-day variability. Taken together, the results can be interpreted with great confidence. The major limitation of our study is that it is strictly applicable to evaluating only COPD patients treated at the chest clinic and may not be generalized to other sets of COPD patients at other clinics.
Conclusion
Although the correlation between FEV1 and PEFR measurements was strongly significant, the agreement between the two tests was unacceptable and may influence inappropriate clinical decision making in diagnosis, severity classification, and management of COPD.
Author contributions
C Pothirat developed the study design and carried out acquisition and interpretation of data, statistical analysis, manuscript preparation, and critical revision of intellectual content. The remaining authors contributed to acquisition and interpretation of data, revised the article for important intellectual content, and gave final approval of the version to be published.
Acknowledgments
The authors wish to thank the subjects who kindly took part in this study and to acknowledge the staff members of the Division of Pulmonary, Critical Care and Allergy, Department of Internal Medicine, Faculty of Medicine, Chiang Mai University, for their contribution to this study.
Disclosure
The authors report no conflicts of interest in this work.
References
- HansenEFVestboJPhanarethKKok-JensenADirksenAPeak flow as predictor of overall mortality in asthma and chronic obstructive pulmonary diseaseAm J Respir Crit Care Med20011633 Pt 169069311254525
- JacksonHHubbardRDetecting chronic obstructive pulmonary disease using peak flow rate: cross sectional surveyBMJ2003327741665365414500437
- LlewellinPSawyerGLewisSThe relationship between FEV1 and PEF in the assessment of the severity of airways obstructionRespirology20027433333712421241
- PellegrinoRViegiGBrusascoVInterpretative strategies for lung function testsEur Respir J200526594896816264058
- EatonTWithySGarrettJEMercerJWhitlockRMReaHHSpirometry in primary care practice: the importance of quality assurance and the impact of spirometry workshopsChest1999116241642310453871
- RabeKFHurdSAnzuetoAGlobal strategy for the diagnosis, management, and prevention of chronic obstructive pulmonary disease: GOLD executive summaryAm J Respir Crit Care Med2007176653255517507545
- MaranetraNChuaychooBNarumanCThe cost-effectiveness of mini peak expiratory flow as a screening test for chronic obstructive pulmonary disease among the Bangkok elderlyJ Med Assoc Thai200386121133113914971521
- MahboubBAlzaabiASorianoJBCase-finding of chronic obstructive pulmonary disease with questionnaire, peak flow measurements and spirometry: a cross-sectional studyBMC Res Notes2014724124739210
- JithooAEnrightPLBurneyPCase-finding options for COPD: results from the Burden of Obstructive Lung Disease studyEur Respir J201341354855522743668
- Perez-PadillaRVollmerWMVzquez-GarciaJCCan a normal peak expiratory flow exclude severe chronic obstructive pulmonary disease?Int J Tuberc Lung Dis200913338739319275802
- KellyCAGibsonGJRelation between FEV1 and peak expiratory flow in patients with chronic airflow obstructionThorax19884343353363406923
- TeeterJGBleeckerERRelationship between airway obstruction and respiratory symptoms in adult asthmaticsChest199811322722779498938
- ThiadensHADe BockGHVan HouwelingenJCCan peak expiratory flow measurements reliably identify the presence of airway obstruction and bronchodilator response as assessed by FEV1 in primary care patients presenting with a persistent cough?Thorax199954121055106010567623
- AggarwalANGuptaDJindalSKThe relationship between FEV1 and peak expiratory flow in patients with airways obstruction is poorChest200613051454146117099024
- MillerMRCrapoRHankinsonJGeneral considerations for lung function testingEur Respir J200526115316115994402
- No authors listedStandardization of spirometry, 1994 updateAm J Respir Crit Care Med19951523110711367663792
- DejsomritrutaiWWongsurakiatPChierakulNCharoenratanakulSNanaAMaranetraKNComparison between specified percentage and fifth percentile criteria for spirometry interpretation in Thai patientsRespirology20027212312711985734
- LandisJRKochGGThe measurement of observer agreement for categorical dataBiometrics1977331159174843571
- FleissJLLevinBPailMCStatistical Methods for Rates and Proportions2ndHoboken, NJJohn Wiley & Sons, Inc2003
- BlandJMAltmanDGStatistical methods for assessing agreement between two methods of clinical measurementLancet1986184763073102868172
- RobinsonDRChaudharyBASpeirWAJrExpiratory flow limitation in large and small airwaysArch Intern Med19841447145714606732405
- MurataGHKapsnerCOLiumDJBusbyHKPatient compliance with peak flow monitoring in chronic obstructive pulmonary diseaseAm J Med Sci199831552963019587085
- de la IglesiaFDiazJLPitaSPeak expiratory flow rate as predictor of inpatient death in patients with chronic obstructive pulmonary diseaseSouth Med J200598326627215813152
- SmithMZhouMWangLPetoRYangGChenZPeak flow as a predictor of cause-specific mortality in China: results from a 15-year prospective study of ~170,000 menInt J Epidemiol201342380381523918851