

Abstract
Background
Elevated cardiovascular disease risk is observed in patients with COPD. Non-invasive assessments of endothelial dysfunction and arterial stiffness have recently emerged to provide mechanistic insight into cardiovascular disease risk in COPD; however, the reproducibility of endothelial function and arterial stiffness has yet to be investigated in this patient population.
Objectives
This study sought to examine the within-day and between-day reproducibility of endothelial function and arterial stiffness in patients with COPD.
Methods
Baseline diameter, peak diameter, flow-mediated dilation, augmentation index, augmentation index at 75 beats per minute, and pulse wave velocity were assessed three times in 17 patients with COPD (six males, eleven females, age range 47–75 years old; forced expiratory volume in 1 second =51.5% predicted). Session A and B were separated by 3 hours (within-day), whereas session C was conducted at least 7 days following session B (between-day). Reproducibility was assessed by: 1) paired t-tests, 2) coefficients of variation, 3) coefficients of variation prime, 4) intra-class correlation coefficient, 5) Pearson’s correlations (r), and 6) Bland–Altman plots. Five acceptable assessments were required to confirm reproducibility.
Results
Six out of six within-day criteria were met for endothelial function and arterial stiffness outcomes. Six out of six between-day criteria were met for baseline and peak diameter, augmentation index and pulse wave velocity, whereas five out of six criteria were met for flow-mediated dilation.
Conclusion
The present study provides evidence for within-day and between-day reproducibility of endothelial function and arterial stiffness in patients with COPD.
Acknowledgments
The authors would like to thank the patients for their commitment and participation in this study. We also would like to acknowledge Dr Betty Wray for her support in patient recruitment to this study. This study was supported by the American Heart Association 10SDG3050006 (RAH).
Authors’ contributions
RAH conceived and designed the study; NS, LB, and RAH performed experiments; PR-M and RAH analyzed data, interpreted the results of experiments, prepared figures, and drafted the manuscript; PR-M, NS, LB, TD, and RAH edited and revised the manuscript and provided final approval; and RAH is the guarantor of the final version of the manuscript. All authors contributed toward data analysis, drafting, and revising the manuscript.
Disclosure
The authors report no conflicts of interest in this work.
Supplementary materials
Methodology
Pulmonary function testing
A minimum of three reproducible trials were completed by each participant, and the best of three acceptable forced expiratory maneuvers were selected to represent the pulmonary function values. The National Health and Nutrition Examination Survey (NHANES) III spirometric reference standards were used to determine the percentage predicted data set.
Brachial artery flow-mediated dilation
Endothelial function was determined via brachial artery flow-mediated dilation (FMD) in accordance with the tutorial on the ultrasound assessment of FMD.Citation1 Briefly, measurements took place in a quiet, temperature-controlled (22°C–24°C) room, where patients were instructed to lie supine with their right arm laterally extended for 20 minutes to establish a hemodynamic steady state. The brachial artery was imaged longitudinally in Duplex mode (simultaneous B-mode and blood velocity profiles) by a Doppler ultrasound (Logiq 7; GE Medical Systems, Milwaukee, WI, USA) using a 12-MHz linear transducer placed 2 cm to 10 cm above the antecubital fossa. Blood velocity was obtained with the sample volume set at a depth between 1 cm and 3 cm. The average diameter and blood velocity for 30 cardiac cycles were recorded and analyzed to represent baseline values. Subsequently, a 5 cm ×84 cm forearm occlusion cuff (D.E. Hokanson, Bellevue, WA, USA) was placed immediately distal to the medial epicondyle and rapidly inflated to 250 mmHg for 5 minutes (E-20 rapid cuff inflator; D.E. Hokanson) to induce arterial occlusion and reactive hyperemia of the brachial artery. ECG gaiting (Accusync 72; Accusync Medical Research, Milford, CT, USA) was used to capture end-diastolic arterial diameters, triggered by the QRS complex, for automated offline analysis of brachial artery vasodilatation (Brachial Analyzer Software, Medical Imaging Applications, Coralville, IA, USA). FMD is expressed as a percent increase in peak diameter from baseline diameter.
Arterial tonometry
Pulse wave analysis
Augmentation index (Aix) was determined by applanation tonometry (SphygmoCor; AtCor Medical, West Ryde, NSW, Australia) of the left radial artery, calibrated with the brachial systolic and diastolic pressure measured with an inflated cuff at the brachial artery in accordance with the manufacturer’s recommendations. The SphygmoCor system transforms the peripheral waveform to a central waveform using a mathematical algorithm. Since AIx varies with heart rate, it is usually adjusted to 75 beats per minute (AIx75).Citation2 At least two independent waveform analyses were obtained from each subject, with reproducible measurements only accepted on meeting SphygmoCor quality control criteria.
Pulse wave velocity
Carotid-femoral pulse wave velocity (cfPWV) was determined in duplicate using the SphygmoCor system by sequentially recording electrocardiographic-gated carotid and femoral artery waveforms by applanation tonometry as described previously.Citation3,Citation4 Using a Rosscraft segmometer, straight line distance measurements were taken from the suprasternal notch to the carotid sampling site and from the suprasternal notch to the site where the femoral artery was measured. The time interval (t, in seconds) between the onset of femoral and carotid waveforms was determined as the mean from 10 consecutive cardiac cycles. High quality measurements were confirmed by the standard deviation of time intervals corresponding to the patient’s ECG and femoral and carotid artery waveforms. Standard deviations greater than 10% of the cfPWV value were not accepted. The cfPWV was calculated from the distance between measurement points (D, in meters) and the measured time delay between the peak of the ECG P-wave and the trough of a waveform (t) as follows: cfPWV = D/t (m/sec).
Figure S1 Bland–Altman analysis plots illustrating no systematic bias and good within-day reproducibility for (A) AIx, (B) AIx75, and (C) PWV. Notes: Solid lines represent systematic bias and dashed lines represent the 95% CI at two SD of the differences.
Abbreviations: AIx, augmentation index; PWV, pulse wave velocity; AIx75, AIx at 75 bpm.
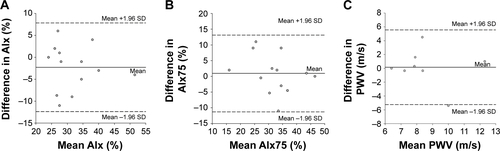
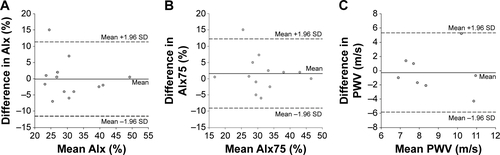
Figure S2 Bland–Altman analysis plots illustrating no systematic bias and good between-day reproducibility for (A) AIx, (B) AIx75, and (C) PWV.
Note: Solid lines represent systematic bias and dashed lines represent the 95% CI at two SD of the differences.
Abbreviations: AIx, augmentation index; PWV, pulse wave velocity; AIx75, AIx at 75 bpm.
References
- HarrisRANishiyamaSKWrayDWRichardsonRSUltrasound assessment of flow-mediated dilationHypertension2010551075108520351340
- WilkinsonIBMacCallumHFlintLThe influence of heart rate on augmentation index and central arterial pressure in humansJ Physiol2000525Pt 126327010811742
- LaurentSCockcroftJVan BortelLExpert consensus document on arterial stiffness: methodological issues and clinical applicationsEur Heart J2006272588260517000623
- RobertsCKLeeMMKatiraieMStrength fitness and body weight status on markers of cardiometabolic healthMed Sci Sports Exerc2015471211121825251047