
 ?Mathematical formulae have been encoded as MathML and are displayed in this HTML version using MathJax in order to improve their display. Uncheck the box to turn MathJax off. This feature requires Javascript. Click on a formula to zoom.
Abstract
Computed tomography (CT) is widely used for evaluation of lung diseases. To evaluate the value of CT measurement of pulmonary artery for diagnosis of chronic obstructive pulmonary disease (COPD) and its comorbidity pulmonary hypertension (PH), we retrospectively reviewed the CT of 221 patients with COPD and 115 control patients without cardiovascular or lung disease. Patients with COPD were divided into PH (COPD-PH) and non-PH according to systolic pulmonary artery pressure. Main pulmonary artery (MPA), right pulmonary artery (RPA) and left pulmonary artery branches, and ascending aorta (AAo) and descending aorta (DAo) diameters were measured. Meanwhile, the ratios of MPA/AAo and MPA/DAo were calculated. MPA, RPA, and left pulmonary artery diameters were significantly larger in COPD than those in the controls, and this augment was more obvious in COPD-PH. AAo and DAo diameters did not vary obviously between groups, while MPA/AAo and MAP/DAo increased significantly in COPD and PH. MPA could be helpful for COPD diagnosis (MPA diameter ≥27.5 mm, sensitivity 54%, and specificity 80%), and RPA could be applied for COPD-PH diagnosis (RPA diameter ≥23.4 mm, sensitivity 67%, and specificity 76%). There was a marked correlation between MPA/DAo and systolic pulmonary artery pressure (r=0.594, P<0.001). Therefore, chest CT could be a simple and effective modality for diagnostic evaluation of COPD and its comorbidity, PH.
Background
Chronic obstructive pulmonary disease (COPD) is a global, high mortality and morbidity lung disease, which is currently the fifth leading cause of deaths in the world. It was estimated that COPD would become the third leading cause of deaths globally in 2030.Citation1 Pulmonary hypertension (PH) is one of the important factors for acute exacerbation of COPD. The presence of PH increased the hospitalization rate and the mortality of the patients with COPD.Citation2
Although with controversies, the majority of scholars considered pulmonary function tests (PFTs) as the gold standard for COPD diagnosis.Citation3 The decrease of forced expiratory volume in 1 second (FEV1)/forced vital capacity indicates airflow limitation. However, when diagnosis was established, many patients with COPD developed into moderate or severe COPD, as they ignored initial symptoms at an early stage and paid attention very late. And PFTs had not been widely performed in clinical practice even when it was necessary. In addition, COPD is a heterogeneous disease, and the severity of clinical symptoms and the level of lung function decline were often disproportionate.Citation4 Right heart catheterization (RHC) is the gold standard for PH diagnosis,Citation5 but it is invasive with bleeding, pneumothorax, and other risks and is not facilitated for long-term follow-up, which cannot be widely preformed in patients with COPD.
Chest computed tomography (CT) is widely used for evaluation of lung diseases and CT measurements correlated well with the COPD assessment test.Citation6 In addition, CT is a useful tool for thoracic vascular assessment. It could detect changes of small vessels, and these anomalies are important for clinical implications.Citation7,Citation8 But this assessment required special software and expert technology support, which was not suitable for routine use. Regarding central vessels including the main pulmonary artery (MPA) and branches, the assessment was not much of a problem. The assessment of these vessels could be conducted on CT with or without contrast by routine software.Citation9–Citation12 Wells et alCitation13 manifested that MPA diameter/ascending aorta diameter (MPA/AAo) was strikingly associated with the decline of FEV1, and MPA/AAo increased in acute exacerbation of moderate to severe COPD. More importantly, the prospective study indicated that MPA/AAo >1 could be an indicator to predict acute exacerbation of COPD. Following the development of COPD, pulmonary vessels changed with the destruction of vascular bed and pulmonary vascular remodeling, causing PH. It was found that the measurement of MPA/AAo on CT could indicate the occurrence of PH in patients with COPD.Citation14 The threshold value of MPA/AAo was set as 1. However, the ratio in some COPD patients with PH was not greater than 1. Therefore, we retrospectively reviewed 221 COPD patients and 115 other patients without cardiovascular or lung disease to analyze the difference of different indexes between groups and look for a more sensitive and specific index on CT measurement by which to provide a reliable basis for the diagnosis of COPD and PH.
Materials and methods
General information
According to Global initiative for chronic Obstructive Lung Disease guideline (2013),Citation1 the diagnostic criteria of COPD was FEV1/forced vital capacity after inhaling bronchodilators in PFTs less than 70%. We included 221 patients with definite diagnosis of COPD and 115 patients without cardiovascular or lung disease consecutively from November 2013 to October 2014 in The First Affiliated Hospital of Nanjing Medical University. All patients were excluded from congenital heart disease, valvular heart disease, aortic aneurysm, pulmonary arterial hypertension, or PH associated with other diseases except COPD. A total of 115 of these subjects were even ruled out of COPD, asthma, pulmonary fibrosis, or lung cancer. The reasons why they did chest CT were: to exclude lung cancer as the elevation of tumor biomarker, to have a regular follow-up for lung nodules, and to exclude pulmonary metastasis when other tumor existed. There was no obvious cough, expectoration, shortness of breath, and other symptoms of COPD in these patients, and their FEV1/forced vital capacity >70%. The blood test, PFTs, echocardiogram, and CT were performed within 1 week. This study was approved by the Ethics Committee of The First Affiliated Hospital of Nanjing Medical University. As all examinations were noninterventional, the need for patients to sign informed consent was waived.
Diagnosis of PH
GE Vivid 7 Dimension color Doppler ultrasonic diagnostic apparatus was applied, and M3S probe with a frequency of 1.7–3.4 MHz was chosen. Subjects were surveyed at calm breathing with left lateral position; electrocardiogram and heart rate were simultaneously recorded. According to simplified Bernoulli equation, systolic pulmonary artery pressure (sPAP) was estimated by the reflux peak of systolic tricuspid regurgitation (sPAP =4 VmaxCitation2 + right atrial pressure). All patients completed the examination. If sPAP >36 mmHg, PH was diagnosed. Then, patients with COPD were divided into PH and non-PH groups.
CT examination
CT examination was individualized according to each body size. Scanning equipment was a Germany Siemens 16 slice spiral CT scanner (SOMATOM Emotion 16, Siemens, Germany). Scan parameters included: mean tube voltage 120 kV (100–140 kV), tube current 60 mA, detector collimator 64 mm N 0.6 mm, gantry rotation time 0.5 s/cycle, and pitch 1.0. Reconstruction slice thickness was 1 mm, inter-laminar distance was 5 mm for accessing mediastinum and 1 mm for accessing lung parenchyma, matrix was 512*512, and CT reconstruction convolution mean value was B31f (20–50) by soft tissue algorithms. Before scanning, subjects were trained to hold breath at the end of deep expiratory. The whole lung was scanned from the apex to the bottom without contrast agent injection when subjects were supine, both hands holding the head in deep expiratory.
CT indexes and contents
As Tan et alCitation12 and Ng et alCitation15 reported, vascular measurements were preceded on the mediastinal window images of chest CT. The contents included: 1) MPA diameter: the widest part of MPA before MPA bifurcation ( and ) right pulmonary artery (RPA) and left pulmonary artery (LPA) diameters: the widest part of RPA and LPA after MPA bifurcation (, , and ) AAo and descending aorta (DAo) diameters: the widths of AAo and DAo at the same level of MPA (). Then, the ratio of MPA/AAo and MPA/DAo were calculated. Two senior radiologists accomplished all measurements respectively, without clinical data or echocardiography results of the subjects. If there was a big difference (≥5%), they consulted each other and repeated until a consensus was reached.
Figure 1 Measurement of main pulmonary artery (MPA), right pulmonary artery (RPA), ascending aorta (AAo), and descending aorta (DAo) diameters at the level of the pulmonary artery bifurcation.
Note: MPA diameter =31.6 mm, RPA diameter =26.6 mm, AAo diameter =32.7 mm, and DAo diameter =26.6 mm.
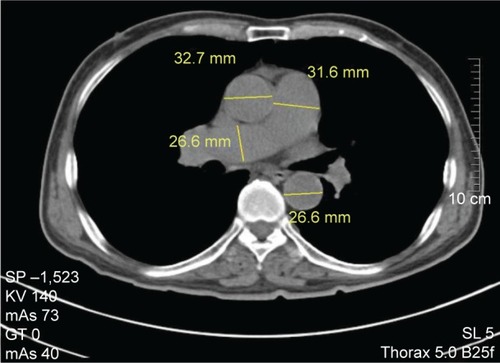
Figure 2 Measurement of left pulmonary artery (LPA) diameter at the widest part after main pulmonary artery bifurcation.
Note: LPA diameter =22.6 mm.
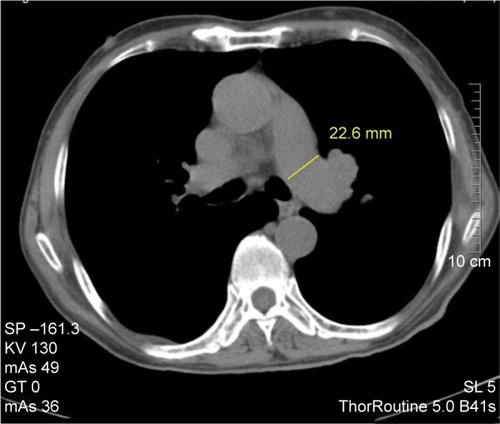
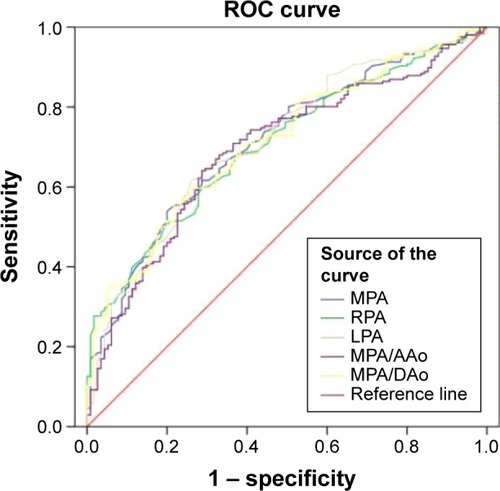
Figure 3 Receiver operating characteristic (ROC) curves showing the diagnostic accuracy of different CT measurements for COPD.
Abbreviations: CT, computed tomography; COPD, chronic obstructive pulmonary disease; MPA, main pulmonary artery; RPA, right pulmonary artery; LPA, left pulmonary artery; AAo, ascending aorta; DAo, descending aorta.
Statistics
SPSS 20.0 was used for data management and statistics. Data were presented by mean ± standard deviation or mean ± standard error. Student’s t-test, Mann–Whitney U-test, and chi-square test were used to compare the demography, CT data, and blood indexes. A cutoff value of each index by the maximum Youden index (sensitivity + specificity −1) was used to predict COPD or PH. To observe whether CT index could be a marker for COPD or PH, logistic regression was used. According to previous analysis, variables with potential confounding factors and variables with P<0.10 in univariate analysis were included into binary logistic regression model by the simple model of backward stepwise method. Hosmer–Lemeshow’s goodness-of-fit test was used to evaluate the model. Receiver operating characteristic (ROC) curve was used to assess differences among the model. Pearson’s and Spearman’s test were used to calculate the correlation coefficient. Two tailed P<0.05 was considered statistically significant.
Results
Analysis for COPD
A total of 221 patients positively diagnosed with COPD were included, of whom 175 were male. A total of 115 other patients were included as controls, of whom 89 were male. Although the subjects in COPD were older, both groups were mainly of male patients. Blood tests included C-reactive protein (CRP), blood glucose, and triglyceride. Indexes of blood and chest CT are shown in . Inflammation was obvious in COPD, while CRP slightly increased in the controls. There was no significant difference in blood glucose between the two groups. Blood lipid in patients with COPD was lower compared with the controls. MPA, RPA, and LPA diameters in patients with COPD were marked thicker than those in control (MPA 28.7±5.2 mm, RPA 22.5±3.7 mm, LPA 20.9±3.1 mm). There was no significant difference among AAo and DAo diameters, while ratios of MPA/AAo and MPA/DAo significantly increased in COPD (MPA/AAo 0.83±0.15 vs 0.74±0.11, MPA/DAo 1.15±0.23 vs 0.99±0.14, P<0.001, respectively).
Table 1 Demographics, blood, and CT comparisons for COPD
According to the backstep method of logistic regression to test the diagnosis of COPD, MPA, RPA, LPA, and DAo were involved, and they were independently correlated with COPD. The regression equation produced was:
To select an index measured on CT for the diagnosis of COPD and judge the best cutoff value, ROC curves were conducted. The point when the area under the curve (AUC) was the largest was the cutoff value. showed ROC curves of different indexes, and showed AUC for COPD. From , we obtained that AUC of LPA was the largest (0.713), followed by MPA/DAo (0.712) and MPA (0.711). MPA/AAo was the minimum (0.694). Although AUC of LPA was the largest (0.713), MPA/DAo (0.712) was the second, and MPA (0.711) was the third, there was not much difference. Moreover, there was usually anatomy variation for LPA, and MPA diameter was often used in previous studies, therefore we selected MPA for the index to diagnose COPD. The points of other indicators corresponding to the maximum area values were: RPA diameter 21.4 mm (sensitivity 60%, specificity 71%), LPA diameter 20.1 mm (sensitivity 62%, specificity 74%), MPA/AAo 0.7754 (sensitivity 64%, specificity 71%), and MPA/DAo 1.0920 (sensitivity 56%, specificity 78%).
Table 2 Area under the curve
Analysis for PH
According to sPAP measured by echocardiography, 56 patients were included in the PH group, which was COPD-related PH (COPD-PH) – group 3 of PH classification, and the remaining 165 patients were included in the non-PH group. The proportion of women in the two groups was 21.4% and 20.6%, respectively (). There was no significant difference of CRP or blood glucose between two groups, while blood lipid level was lower in PH. Notably, MPA, RPA, and LPA diameters in patients with COPD were thicker than those in control patients with PH (MPA 32.1±6.2 mm, RPA 24.9±3.7 mm, and LPA 22.4±3.4 mm). While for patients with COPD-PH, these were thicker than patients with COPD only, AAo diameter slightly increased in PH than that in non-PH (35.9±4.0 vs 34.4±4.1 mm, P=0.03). In spite of this, the ratios of MPA/AAo and MPA/DAo still increased significantly (MPA/AAo 0.90±0.19 vs 0.81±0.13, P=0.001; MPA/DAo 1.30±0.32 vs 1.09±0.17, P<0.001).
Table 3 Demographics, blood, and CT comparisons for COPD patients with or without PH
According to the backstep method of logistic regression for the diagnosis of PH, MPA, RPA, and DAo, which independently correlated with PH, were involved. The regression equation produced was:
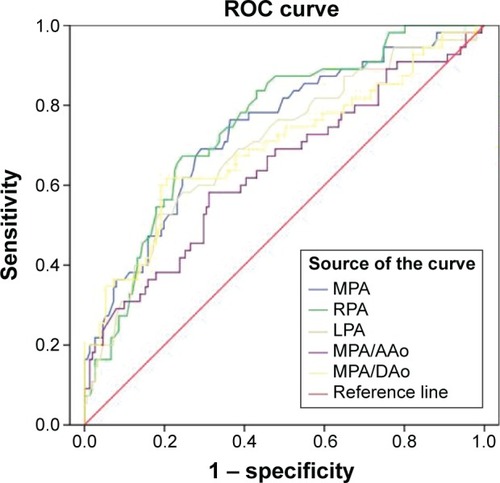
Similarly, ROC curves were conducted (). From , we obtained that the AUC of RPA was the largest (0.753), followed by MPA (0.739) and LPA (0.701); MPA/AAo was the minimum (0.641). Therefore, RPA diameter was selected as the best index for the diagnosis of PH, with 23.4 mm as the optimal threshold, sensitivity 67%, and specificity 76%. The points of other indicators corresponding to the maximum area values were: MPA diameter 29.4 mm (sensitivity 69%, specificity 71%), LPA diameter 22.5 mm (sensitivity 53%, specificity 81%), MPA/AAo 0.8586 (sensitivity 58%, specificity 69%), and MPA/Dao 1.2212 (sensitivity 62%, specificity 80%).
Table 4 Area under the curve for PH
Figure 4 Receiver operating characteristic (ROC) curves showing the diagnostic accuracy of different CT measurements for COPD-PH.
Abbreviations: CT, computed tomography; COPD, chronic obstructive pulmonary disease; PH, pulmonary hypertension; MPA, main pulmonary artery; RPA, right pulmonary artery; LPA, left pulmonary artery; AAo, ascending aorta; DAo, descending aorta.
Association of COPD and PH
The diameters of MPA, RPA, and LPA and the ratios of MPA/AAo and MPA/DAo in patients with COPD-PH further increased than those in patients with COPD only, and there were significant differences (). To understand the relationship between the enlargement of these indexes and pulmonary artery pressure (PAP), linear regression was analyzed ().
Table 5 CT measured indexes and sPAP in linear regression analysis
Figure 5 Comparison of MPA, RPA and LPA diameters, and MPA/AAo and MPA/DAo between COPD (non-PH) and COPD-PH.
Abbreviations: COPD, chronic obstructive pulmonary disease; PH, pulmonary hypertension; MPA, main pulmonary artery; RPA, right pulmonary artery; LPA, left pulmonary artery; AAo, ascending aorta; DAo, descending aorta.
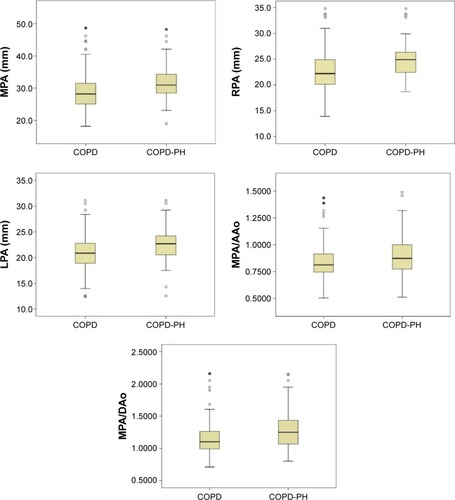
As showed, MPA, RPA, LPA, MPA/AAo, and MPA/DAo were positively correlated with sPAP. The correlation coefficient of MPA/DAo was the maximum, followed by MPA/AAo. Although AUC of RPA was the largest described previously, RPA was not the best factor correlated with sPAP. Combining and , MPA/DAo was considered as the best indicator for diagnosis or predictor of COPD-PH.
Discussion
COPD is a chronic inflammatory disease, which not only affects the structure and function of lung but also influences the metabolism, hormone secretion, and organ function of multiple systems all over the body. CRP is a biomarker of inflammation. As the results show, CRP in patients with COPD significantly increased, indicating the presence of persistent inflammation in COPD. Compared with healthy people, elevated blood glucose of patients with COPD might be related to insulin resistance. However, in this study, blood glucose in the controls was higher than that in COPD. It could be because of the influence of some patients with diabetes in the controls. There was no significant difference of blood lipids between COPD patients and healthy people in previous studies, while triglyceride in the controls was higher than that in COPD. It might also be because of metabolic syndrome of patients in the controls.
Consistent with previous research,Citation14 both MPA and branches diameters in COPD were significantly enlarged compared with those in the controls, and there were no significant differences of AAo and DAo between the two groups. It was found that a composite index of MPA/AAo or MPA/DAo proved perfectly consistent in different studies and research subjects.Citation9,Citation13 There might be an anatomical difference for MPA, while a composite calculation could reduce this effect. Our results also indicated that MPA/AAo and MPA/DAo were bigger than those in the controls. Emphysema leads to the destruction of alveolar units and capillaries following the development of COPD. Contraction of blood vessels and capillaries injury by hypoxia reduce the blood volume of small vessels, leading blood flow into the larger pulmonary arteries, resulting in right ventricular dysfunction and increase in the diameters of these arteries.Citation16
To investigate whether CT measurement could be helpful for COPD diagnosis, we conducted logistic regression. MPA, RPA, LPA, and AAo were involved. If the result was equal to or greater than 1 based on the regression equation, COPD could be considered. Then, PFTs must be performed to make the diagnosis of COPD. Which one measured on CT could be the best to predict COPD? According to the analysis of ROC curve, MPA was selected. COPD could be considered when MPA diameter ≥27.5 mm. However, the sensitivity of this target was low in spite of high specificity. Maybe it was because vascular changes were too small to alter at the early stage of COPD.
Chronic hypoxia and acidosis in COPD caused pulmonary vascular contraction and the changes of pulmonary artery structure, resulting in pulmonary vascular resistance, and increase in PAP.Citation17 RHC was gold standard for the diagnosis of PH. However, according to Seeger et al,Citation17 for patients with COPD, RHC was necessary only for those who were candidates for lung transplantation or attending clinical trials. Therefore, the subjects in our study was diagnosed for PH with echocardiography, not RHC, and echocardiography was applied to detect the occurrence of PH. Idiopathic pulmonary arterial hypertension was common in young women, but for COPD, it was common in elderly males.Citation18 That is why only 21.4% women accounted for COPD-PH. Although CRP level was slightly higher in COPD-PH than that in non-PH, there was no significant difference. It might be because there were some COPD patients with pulmonary infection in non-PH. Blood glucose was higher in COPD-PH, which meant that insulin resistance played a role in the occurrence of COPD-PH. Similar to previous studies, blood lipid (triglyceride) in COPD-PH was also higher.
As pulmonary artery dilated, pulmonary artery diameter increased. In our study, MPA and branches enlarged significantly in COPD-PH. A little different from COPD compared with the controls, AAo diameter in COPD-PH was slightly larger than that in non-PH. However, it did not affect the MPA/AAo ratio. Although MPA and MPA/AAo were associated with mean PAP (mPAP), it could not completely rule out PH when applying a single variable.Citation12,Citation15 Devaraj et alCitation19 found that MPA/AAo could increase the diagnostic value of tricuspid gradient by echocardiography, but it could not identify all patients with PH by one index alone. Considering this, we assumed that multi-index on CT measurement might be better for the diagnosis of PH. According to logistic regression analysis, MPA, RPA, and DAo were involved. If logistic equation was equal to or more than 1, PH should be fully considered.
It was reported that PH should be suspected when pulmonary artery dilated, and pulmonary artery diameter was positively correlated with PAP.Citation20,Citation21 Further study showed that PH should be considered when MPA/AAo ≥1.Citation15 According to the analysis of ROC curve, we found the AUC of RPA was the maximum, even more than that of MPA, which meant that the RPA diameter might be the best marker to predict PH. PH should be considered when RPA diameter ≥23.4 mm. If selecting MPA, the diameter should be equal to or greater than 29.4 mm, which was consistent with previous studies. On the contrary, the AUC of MPA/AAo commonly used was the minimum. It was reported that MPA/AAo ≥1 could indicate PH and predict acute exacerbation for patients with COPD.Citation13 However, it was usually found that MPA/AA was less than 1 in some COPD-PH patients with acute exacerbation, and some COPD-PH patients with MPA/AA ≥1 did not often develop acute exacerbation. Lin et alCitation22 also found that MPA/AAo ratio of 16% subjects was great than 1 in normal people. There might be other factors affecting MPA/AAo ratio in addition to COPD and PH. Thus, MPA/AAo might not be the best indicator of COPD-PH; even when selecting this index, 1 is not the best cutoff value, and 0.86 or 0.9 could be more appropriate, but needs further validation in future studies.
There was a good correlation between MPA/AAo and mPAP measured by RHC. Similar to Iyer et al,Citation23 we also found that sPAP measured by noninvasive echocardiography was positively correlated with indexes from CT, and the correlation coefficient from high to low was MPA/DAo > MPA/AAo > MPA > RPA > LPA. Devaraj et alCitation19 reported that MPA/DAo correlated well with mPAP. Our study confirmed that there was a good correlation between MPA/DAo and sPAP, and MPA/DAo was better than MPA/AAo, which is to say MPA/DAo could more reflect the changes of PAP. MPA, RPA, and LPA increased with age in healthy adults. There was a significant difference for age between patients with COPD and the controls. MPA, RPA, and LPA increased with age in healthy adults and patients with COPD or PH in this study, but age did not provide statistical significance in logistic regression analysis. The difference of age did not influence the difference of MPA, RPA, LPA, MPA/AAo, and MPA/DAo between groups. At the same time, it was found that AAo and DAo seemed to increase with age as well; however, the coefficients between age and vessels were very small (data not shown). Therefore, it could exclude influence of the age for MPA/AAo or MPA/DAo, and diameter thickening of MPA and branches was mainly caused by the increase of PAP.
Still, there were some limitations in our study. It was a retrospective study, and the conclusion might not be extended to all patients, and prospective studies are needed for further verification. COPD group might include a small part of patients with acute exacerbation, which might affect the magnification on CT. However, it also indicated that the index measured on CT could reflect the conditions changed. Although all subjects in the controls claimed they did not have a COPD history or other lung disease, and PFTs were normal, it could not completely rule out a mixture of COPD. Yet even if there were, they were very mild and did not need any respiratory treatment. The gold standard for PH was RHC, while echocardiography was applied in this study. That was because all subjects included were older, and they did not need transplantation or attend drug clinical trial. As per the suggestion by Seeger et al,Citation17 RHC was not necessary in this situation.
In this study, we found MPA and branches diameters measured on CT increased in patients with COPD and more significantly when developed into PH. MPA diameter might be helpful for the diagnosis of COPD with less sensitivity and high specificity. RPA diameter could be applied to predict the occurrence of COPD-PH. MPA/DAo could more reflect the change of PAP. In conclusion, CT is a rapid, simple, and effective tool for the diagnosis and evaluation of COPD and its comorbidity PH.
Disclosure
The authors report no conflicts of interest in this work.
References
- GOLD2013Global Strategy for the Diagnosis, Management, and Prevention of Chronic Obstructive Pulmonary Disease Available from: http://www.goldcopd.org
- BarberaJAMechanisms of development of chronic obstructive pulmonary disease-associated pulmonary hypertensionPulm Circ20133116016423662194
- NardiniSAnnesi-MaesanoIDel DonnoMThe AIMAR recommendations for early diagnosis of chronic obstructive respiratory disease based on the WHO/GARD model*Multidiscip Respir Med201494613124401649
- PaolettiMCestelliLBigazziFCamiciottoliGPistolesiMChronic obstructive pulmonary disease: pulmonary function and CT lung attenuation do not show linear correlationRadiology2015276257157825848902
- GalieNHoeperMMHumbertMGuidelines for the diagnosis and treatment of pulmonary hypertension: the Task Force for the Diagnosis and Treatment of Pulmonary Hypertension of the European Society of Cardiology (ESC) and the European Respiratory Society (ERS), endorsed by the International Society of Heart and Lung Transplantation (ISHLT)Eur Heart J200930202493253719713419
- ZhangYTuYHFeiGHThe COPD assessment test correlates well with the computed tomography measurements in COPD patients in ChinaInt J Chron Obstruct Pulmon Dis20151050751425784797
- WashkoGRParragaGCoxsonHOQuantitative pulmonary imaging using computed tomography and magnetic resonance imagingRespirology201217343244422142490
- EsteparRSKinneyGLBlack-ShinnJLComputed tomographic measures of pulmonary vascular morphology in smokers and their clinical implicationsAm J Respir Crit Care Med2013188223123923656466
- TruongQAMassaroJMRogersISReference values for normal pulmonary artery dimensions by noncontrast cardiac computed tomography: the Framingham Heart StudyCirc Cardiovasc Imaging20125114715422178898
- BurgerIAHusmannLHerzogBAMain pulmonary artery diameter from attenuation correction CT scans in cardiac SPECT accurately predicts pulmonary hypertensionJ Nucl Cardiol201118463464121688066
- Perez-EnguixDMoralesPTomasJMVeraFLloretRMComputed tomographic screening of pulmonary arterial hypertension in candidates for lung transplantationTransplant Proc20073972405240817889203
- TanRTKuzoRGoodmanLRSiegelRHaaslerGBPresbergKWUtility of CT scan evaluation for predicting pulmonary hypertension in patients with parenchymal lung disease. Medical College of Wisconsin Lung Transplant GroupChest19981135125012569596302
- WellsJMWashkoGRHanMKPulmonary arterial enlargement and acute exacerbations of COPDN Engl J Med20123671091392122938715
- ShinSKingCSBrownAWPulmonary artery size as a predictor of pulmonary hypertension and outcomes in patients with chronic obstructive pulmonary diseaseRespir Med2014108111626163225225149
- NgCSWellsAUPadleySPA CT sign of chronic pulmonary arterial hypertension: the ratio of main pulmonary artery to aortic diameterJ Thorac Imaging199914427027810524808
- WellsJMIyerASRahaghiFNPulmonary artery enlargement is associated with right ventricular dysfunction and loss of blood volume in small pulmonary vessels in chronic obstructive pulmonary diseaseCirc Cardiovasc Imaging201584
- SeegerWAdirYBarberaJAPulmonary hypertension in chronic lung diseasesJ Am Coll Cardiol20136225 SupplD109D11624355635
- AryalSDiaz-GuzmanEManninoDMInfluence of sex on chronic obstructive pulmonary disease risk and treatment outcomesInt J Chron Obstruct Pulmon Dis201491145115425342899
- DevarajAWellsAUMeisterMGCorteTJWortSJHansellDMDetection of pulmonary hypertension with multidetector CT and echocardiography alone and in combinationRadiology2010254260961620093532
- BeiderlindenMKuehlHBoesTPetersJPrevalence of pulmonary hypertension associated with severe acute respiratory distress syndrome: predictive value of computed tomographyIntensive Care Med200632685285716614811
- CorsonNArmatoSG3rdLabbyZEStrausCStarkeyAGomberg-MaitlandMCT-based pulmonary artery measurements for the assessment of pulmonary hypertensionAcad Radiol201421452353024594422
- LinFYDevereuxRBRomanMJThe right sided great vessels by cardiac multidetector computed tomography: normative reference values among healthy adults free of cardiopulmonary disease, hypertension, and obesityAcad Radiol200916898198719394871
- IyerASWellsJMVishinSBhattSPWilleKMDransfieldMTCT scan-measured pulmonary artery to aorta ratio and echocardiography for detecting pulmonary hypertension in severe COPDChest2014145482483224114440