
Abstract
Background
Traditional Chinese medicine (TCM) with single or compound materials is an effective cure for liver fibrosis. Hepatic stellate cells (HSCs) play a key role in liver fibrosis pathology and have become a novel drug target for this condition.
Methods
CCK-8 assay was used to determine the cytotoxicity of four components, SYPA, HSYPA, Apigenin, and Luteolin, from Deduhonghua-7 powder on HSC-T6 cells. Transforming Growth Factor β 1 (TGFβ1)-induced fibrotic cell model and CCI4-induced fibrotic rat model were constructed, the expression of fibrosis-related genes, the pathological changes and serum biochemical markers were evaluated. Proteomic analysis was performed to determine the mechanism by which luteolin attenuated liver fibrosis, which were further confirmed by Western blot.
Results
Luteolin attenuates liver fibrosis in HSC-T6 cells and luteolin decreases the liver fibrosis index level in vivo. A total of 5000 differentially expressed proteins (DEPs) were obtained using proteomic analysis. KEGG analysis found that DEPs were concentrated in various metabolic pathways, including DNA replication and repair and lysosomal signaling. GO analysis showed that molecular functions included the activity and binding of various enzymes, related cellular components included the extracellular space, lysosomal lumen, mitochondrial matrix, and nucleus, and biological processes included collagen organization and biosynthesis and the positive regulation of cell migration. Western blot results showed that CCR1, CD59, and NAGA were downregulated in TGFβ1 treatment, while upregulated both in Lut2 and Lut10 treatment. Meanwhile, eight proteins, ITIH3, MKI67, KIF23, DNMT1, P4HA3, CCDC80, APOB, FBLN2, that were upregulated in TGFβ1 treatment, while downregulated both in Lut2 and Lut10 treatment.
Conclusion
Luteolin was shown to have a strong protective effect on liver fibrosis. CCR1, CD59, and NAGA may promote liver fibrosis while ITIH3, MKI67, KIF23, DNMT1, P4HA3, CCDC80, APOB, and FBLN2 may facilitate protection against fibrosis.
Introduction
Liver fibrosis is caused by chronic liver disease and can worsen into hepatic cirrhosis or even hepatocellular carcinoma (HCC).Citation1 Liver transplantation is the only feasible way to treat advanced stages liver fibrosis patients.Citation2 Thus, there is an urgent need for new therapeutic agents and treatment strategies.Citation3 The primary mechanism of fibrosis depends on hepatic stellate cells (HSCs), which become fibrogenic myofibroblasts during injury and are closely linked to the development of the novel drug targets.Citation4 Quiescent HSCs exit the Space of Disse (sinusoidal endothelial cell layer), which includes 5–8% of the liver, and may help to regulate the hepatic vascular system.Citation5 While transient HSCs are beneficial to liver reconstruction following brachychronic injury, unremitting activation associated with chronic injury can cause liver fibrosis.Citation6 Activated HSCs promote severe cell propagation and tremendous variation in their stellate morphology, together with lipid deposition, imbalanced degradation of the extracellular matrix (ECM), and increased production of the HSC-specific marker protein, alpha-smooth muscle actin (α-SMA).Citation7,Citation8 Activated HSCs also induce proinflammatory and profibrotic factors generated by inflammatory cells, including transforming growth factor β1 (TGF-β1).Citation9 TGF-β1 can also activate HSCs, inducing an autocrine-active feedback circuit which exacerbates liver fibrogenesis.Citation10,Citation11 To date, the only feasible systemic chemotherapeutic agent that increases the survival of advanced-stage HCC patients is the multi-tyrosine kinase inhibitor, sorafenib.Citation12
Traditional Chinese medicine (TCM) treatment strategies are also shown to be effective at treating liver fibrosis.Citation13 Deduhonghua-7 powder is a Traditional Mongolian Medicine, composed of Carthamus tinctorius L. (Hong hua), Gypsum (CaSO4·2H2O), Akebia quinata (Thunb.) Decne (Mu tong), Viola philippica (Zi hua di ding), Terminalia chebula Retz. (He zi), and Scabiosa comosa Fisch. ex Roem. et Schult (Lan peng hua), which protects liver function and prevents CCI4-induced liver fibrosis.Citation14 However, the mechanism by which Deduhonghua-7 powder exerts its therapeutic effects remains unknown.
Carthamus tinctorius L. is the most prominent of the seven traditional herbal medicines, whose extracts are reported to protect against lipopolysaccharide-induced liver injury.Citation15 Its main active components, safflower yellow pigment A (SYPA),Citation16 hydroxysafflor yellow pigment A (HSYPA),Citation17–19 and Carthamus redCitation20 are all involved in regulating hepatic fibrosis. The flavonoids, Apigenin and Luteolin, from another Chinese herb in Deduhonghua-7 powder is Scabiosa comosa Fisch. ex Roem. et Schult, are also found to protect against fibrosis.Citation21,Citation22 Apigenin reduces liver fibrosis by limiting HSC activation and inducing autophagy through TGF-β1/Smad3 and p38/PPARα signaling.Citation23 Studies show that the known antioxidant, Luteolin, plays an antifibrotic role in the lungs,Citation24 the liver,Citation25 and cardiac tissue.Citation26
The current study assessed the protective action of Deduhonghua-7 powder on liver fibrosis and explored its possible molecular mechanisms. Four active components, SYPA, HSYPA, Apigenin, and Luteolin, were selected and their effect on the viability of HSC-T6 rat hepatic stellate cells was evaluated. A TGF-β1-induced fibrotic cell model (HSC-T6) and a carbon tetrachloride (CCl4)-induced fibrotic rat model were used for further research. Proteomic analysis was used to identify useful biomarkers for the treatment of liver injury.
Materials and Methods
Materials and Antibodies
Carbon tetrachloride (CCl4) (batch number: 20070721) was obtained from Sinopharm Co, Ltd (Shanghai, China). Safflower yellow pigment A (SYPA), hydroxyl safflower yellow pigment A (HSYPA), and Apigenin (4′,5,7-trihydroxyflavone, flavonoid) were obtained from MCE Corporation (USA). Luteolin (3′,4′,5,7-hydroxyl-flavone) was obtained from Sigma Chemical Co. (St. Louis, MO, USA). Recombinant mouse TGF-β1 was purchased from Cell Signaling Technology (Danvers, MA, USA). CCl4 and olive oil were provided by Sinopharm Chemical Reagent Co., Ltd. (Shanghai, China).
Antibodies against COLLAGEN (COL1) (ab34710), CD59 (ab124396), NAGA (ab233264), ITIH3 (ab97758), and DNMT1 (ab19905) were obtained from Abcam (MA, USA). Antibodies against α-SMA (19245S) were obtained from Cell Signaling Technology (Danvers, MA, USA). Antibodies against CCR1 (MAB5986) were purchased from R&D Systems. Antibodies against KIF23 (A4896) and P4HA3 (A137667) were purchased from ABclonal (Wuhan, China). Antibodies against GAPDH (60004-1-IG) were purchased from Proteintech part, Inc. (Rosemont, USA).
Cell Culture and Cytotoxicity Assays
Dulbecco’s modified Eagle medium (DMEM) (Sigma-Aldrich, St. Louis, MO, USA) containing 10% fetal bovine serum (FBS) (Gibco; Thermo Fisher Scientific, Waltham, MA, USA) was used to cultivate HSC-T6 rat hepatic stellate cells (FuDan IBS Cell Center, Shanghai, China). The cells were activated with 5 ng/mL TGFβ1 for 0, 12, 24, and 48 hours, respectively.
HSC-T6 cells were inoculated (at 3000 cells per 100 μL) into 96-well plates in quadruplicate and incubated overnight at 37°C for wall attachment. The medium was replaced with fresh medium (control) or medium containing half-log serial dilutions of the following drugs: 22.22–200 μM, 0.3–30 μM veliparib (ChemieTek), 1–100 μM bicalutamide (IPR Pharmaceutical), 0.667–200 μM Hydroxyl safflower yellow pigment A (HSYPA), and 2.22–20 μM Apigenin and 0.667–10 μM Luteolin.
Cell feasibility was determined using a CCK-8 kit (Beyotime, Shanghai, China) after 72 hours. The inhibitory concentration (IC50) was measured after double logarithmic conversion of the dose-response curves.
RNA Isolation and RT-qPCR
Total RNA was isolated from cultivated cells with TRIzol reagent (TaKaRa, Dalian, China) and reverse-transcribed into complementary DNA (cDNA) using reverse transcription reagents (TaKaRa) as per the manufacturer’s instructions. On a Bio-Rad CFX96 detection system, SYBR Premix ExTaq (TaKaRa) was used to perform RT-qPCR. The 2−ΔΔCt method was used to calculate the fold changes in the gene expression. Primer were list in Supplementary Table 1.
Western Blot Assay
HSC-T6 cells were harvested and lysed using RIPA buffer (Beyotime, Shanghai, China). Protein concentrations were measured using a BCA kit (Thermo Fisher) and the samples were subjected to 10% SDS-PAGE and transferred to PVDF membranes for Western blotting. Membranes were blocked with TBST containing 5% BSA for 1 hour and the COL1, α-SMA, or other antibodies were added for overnight incubation at 4°C. After washing twice in TBST, the membranes were incubated with horseradish peroxidase-conjugated secondary antibody for 1 hour at ambient temperature. An ECL chemiluminescence kit (GE Healthcare China Corp., Beijing, China) was used to visualize the membrane-bound secondary antibodies.
Animal Studies
Wistar rats (150–160g) were purchased from Beijing Vital River Animal Experimental Technology Co, Ltd. (Beijing, China). Rats were kept in a temperature-controlled room at 22 ± 2 °C with a moisture capacity of 40 ± 10% and a 12 h:12 h light: dark cycle. Normal feeding and sterile water were always available. CCl4 was dissolved in olive oil (15% v/v, 1 mL/kg). After 7 days of adaptation, the rats were stochastically separated into four groups (n = 10): 1) control group, 2) CCl4 group, 3) CCl4 + Luteolin low dose (L) group, and 4) CCl4 + Luteolin high dose (H) group. Groups 2–4 were administered the specified drug 2x per week with 50% CCl4 olive oil aqua of 1 mL/kg bodyweight for 9 weeks. After 7 weeks, groups 3–4 were administered 10 mg/kg Luteolin (L) or 50 mg/kg Luteolin intragastrically each day for 3 weeks, while groups 1–2 were administered a corresponding amount of saline. The rats were anesthetized with isoflurane and sacrificed to collect the blood and liver when their average weight was 20–30% lower than the control rats weights.
Histopathological Testing and Blood Biochemistry Determination
The liver samples used for the histopathological analyses were cut into 0.1 g blocks, fixed in 4% paraformaldehyde, and embedded in paraffin. The samples were then analyzed using HE and Masson staining. A Leica digital pathology platform was used to scan all sections. Abdominal aortic blood serum was collected from the four groups, centrifuged at 4°C for 10 minutes at 3500 r/min, and frozen at −80°C for further component analysis. Aspartate aminotransferase (AST), alanine aminotransferase (ALT), and alkaline phosphatase (ALP) levels were determined with biochemical kits (Nanjing Jiancheng Biological Engineering Research Institute, Nanjing, China) using a fully automatic biochemical analyzer (BS-240VET, Mindray Bio-medical Electronics Company, Ltd, Shenzhen, China).
Proteomic Analysis
HSC-T6 cells were separated into four groups: 1) Vehicle (control) group, 2) TGFβ1 (5ng/mL, model) group, 3) Lut 2 group (TGFβ1 + 2 μM Luteolin), and 4) Lut 10 group (TGFβ1 + 10 μM Luteolin). A total protein extraction kit (Biorad, Beijing, China) was used to extract total cellular protein and a BCA Protein Assay Kit (Thermo Scientific) was used to measure protein concentrations. The protein samples were sent to GeneChem Biotechnology Corporation for subsequent proteomic analysis by PRM (Parallel Reaction Monitoring). SAS online software was used to analyze the proteomics data. DEPs were classified under factor a |fold change| >1.2. DAVID online was used for gene ontology (GO) and different protein tract analyses and the parameter conditions were set at count=2 and ease=0.05. Comprehensive analysis of the DEPs was performed using a Venn diagram. Co-expressed genes with the largest degree of overlap were considered core genes and potential targets, playing a critical role in the anti-fibrotic mechanisms of Luteolin. Continuous data were calculated using the variance homogeneity test followed by a one-way ANOVA (homogeneity of variance) or a non-parametric test (heterogeneity of variance). Differences between the parameters were considered significant if the P-value was <0.05.
Statistical Analysis
Statistical analysis and mapping were performed using GraphPad Prism v8 (GraphPad Software, Inc., San Diego, USA). Prominent deviations between different groups were assessed using the Student’s t-test, and prominent deviations among 3+ groups were determined by one-way ANOVA followed by Dunnett’s post hoc test. The differences between different groups were considered significant if the P value was <0.05.
Results
Luteolin Attenuates Liver Fibrosis in HSC-T6 Cells
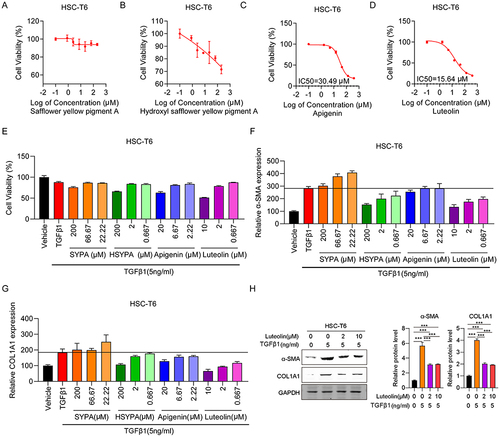
To assess the cytotoxicity of the four main components of Carthamus tinctorius L, SYPA, HSYPA, Apigenin, and Luteolin, HSC-T6 cell viability was determined after treatment with a gradient dilution of each component using a CCK-8 assay. Apigenin and Luteolin treatment significantly reduced cell viability in a dose-dependent manner. The IC 50 values for each treatment group were 30.49 µM and 15.64 µM ( and ), respectively. SYPA treatment had no effect on HSC-T6 cell viability, while HSYPA had a limited impact on HSC-T6 cell survival ( and ). Next, the effect of these four components on HSC-T6 cell viability was assessed after treating the cells with TGFβ1. Cell viabilities in the HSYPA (200 µM), Apigenin (20 µM), and Luteolin (10 µM) groups were all significantly lower in the absence of TGFβ1, while no differences were observed in the SYPA group (). Furthermore, the fibrosis-related genes, including α-SMA and COL1A1 were assessed in the four groups in HSC-T6 cells. The expression of both genes was prominently increased in HSC-T6 cells treated with TGFβ1 and significantly lower in TGFβ1-induced cells that were treated with Luteolin ( and ). Similarly, α-SMA and COL1A1 protein levels were significantly lower in TGFβ1-induced HSC-T6 cells following Luteolin treatment (). These findings suggest that Luteolin attenuated liver fibrosis in HSC-T6 cells. To further assess its protective effect against liver fibrosis, Luteolin was selected for subsequent experiments.
Figure 1 Effect of Luteolin on HSC-T6 cell viability and fibrosis. (A) HSC-T6 cell viability following treatment with various concentrations of (A) Safflower yellow pigment A (SYPA) (B) Hydroxyl safflower yellow pigment A (HSYPA), (C) Apigenin, (D) Luteolin, or (E) TGFβ1 (5 ng/mL) and drugs. (F) α-SMA mRNA expression in HSC-T6 cells. (G) Collagen I mRNA expression in HSC-T6 cells. (H) α-SMA and collagen I protein expression in HSC-T6 cells. ***P < 0.001, by one-tailed Student’s t-test.
Luteolin Decreases the Liver Fibrosis Index Level in vivo
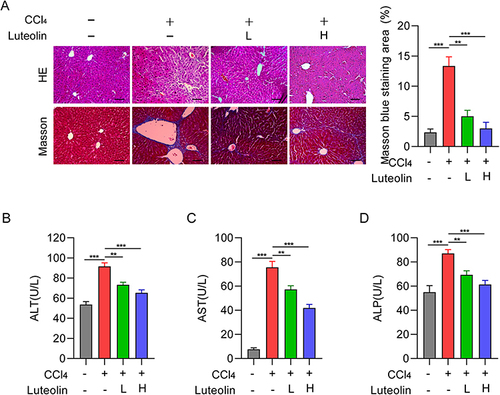
Carbon tetrachloride (CCl4) is a classical chemical regent for inducing liver lesions and hepatic fibrosis.Citation27 To investigate the role of Luteolin in regulating CCl4-induced hepatic injury, histological studies were performed to measure pathological changes in liver tissues. HE staining revealed the formation of clear hepatic lobules and the absence of inflammatory cells in the non-diseased portion. After CCl4 treatment, inflammatory cells surrounded the edematous hepatocytes, while only slight pathological changes and a small number of inflammatory cells were observed in the Luteolin-treated group. Masson trichrome staining also showed s collagen deposition in liver decreased significantly in a dose-dependent manner after luteolin treatment (). Analysis of serum biochemical markers was used as an initial evaluation of hepatic injury. Subsequently, serum levels of liver enzymes, including alanine aminotransferase (ALT), aspartate aminotransferase (AST), and alkaline phosphatase (ALP), were determined to assess organ integrity. Luteolin had a dose-dependent effect on all three enzymes and significant differences were observed between the Luteolin (L, H) and CCl4 groups (). These findings verified that Luteolin had a protective effect on liver fibrosis in CCl4-stimulated rats.
Figure 2 Effect of Luteolin treatment on liver fibrosis. (A) Representative images of HE and Masson-stained liver tissue treated with CCl4 and different concentrations of Luteolin (n-4). Bar=200um, 100X. (B–D) Serum ALT, AST, and ALP levels after treatment with CCl4 and different concentrations of Luteolin. “‑”, no treatment; “+”, treatment; “L”, 2uM; “H”, 10 uM. **P <0.01, ***P <0.001.
Differentially Expressed Protein Analysis
Proteomic analysis was performed to determine the mechanism by which Luteolin controls liver fibrosis. A total of 5000 differentially expressed proteins (DEPs) and diverse comparisons were obtained, and filtered for further analysis using the following criteria: a) |log2 Fold Change| ≥1.2 and b) P value <0.05. Based on these thresholds, 5047 proteins were differentially expressed between the TGFβ1 and Vehicle groups, including 53 upregulated and 36 downregulated proteins (). A total of 170 DEPs were differentially expressed between the Lut 2 and TGFβ1 groups (), including 47 upregulated and 123 downregulated proteins. After Luteolin treatment, more significant proteins were identified in Lut 2 vs TGFβ1 (170) and Lut 10 vs TGFβ1 (847, ) than TGFβ1 vs Vehicle. There were also more DEPs in Lut 10 vs TGFβ1 than in Lut 2 vs TGFβ1 and Lut 10 vs Lut 2 (540), which further validated the dose-dependent effect of Luteolin ().
Figure 3 DEPs analysis. Vaccaro plot of DEPs in the (A) TGFβ1 vs Vehicle group, (B) Lut 2 vs TGFβ1 group, (C) Lut 10 vs TGFβ1 group, and (D) Lut 10 vs Lut 2 group. Bubble diagrams of DEPs in KEGG pathways between (E) the TGFβ1 vs Vehicle group, (F) The Lut 2 vs TGFβ1 group, (G) The Lut 10 vs TGFβ1 group, and (H) The Lut 10 vs Lut 2 group. Vehicle: blank group; TGFβ1: model group; Lut 2: low dose group; Lut 10: high dose group. The Rich factor is displayed on the x-axis, and the p-value is indicated by the color of each circle, the size of which reflects the number of each pathway.
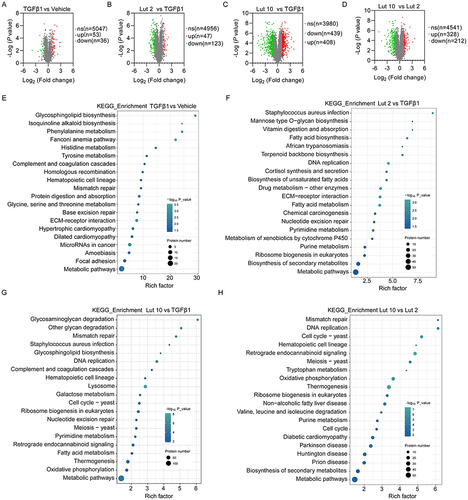
Gene Ontology (GO) and Kyoto Encyclopedia of Genes and Genomes (KEGG) analyses were used to determine the functions of these DEPs. KEGG analysis found that more proteins were involved in the metabolic pathways of the four group comparisons. In the TGFβ1 and Vehicle groups, these pathways included phenylalanine, histidine, tyrosine, glycine, serine, and threonine metabolism (). Glycosphingolipid biosynthesis, Fanconi anemia, ECM-receptor interactions, and microRNAs were also included, indicating that these processes are involved in TGFβ1-induced liver fibrosis. In the Lut 2 vs TGFβ1 group, the pathways included fatty acid and pyrimidine metabolism, the biosynthesis of secondary metabolites, and DNA replication. ECM-receptor interactions and drug metabolism-related enzymes were also included, suggesting that cell proliferation was induced against liver fibrosis (). In the Lut 10 vs TGFβ1 group, the pathways included galactose, pyrimidine, and fatty acid metabolism. Interestingly, more DEPs were associated with lysosomes, suggesting that a higher Luteolin concentration induced more degradation (). In the Lut 10 vs Lut 2 group, metabolic pathways, thermogenesis, oxidative phosphorylation, retrograde endocannabinoid signaling, the cell cycle, and DNA replication were the primary pathways ().
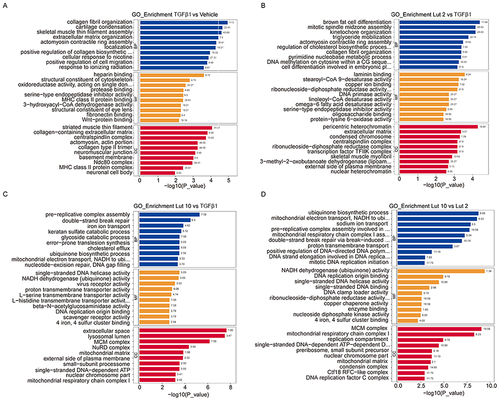
GO analysis was used to divide the DEPs into those involved in biological processes (BP), cellular components (CC), and molecular functions (MF). In the TGFβ1 vs Vehicle group, the BP-related proteins primarily included those involved in collagen organization and biosynthesis and the positive regulation of cell migration (). MF-related proteins mainly involved those with binding activities, while the CC proteins were primarily located in the extracellular space and in various complexes. In the Lut 2 vs TGFβ1 group, various enzyme activities involved MF-related proteins, and more cellular complexes were formed by the CC-related proteins (). In the Lut 10 vs TGFβ1 group, the CC-related proteins were more involved with extracellular space and lysosomal lumen, which is consistent with the KEGG results (). In the Lut 10 vs Lut 2 group, the MF-related proteins were associated with enzyme binding and activity (). Collectively, these findings suggest that Luteolin may be a critical regulator of metabolism and DNA synthesis.
Figure 4 GO analysis of the DEPs in the different comparison pairs. Bubble diagrams of DEPs in GO pathways between (A) The TGFβ1 vs Vehicle group, (B) The Lut 2 vs TGFβ1 group, (C) The Lut 10 vs TGFβ1 group, and (D) The Lut 10 vs Lut 2 group. Vehicle: blank group; TGFβ1: model group; Lut 2: low dose group; Lut 10: high dose group. The Rich factor is displayed on the x-axis, and the p-value is indicated by the color of each circle, the size of which reflects the number of each pathway.
Hereditary Factor Expression Pattern
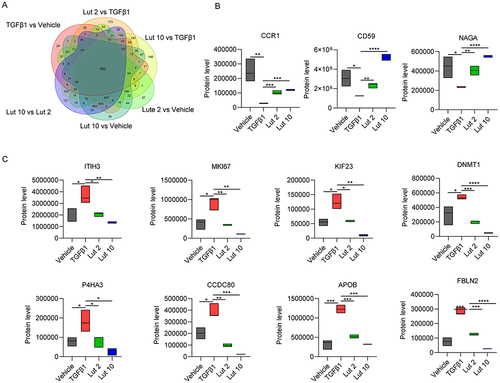
To further investigate the molecular mechanisms by which Luteolin controls liver fibrosis, protein expression patterns were assessed. Two additional comparison pairs (Lut 2 vs Vehicle and Lut 10 vs Vehicle) were also analyzed. A total of 160 different protein overlapped in all six groups (). Further analysis of the different protein identified three proteins, CCR1, CD59, and NAGA, that were downregulated in TGFβ1 treatment, while upregulated both in Lut2 and Lut10 treatment (). Meanwhile, eight proteins, ITIH3, MKI67, KIF23, DNMT1, P4HA3, CCDC80, APOB, FBLN2, that were upregulated in TGFβ1 treatment, while downregulated both in Lut2 and Lut10 treatment ().
Figure 5 Analysis of proteins expression patterns. (A) Venn diagram analysis of the DEPs. (B) The protein level of CCR1, CD59 and NAGA in the four experimental groups. (C) The protein level of ITIH3, MKI67, KIF23, DNMT1, P4HA3, CCDC80, APOB and FBLN2 in the four experimental groups. Vehicle: blank group; TGFβ1: model group; Lut 2: low dose group; Lut 10: high dose group. *P <0.05, **P <001, ***P <0.001.
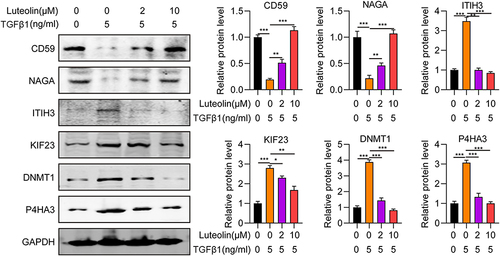
To investigate the accuracy and repeatability of the proteomic analysis, 7 candidate proteins with the two expression patterns defined above were verified by Western blot. Expression of the 7 alternative proteins corresponded with that of proteomic analysis (), validating the robustness and reliability of the experiments. Thus, the candidate DEPs may serve as marker proteins for the diagnosis and prognosis of liver fibrosis.
Figure 6 Validation of differentially expressed proteins by Western blot. *P <0.05, **P <001, ***P <0.001.
Discussion
Fibrosis is a reversible wound-healing reaction that occurs after liver injury; however, end-stage cirrhosis is associated with a high global incidence and death rate.Citation4 Liver fibrosis is a response generated as a result of chronic liver injury due to various factors, such as alcohol consumption, non-alcoholic steatohepatitis (NASH), viral hepatitis [hepatitis B (HBV) and hepatitis C], autoimmune hepatitis, non-alcoholic fatty liver disease (NAFLD), and cholestatic liver diseases. No effective and feasible anti-fibrotic therapies are currently available to prevent progression from fibrosis to cirrhosis to HCC.Citation2 Liver fibrosis is a dynamic process; thus, targeting one pathway in this process may not be enough to induce its reversal. Thus, the validation of non-invasive markers of fibrosis progression and recovery is critically needed to replace biopsy and reduce the necessity of clinical tests.Citation4
This study is the first to evaluate the cytotoxicity of four active components from Deduhonghua7-powder on HSC-T6 cells. Our results showed that Apigenin and Luteolin treatment significantly reduced cell viability in a dose-dependent manner. SYPA treatment had no effect on HSC-T6 cell viability, while HSYPA had a limited impact on HSC-T6 cell survival. TGF-β1 is one of the most important fibrosis mediators, which activates the Smad-dependent pathway through the phosphorylation of Smad2/3 and the translocation of p-Smad2/3 to the nucleus, inducing the transcription of hepatic fibrosis marker genes, such as α-SMA, collagen I, and FN-1. In our study, mRNA expression of the fibrosis-related genes, αSMA and COL1A1, was shown to be high in TGFβ1 treated HSC-T6 cells, but greatly decreased in the 200 µM HSYPA, 20 µM Apigenin, and 10 µM Luteolin groups. Similarly, Luteolin treatment was shown to significantly reduce αSMA and COL1A1 protein expression in HSC-T6 cells. Liver histopathology can be used to directly visualize histopathological changes and is important for assessing the existence and severity of fibrosis.Citation21 A previous study demonstrated that activated hepatic stellate cells (aHSCs) are the source of myofibroblasts in a carbon tetrachloride (CCl4)-induced liver fibrosis model, whereas portal fibroblasts give rise to myofibroblasts in the cholestatic liver. The rat experiments performed here confirmed that Luteolin significantly alleviated CCl4-induced inflammatory reactions, as shown by H&E and Masson staining, and reduced serum ALT, AST, and ALP levels.
Proteomics analysis was performed to gain a full understanding of the biological effects of Luteolin and a total of ~5000 proteins were obtained. KEGG analysis showed that metabolic pathways involving various amino acids and enzymes were fully enriched. Base metabolism required for DNA synthesis, DNA replication and mismatch repair, and lysosomal metabolism were also involved. GO analysis revealed that heparin, protein or protease, and laminin binding and activity involving various desaturase or transmembrane transporters were mainly involved in MF. In addition, the gene expression pattern of 160 overlapped DEGs was confirmed in the four basic groups, Vehicle, TGFβ1, Lut 2, and Lut 10, and eleven proteins were classified into two expression patterns. CCR1, CD59, and NAGA were in the high-low-high-high category while ITIH3, MKI67, KIF23, DNMT1, P4HA3, CCDC80, APOB, and FBLN2, were in the low-high-low-low category, indicating that CCR1, CD59, and NAGA may play tumor promoter roles while ITIH3, MKI67, KIF23, DNMT1, P4HA3, CCDC80, APOB, and FBLN2, play tumor suppressor roles in liver fibrosis. The expression of these proteins was further confirmed by Western blot. Thus, the candidate DEPs may serve as marker proteins for the diagnosis and prognosis of liver fibrosis.
Conclusion
In summary, the current study confirmed the protective effect of Luteolin on hepatic fibrosis stimulated by TGFβ1 and CCl4. Eleven DEPs associated with liver fibrosis were identified using proteomic analysis, with three proteins, CCR1, CD59, and NAGA, exerting harmful effects on liver fibrosis and eight proteins, ITIH3, MKI67, KIF23, DNMT1, P4HA3, CCDC80, APOB, and FBLN2, having protective effects. These DEPs could serve as potential markers or targets for the treatment of liver fibrosis.
Ethical Approval
All animal experiments and operations were approved by the Institutional Animal Care and carried out under the principles and rules of the Medical Ethics Committee of Affiliated Hospital of Inner Mongolia Minzu University (No. NM-LL-2022-08-07-01). The study is compliant with all relevant ethical regulations regarding animal research.
Disclosure
The authors report no conflicts of interest in this work.
Acknowledgments
This work was supported by grants from the National Natural Science Foundation of China (No. 81760908).
References
- Dong S, Cai FF, Chen QL, et al. Chinese herbal formula Fuzheng Huayu alleviates CCL4-induced liver fibrosis in rats: a transcriptomic and proteomic analysis. Acta Pharmacol Sin. 2018;39(6):930–941. doi:10.1038/aps.2017.150
- Thompson AI, Conroy KP, Henderson NC. Hepatic stellate cells: central modulators of hepatic carcinogenesis. BMC Gastroenterol. 2015;15:63. doi:10.1186/s12876-015-0291-5
- Carloni V, Luong TV, Rombouts K. Hepatic stellate cells and extracellular matrix in hepatocellular carcinoma: more complicated than ever. Liver Int. 2014;34(6):834–843. doi:10.1111/liv.12465
- Lee YA, Wallace MC, Friedman SL. Pathobiology of liver fibrosis: a translational success story. Gut. 2015;64(5):830–841. doi:10.1136/gutjnl-2014-306842
- Semela D, Das A, Langer D, Kang N, Leof E, Shah V. Platelet-derived growth factor signaling through ephrin-b2 regulates hepatic vascular structure and function. Gastroenterology. 2008;135(2):671–679. doi:10.1053/j.gastro.2008.04.010
- Yagai T, Miyajima A, Tanaka M. Semaphorin 3E secreted by damaged hepatocytes regulates the sinusoidal regeneration and liver fibrosis during liver regeneration. Am J Pathol. 2014;184(8):2250–2259. doi:10.1016/j.ajpath.2014.04.018
- Yin C, Evason KJ, Asahina K, Stainier DY. Hepatic stellate cells in liver development, regeneration, and cancer. J Clin Invest. 2013;123(5):1902–1910. doi:10.1172/JCI66369
- Chen XF, Ji S. Sorafenib attenuates fibrotic hepatic injury through mediating lysine crotonylation. Drug Des Devel Ther. 2022;16:2133–2144. doi:10.2147/DDDT.S368306
- Liu X, Mi X, Wang Z, et al. Ginsenoside Rg3 promotes regression from hepatic fibrosis through reducing inflammation-mediated autophagy signaling pathway. Cell Death Dis. 2020;11(6):454. doi:10.1038/s41419-020-2597-7
- Zhan SS, Jiang JX, Wu J, et al. Phagocytosis of apoptotic bodies by hepatic stellate cells induces NADPH oxidase and is associated with liver fibrosis in vivo. Hepatology. 2006;43(3):435–443. doi:10.1002/hep.21093
- Canbay A, Feldstein AE, Higuchi H, et al. Kupffer cell engulfment of apoptotic bodies stimulates death ligand and cytokine expression. Hepatology. 2003;38(5):1188–1198. doi:10.1053/jhep.2003.50472
- Llovet JM, Ricci S, Mazzaferro V, et al. Sorafenib in advanced hepatocellular carcinoma. N Engl J Med. 2008;359(4):378–390. doi:10.1056/NEJMoa0708857
- Chen XF, Wang Y, Ji S, et al. Hepatoprotective efficacy and interventional mechanism of Qijia rougan decoction in liver fibrosis. Front Pharmacol. 2022;13:911250. doi:10.3389/fphar.2022.911250
- Narisu B, Han Z. Effect of deduhonghua-7 powder on the liver function and fibrosis in rats with experimental liver Fibrosis. J Tradit Chin Med. 2012;2012:1.
- Gao LN, Yan K, Cui YL, Fan GW, Wang YF. Protective effect of Salvia miltiorrhiza and Carthamus tinctorius extract against lipopolysaccharide-induced liver injury. World J Gastroenterol. 2015;21(30):9079–9092. doi:10.3748/wjg.v21.i30.9079
- Fu H, Liu X, Jin L, et al. Safflower yellow reduces DEN-induced hepatocellular carcinoma by enhancing liver immune infiltration through promotion of collagen degradation and modulation of gut microbiota. Food Funct. 2021;12(21):10632–10643. doi:10.1039/d1fo01321a
- Chen Z, Liu L, Liu Y, et al. Hydroxysafflor yellow A induces autophagy in human liver cancer cells by regulating Beclin 1 and ERK expression. Exp Ther Med. 2020;19(4):2989–2996. doi:10.3892/etm.2020.8552
- Ao H, Feng W, Peng C. Hydroxysafflor yellow a: a promising therapeutic agent for a broad spectrum of diseases. Evid Based Complement Alternat Med. 2018;2018:8259280. doi:10.1155/2018/8259280
- Min F, Sun H, Wang B, et al. Hepatoprotective effects of hydroxysafflor yellow A in D-galactose-treated aging mice. Eur J Pharmacol. 2020;881:173214. doi:10.1016/j.ejphar.2020.173214
- Wu S, Yue Y, Tian H, et al. Carthamus red from Carthamus tinctorius L. exerts antioxidant and hepatoprotective effect against CCl(4)-induced liver damage in rats via the Nrf2 pathway. J Ethnopharmacol. 2013;148(2):570–578. doi:10.1016/j.jep.2013.04.054
- Menggensilimu HY, Zhao C. Anti-liver fibrosis effect of total flavonoids from Scabiosa comosa Fisch. ex Roem. et Schult. on liver fibrosis in rat models and its proteomics analysis. Ann Palliat Med. 2020;9(2):272–285. doi:10.21037/apm.2020.02.29
- Ma JN, Bolraa S, Ji M, He QQ, Ma CM. Quantification and antioxidant and anti-HCV activities of the constituents from the inflorescences of Scabiosa comosa and S. tschilliensis. Nat Prod Res. 2016;30(5):590–594. doi:10.1016/j.jep.2013.04.054
- Ji J, Yu Q, Dai W, et al. Apigenin alleviates liver fibrosis by inhibiting hepatic stellate cell activation and autophagy via TGF-beta1/Smad3 and p38/PPARalpha pathways. PPAR Res. 2021;2021:6651839. doi:10.1155/2021/6651839
- Chen CY, Peng WH, Wu LC, Wu CC, Hsu SL. Luteolin ameliorates experimental lung fibrosis both in vivo and in vitro: implications for therapy of lung fibrosis. J Agric Food Chem. 2010;58(22):11653–11661. doi:10.1021/jf1031668
- Domitrovic R, Jakovac H, Tomac J, Sain I. Liver fibrosis in mice induced by carbon tetrachloride and its reversion by luteolin. Toxicol Appl Pharmacol. 2009;241(3):311–321. doi:10.1016/j.taap.2009.09.001
- Nakayama A, Morita H, Nakao T, et al. A food-derived flavonoid luteolin protects against angiotensin II-induced cardiac remodeling. PLoS One. 2015;10(9):e0137106. doi:10.1371/journal.pone.0137106
- Dong S, Chen QL, Song YN, et al. Mechanisms of CCL4-induced liver fibrosis with combined transcriptomic and proteomic analysis. J Toxicol Sci. 2016;41(4):561–572. doi:10.2131/jts.41.561