
Abstract
Purpose
Protein tyrosine phosphatases (PTPs) play an essential way in diseases including cancer, obesity, diabetes and autoimmune disorders. As a member of PTPs, low molecular weight PTP (LMPTP) has been a well-recognized anti-insulin resistance target in obesity. However, the number of reported LMPTP inhibitors is limited. Our research aims to discover a novel LMPTP inhibitor and evaluate its biological activity against insulin resistance.
Methods
A virtual screening pipeline based on the X-ray co-crystal complex of LMPTP was constructed. Enzyme inhibition assay and cellular bioassay were used to evaluate the activity of screened compounds.
Results
The screening pipeline rendered 15 potential hits from Specs chemical library. Enzyme inhibition assay identified compound F9 (AN-465/41163730) as a potential LMPTP inhibitor with a Ki value of 21.5 ± 7.3 μM. Cellular bioassay showed F9 could effectively increase the glucose consumption of HepG2 cells as a result of releasing insulin resistance by regulating PI3K-Akt pathway.
Conclusion
In summary, this study presents a versatile virtual screening pipeline for potential LMPTP inhibitor discovery and provides a novel-scaffold lead compound that is worthy of further modification to get more potent LMPTP inhibitors.
Graphical Abstract
Introduction
Protein tyrosine phosphorylation, regulated by protein tyrosine kinases (PTKs) and protein tyrosine phosphatases (PTPs), is essential for numerous cellular processes like cell growth, differentiation, migration and survival.Citation1,Citation2 Selective modulation of the signaling pathway involved in protein tyrosine phosphorylation has been an effective strategy for therapeutic intervention due to the successful clinical application of various PTK inhibitors. As counterparts of PTKs, PTPs have attracted more attention as the potential therapeutic targets for different diseases, including cancer,Citation3 obesity,Citation4 diabetesCitation5,Citation6 and autoimmune disorders.Citation7
More than 100 PTPs have been discovered, and most of them share the similar active site sequence C(X)5R(S/T), which specifically binds the phosphoryl group of their substrates.Citation8,Citation9 Low molecular protein tyrosine phosphatase (LMPTP) is the only member of the Class II subfamily of PTPs besides the recently reclassified SSU72.Citation10 Abundant studies suggest that LMPTP is a potential target for alleviating insulin resistance in obesity and diabetes.Citation11,Citation12 LMPTP knockdown by antisense oligonucleotides effectively decreases insulin resistance in diet-induced obese (DIO) mice by enhancing insulin receptor phosphorylation.Citation13
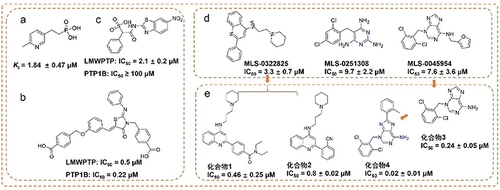
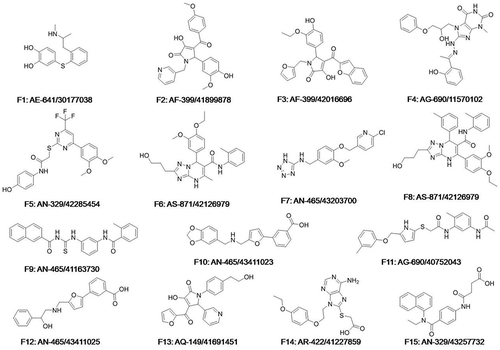
Given the insulin receptor dephosphorylating function of LMPTP, developing small molecular inhibitors of LMPTP as insulin sensitizers has attracted considerable interest from researchers.Citation14 However, most reported inhibitors, containing phosphateCitation15 (), carboxylicCitation16 () and sulfonic groupCitation17 () targeting LMPTP active site exhibit poor selectivity and druggability because of the highly charged and homologous characteristics of LMPTP.Citation18,Citation19 Hence, developing non-active site inhibitors would be the solution to the problems above-mentioned ( and ).Citation20,Citation21
Figure 1 The representative LMPTP inhibitors. (a–c) Representative active site inhibitors of LMPTP; (d and e) representative non-active site inhibitors of LMPTP.
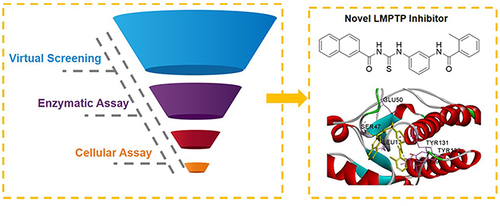
Herein, a virtual screening pipeline was developed based on the X-ray structure of LMPTP complexes,Citation20 and a novel LMPTP non-active site inhibitor was identified through this method. Enzyme inhibition assay found that the compound displayed a moderate LMPTP inhibitory activity through an uncompetitive mechanism of action. Cellular studies demonstrated that this compound effectively alleviated HepG2 insulin resistance by inhibiting LMPTP. Our findings revealed a novel chemical structure to inhibit LMPTP, which could be a potential lead compound for further discovery of novel-scaffold LMPTP inhibitors.
Materials and Methods
Materials
All the potential hit compounds were purchased from Topscience (China). Dulbecco’s modified Eagle’s medium (DMEM) and phosphate buffer saline (PBS) were from Servicebio (China). Recombinant human LMPTP enzyme (isoform 1) was purchased from Sino Biological (China). The insulin, Glucose Detection Kit and Bicinchoninic Acid (BCA) Protein Quantitation Kit were from Beyotime (China). HepG2 cell lines were obtained from the Cell Culture Center of Peking Union Medical College (China).
Virtual Screening of Potential Hit Compounds
General Workflow for Virtual Screening
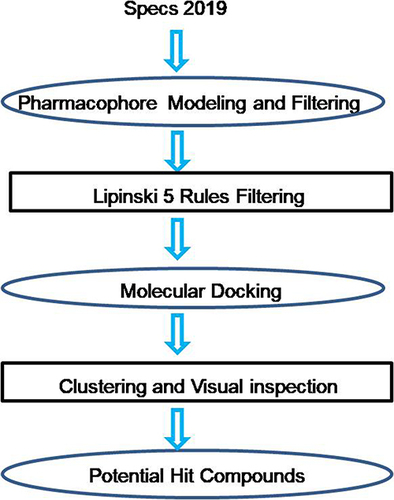
The workflow of discovery of LMPTP inhibitors () includes four consecutive steps: (1) filtering by pharmacophore model constructed by receptor–ligand interaction; (2) filtering by Lipinski 5 Rules; (3) molecular docking and (4) clustering the visually picked compounds and making the final decision to construct the potential hit compound dataset. Specs chemical library (containing approximately 210000 compounds) was used as the input of this workflow.
Scheme 1 The general workflow for discovering LMPTP inhibitors.
Pharmacophore Modeling and Filtering
Receptor-Ligand Pharmacophore Generation
The X-ray structure of LMPTP (PDB number: 7KH8) was retrieved and downloaded from Protein Data Bank (PDB). The protein was prepared by adding hydrogen atoms, modifying chain termini, correcting nonstandard names, repairing incomplete residues and protonating automatically by the “Clean Protein” module of DS2019.Citation22 Then, the pharmacophores were generated by “Receptor- Ligand Pharmacophore Generation” in DS2019. The minimum and maximum numbers of pharmacophore features were set as 4 and 6. All other parameters were default values.
Construction of a Multi-Conformation Ligand Database
All the compounds in Specs2019 were prepared by protonating at the pH range from 7.3 to 7.5 and all potential isomers were produced. Then, the entities were converted to a multi-conformation ligand database by the “Build 3D Database” module with default parameters.
Pharmacophore Filtering
The database was filtered by all pharmacophores, respectively, with “Search 3D Database” module in DS2019. Entities with FitValue >2.5 were retained after filtering.
Lipinski and Veber Rules Filtering
The compounds filtered by pharmacophore models were further filtered by the “Filter by Lipinski and Veber Rules” module in DS2019.Citation23 The parameter of molecular weight was altered to 700.
Molecular Docking
All the chemical entities produced by the “Prepare Ligand” module in DS2019 were docked to the prepared LMPTP structure using “CDOCKER”. The binding site was defined as a sphere centered on the ligand presenting in LMPTP co-crystal complex. The top 2 hits were retained and CHARMm was set as the forcefield, all other parameters were set as default values.
Clustering and Visual Picking
“- CDOCKER_INTERACTION_ENERGY” values of the top 500 entities were ranked. The highest-scoring pose of each compound was visually inspected with the criteria: 1) well superposed with the original ligand; 2) interaction with Tyr131 or Tyr132 and Asp129.
Biological Evaluation
Enzyme Inhibition Assays
Inhibitory Rate Assay: Phosphatase assays were performed in the buffer solution containing 50 mM bis-tris and 1 mM DTT at a pH of 6.5.Citation24 All the compounds with the final concentration of 25 μM were incubated with LMPTP for 10 minutes at 37°C (solution without tested compounds was set as blank control). Para-nitrophenyl phosphate (pNPP) was added with the final concentration of 7 mM. Further incubation for 30 minutes and the reaction was stopped by adding 3 M NaOH solution. The absorbance was measured at 405 nm. The inhibitory rate was calculated by the following equation:
In which A(Test) means the absorbance of tested compounds; A(control) means the absorbance of blank control.
Ki value determination: The Ki value of F9 was also determined. The final concentrations of F9 were set as 25 μM, 20 μM, 15 μM and 0 μM. Concentrations of substrate pNPP were set as 13.3 mM, 10 mM, 6.6 mM, 5 mM and 3.3 mM. The absorbance at 405 nm of each concentration of F9 with different amounts of pNPP was measured to draw a double reciprocal curve, and the Ki value was calculated by GraphPad Prism.
Cytotoxicity Evaluation
3-(4,5-Dimethylthiazol-2-yl)-2,5-diphenyltetrazolium bromide (MTT) assay was carried out to evaluate the cytotoxicity of compound F9 against HepG2 cells. Cells in the exponential growth phase were transferred to 96-well plate and incubated overnight at 37°C with 5% carbon dioxide. A series concentration of F9 range from 1000 to 3.9 μM with doubling dilution was added and incubated for 36 hours. The MTT solution was added and incubated for 4 hours. The formazan crystals were dissolved with DMSO and the absorbance at 570 nm was measured.Citation25,Citation26
Anti-Insulin Resistance Activity in the HepG2 Cellular Model
The anti-insulin resistance activity of F9 was evaluated by the change of glucose consumption of HepG2 before and after F9 treatment. The insulin-resistant model of HepG2 cells was established by 72 hours’ treatment of 10−6 M insulin DMEM solution (High glucose) in 96-well plate.Citation27,Citation28 After that, the cells were washed with PBS three times, and different concentrations of F9 were added (10 μM, 20 μM, 40 μM and 0 μM as blank control) and further incubated for 24 hours. The cells were rewashed, and high glucose DMEM solution with 10−7 M insulin was added and incubated for 30 minutes. The medium was collected, and the glucose concentration was tested by glucose detection kit according to the instrument. The cell viability in each well was tested by MTT. The modified glucose consumption was calculated by the following equation:
In which, C0 was the glucose concentration of DMEM, C1 was the remaining glucose concentration after cell incubation with or without treatment. V1 was the cell viability after compound treatment, and V2 was the cell viability without compound treatment.
Western Blot
The cell samples were treated with 0, 20 μM and 40 μM of F9 as described above. The samples were washed twice with ice-cold PBS and lysed on ice with pre-cooled RIPA lysis buffer containing protease and phosphatase inhibitor cocktails. The samples were centrifuged at 12,000 × g for 20 min at 4°C. The supernatant was collected, and the total protein levels were determined with a BCA protein quantification kit. Aliquots containing 25 µg proteins were applied to SDS-PAGE gel separation and transferred to polyvinylidene fluoride (PVDF, Millipore) membranes. After blocking with 5% Bovine Serum Albumin (BSA) for 2 h, membranes were incubated with desired primary antibodies overnight at 4°C and then another 1 h at room temperature was needed for secondary antibody incubation. After washing, the protein bands were visualized with an ECL Western blotting substrate kit and observed on a chemi-luminescence imaging system. The protein bands were quantified using ImageJ software (National Institutes of Health, USA).
Results
Pharmacophore Models and Database Filtering
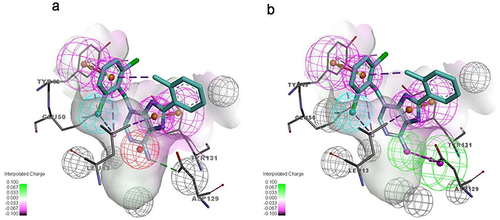
The crystal complex (PDB number: 7KH8) was used for receptor-ligand pharmacophore generation. Fifteen features were identified for the ligand in 7KH8 by DS2019/Catalyst, and 5 of them matched the receptor–ligand interactions. As each pharmacophore was allowed to possess four to six features, two pharmacophore models were automatically generated. As shown in , both models contained four features, including two aromatic rings on the phenyl and purine group, and one hydrophobic feature. The only difference between these two models was that the aminopurine structure was identified as a positive ionizable feature in pharm1, whereas the amino group was considered as the hydrogen bond donor for pharm2. Further investigation of the binding mode of the ligand and LMPTP, we found that a hydrogen bond was formed between the amino group and the amino acid Asp129 which is essential for maintaining the stability of the complex. However, after carefully inspecting LMPTP, we observed that the receptor surface around the amino purine group was negatively charged, so a positive ionizable feature might also be needed. Based on these findings, both pharmacophores were used for pharmacophore filtering.
Figure 2 The pharmacophore models generated based on protein–ligand interactions. (a) Pharmacophore model consisted of aromatic rings (purple), hydrophobic feature (blue) and ionizable feature (red); (b) Pharmacophore model consisted of aromatic rings (purple), hydrophobic feature (blue) and hydrogen bond donor (green).
All chemical entities (3D database built from Specs2019 by protonation and isomerization) were submitted for pharmacophore filtering by pharm1 and pharm2. From all the matched ones, 5299 (including 4370 unique compounds) and 11,713 (including 10,379 unique compounds) entities with FitValue >2.5 were selected for pharm1 and pharm2, respectively. Data sets produced by both pharmacophores were merged and filtered by Lipinski 5 Rules, and a dataset with 11,414 compounds was obtained for further screening.
Potential Hits from Molecular Docking
All the compounds against LMPTP were docked by CDOCKER, 500 top-ranking compounds were retained. Based on their predicted binding affinity in terms of “CDOCKER_INTERACTION_ENERGY” and binding modes, 52 compounds were selected. These compounds were divided into 10 clusters based on FCFP_6 fingerprints to facilitate the selection of structurally diverse compounds. Finally, 15 compounds were selected () as potential hits for experimental validation. All these compounds provided a novel scaffold compared with the ligand coordinated in the LMPTP complex.
Figure 3 The chemical structures of 15 potential hits.
In vitro Enzyme Inhibition Assay
The LMWPTP inhibitory rate was tested for all selected compounds. As shown in , all the compounds displayed a weak to moderate inhibitory activity against LMPTP at 25 μM. The inhibitory rate of compound F9 against LMPTP was around 65%, equivalent to the positive control NaVO3. The preliminary data illustrated the LMPTP inhibitory activity of compound F9.
Figure 4 In vitro LMPTP inhibitory activity of 15 potential hits. (a) In vitro inhibition rate of 15 potential hits and NaVO3 at the concentration of 25 μM; (b) Lineweaver-Burk plot of F9 against LMPTP; (c) Michaelis-menten plot of F9 against LMPTP.
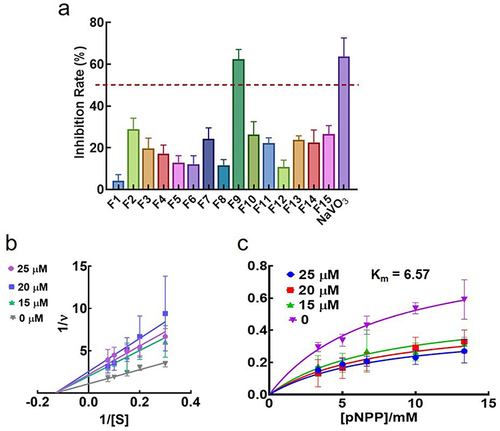
To further validate the inhibitory potency of F9, the Ki value of this compound was further investigated. As shown in and , F9 inhibited LMPTP in an uncompetitive way, and the Ki value was 21.5 ± 7.3 μM. As the concentration of F9 increased, the Km value was constant, around 6.57 mM. Meanwhile, the Vmax decreased. All these results demonstrated compound F9 was a potential LMPTP non-active site inhibitor with moderate LMPTP inhibition potency.
The selectivity of F9 against LMPTP was also evaluated by measuring the inhibitory rate of F9 against protein tyrosine phosphatase 1B (PTP1B) and T-cell protein tyrosine phosphatase (TCPTP). As shown in , F9 displayed a poor inhibitory activity against both PTP1B and TCPTP at the concentration of 25 μM. It illustrates that F9 can selectively inhibit LMPTP to a certain degree.
Table 1 The Inhibitory Rate of Compound 9 Against Other PTPs at the Concentration of 25 μM
Binding Mode Analysis
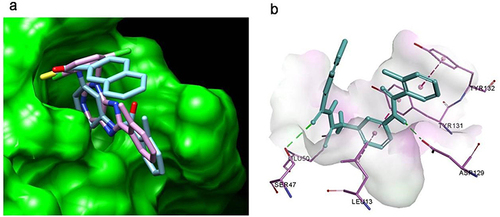
The molecular docking showed that compound F9 bound to LMPTP in a favorable way (). Firstly, it was well superposed with the ligand coordinated in the LMPTP complex. Secondly, it stably occupied the non-active site by forming π-π stacking or other hydrophobic interaction with critical residue Tyr 131 and Tyr 132 and hydrogen bond with Asp129. Besides, it also interacted with residue Ser 47, Glu50 and Leu 13 through hydrogen bonds, salt bridges and hydrophobic interactions, which might enhance the binding of F9 to LMPTP.
Figure 5 Molecular docking result of F9 on LMPTP. (a) The binding pocket and binding pose of F9 to LMPTP; (b) the predicted binding modes of F9 to LMPTP.
Cytotoxicity Evaluation of F9
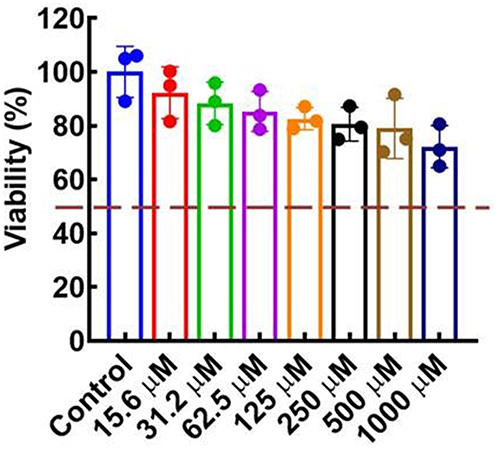
The biosafety was evaluated by measuring the in vitro cytotoxic effects of compound F9 against HepG2 cells. As depicted in , the viability of the HepG2 cells was maintained above 80% even in the presence of a higher concentration of compound F9 up to 500 μM. These results confirmed that compound F9 had good biosafety, which was a good candidate for further modification.
Figure 6 In vitro cellular toxicity of F9 on HepG2 cells.
Anti-Insulin Resistance Activity in the HepG2 Cellular Model
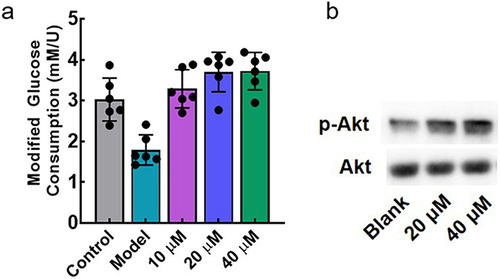
The anti-insulin resistance activity of F9 was determined in the HepG2 cellular model. As shown in , the glucose consumption of the model group was significantly decreased, demonstrating the successful establishment of insulin resistance in HepG2. With the 24 hours treatment of F9, the glucose metabolizing ability of HepG2 was recovered in a concentration-dependent manner. Action mechanism of F9 was further investigated, and we found that F9 could effectively increase the phosphorylation level of Akt (), it meant that F9 could activate the PI3K-Akt pathway by inhibiting LMPTP to release the insulin resistance, which was consistent with other LMPTP inhibitors.
Figure 7 In vitro anti-insulin resistance of F9 in HepG2 cellular model; (a) Anti-insulin resistance effect of F9; (b) anti-insulin resistance mechanism of F9.
Discussion
Selective modulation of signaling pathway involved in protein tyrosine phosphorylation has been an effective strategy for therapeutic intervention. However, due to the high homogeneous characteristic, it is hard to develop a selective inhibitor toward a specific PTP. As one of the potential targets for the treatment of insulin resistance, many efforts have been made to discover selective LMPTP inhibitors. Up to now, most developed inhibitors targeted to the active site of LMPTP, which made them highly charged and led to a poor selectivity and druggability. However, the inhibitor discovered in this work was non-active site targeted without highly charged group and compliance with the Lipinski 5 rules, meant that compound F9 might have a good druggability. Actually, the structure variety of noncompetitive inhibitors is limit, and F9 supplement a novel scaffold for them. Although, the inhibitory activity of F9 is not as potent as reported compounds, it displays a moderate selectivity toward LMPTP and we believe that the inhibitory potency of F9 can be improved by further modification. All these results can illustrate F9 is a potential hit for developing novel LMPTP inhibitors.
Conclusion
In this study, we have established a hierarchical virtual screening pipeline consisting of a ligand-based approach (ie, pharmacophore filtering) and a structure-based approach (ie, molecular docking) to discover novel LMPTP inhibitors. The Specs chemical library was screened by application of this pipeline, and one of 15 potential hits was identified as an effective LMWPTP inhibitor with the Ki value of 21.5 ± 7.3 μM in an uncompetitive inhibitory way. The cellular level evaluation demonstrated that this compound could effectively alleviate insulin resistance by inhibiting LMPTP. All these results illustrate that compound F9 is a potential lead compound worthy of further modification and biological study to access more potent LMPTP inhibitors.
Disclosure
The authors report no conflicts of interest in this work.
Acknowledgments
The work was supported by the Natural Science Fund for Colleges and Universities in Jiangsu Province (22KJB350011).
References
- Zhang ZY. Drugging the undruggable: therapeutic potential of targeting protein tyrosine phosphatases. Acc Chem Res. 2017;50(1):122–129. doi:10.1021/acs.accounts.6b00537
- Tonks NK. Protein tyrosine phosphatases: from genes, to function, to disease. Nat Rev Mol Cell Biol. 2006;7:833–846. doi:10.1038/nrm2039
- Vainonen JP, Momeny M, Westermarck J. Druggable cancer phosphatases. Sci Transl Med. 2021;13(588):588. doi:10.1126/scitranslmed.abe2967
- Stanford SM, Collins M, Diaz MA, et al. The low molecular weight protein tyrosine phosphatase promotes adipogenesis and subcutaneous adipocyte hypertrophy. J Cell Physiol. 2021;236(9):6630–6642. doi:10.1002/jcp.30307
- Kousaxidis A, Petrou A, Lavrentaki V, Fesatidou M, Nicolaou I, Geronikaki A. Aldose reductase and protein tyrosine phosphatase 1B inhibitors as a promising therapeutic approach for diabetes mellitus. Eur J Med Chem. 2020;207:112742. doi:10.1016/j.ejmech.2020.112742
- Nandi S, Saxena M. Potential inhibitors of Protein Tyrosine Phosphatase (PTP1B) Enzyme: promising target for type-II diabetes mellitus. Curr Top Med Chem. 2020;20(29):2692–2707. doi:10.2174/1568026620999200904121432
- Montresor A, Toffali L, Fumagalli L, et al. Activation of protein tyrosine phosphatase receptor type gamma suppresses mechanisms of adhesion and survival in chronic lymphocytic leukemia cells. J Immunol. 2021;207(2):671–684. doi:10.4049/jimmunol.2001462
- Yu ZH, Zhang ZY. Regulatory mechanisms and novel therapeutic targeting strategies for protein tyrosine phosphatases. Chem Rev. 2018;118:1069–1091. doi:10.1021/acs.chemrev.7b00105
- Singh S, Singh Grewal A, Grover R, et al. Recent updates on development of protein-tyrosine phosphatase 1B inhibitors for treatment of diabetes, obesity and related disorders. Bioorg Chem. 2022;121:105626. doi:10.1016/j.bioorg.2022.105626
- Sharma C, Kim Y, Ahn D, Chung SJ. Protein tyrosine phosphatases (PTPs) in diabetes: causes and therapeutic opportunities. Arch Pharm Res. 2021;44:310–321. doi:10.1016/j.bioorg.2022.105626
- Crunkhorn S. Metabolic disease: protein tyrosine phosphatase inhibitor reverses diabetes. Nat Rev Drug Discov. 2017;16(5):312–313. doi:10.1038/nrd.2017.73
- He RJ, Yu ZH, Zhang RY, Zhang ZY. Protein tyrosine phosphatases as potential therapeutic targets. Acta Pharmacol Sin. 2014;35:1227–1246. doi:10.1038/aps.2014.80
- Pandey SK, Yu XX, Watts LM, et al. Reduction of low molecular weight protein-tyrosine phosphatase expression improves hyperglycemia and insulin sensitivity in obese mice. J Biol Chem. 2007;282(19):14291–14299. doi:10.1074/jbc.M609626200
- Ottana R, Maccari R, Ciurleo R, et al. 5-Arylidene-2-phenylimino-4-thiazolidinones as PTP1B and LMW-PTP inhibitors. Bioorg Med Chem. 2009;17(5):1928–1937. doi:10.1016/j.bmc.2009.01.044
- DeSouza SR, Olson MC, Tinucci SL, et al. SAR of non-hydrolysable analogs of pyridoxal 5’-phosphate against low molecular weight protein tyrosine phosphatase isoforms. Bioorg Med Chem Lett. 2020;30:127342. doi:10.1016/j.bmcl.2020.127342
- Maccari R, Ottanà R. Low molecular weight phosphotyrosine protein phosphatases as emerging targets for the design of novel therapeutic agents. J Med Chem. 2012;55(1):2–22. doi:10.1021/jm200607g
- He R, Wang J, Yu ZH, et al. Inhibition of low molecular weight protein tyrosine phosphatase by an induced-fit mechanism. J Med Chem. 2016;59:9094–9106. doi:10.1021/acs.jmedchem.6b00993
- Forghieri M, Laggner C, Paoli P, et al. Synthesis, activity and molecular modeling of a new series of chromones as low molecular weight protein tyrosine phosphatase inhibitors. Bioorg Med Chem. 2009;17(7):2658–2672. doi:10.1016/j.bmc.2009.02.060
- Vidal D, Blobel J, Perez Y, Thormann M, Pons M. Structure-based discovery of new small molecule inhibitors of low molecular weight protein tyrosine phosphatase. Eur J Med Chem. 2007;42(8):1102–1108. doi:10.1016/j.ejmech.2007.01.017
- Stanford SM, Diaz MA, Ardecky RJ, et al. Discovery of orally bioavailable purine-based inhibitors of the low-molecular-weight protein tyrosine phosphatase. J Med Chem. 2021;64(9):5645–5653. doi:10.1021/acs.jmedchem.0c02126
- Stanford SM, Aleshin AE, Zhang V, et al. Diabetes reversal by inhibition of the low-molecular-weight tyrosine phosphatase. Nat Chem Biol. 2017;13:624–632. doi:10.1038/nchembio.2344
- Lian X, Xia Z, Li X, et al. Anti-MRSA drug discovery by ligand-based virtual screening and biological evaluation. Bioorg Chem. 2021;114:105042. doi:10.1016/j.bioorg.2021.105042
- Jahan S, Redhu NS, Siddiqui AJ, et al. Nobiletin as a neuroprotectant against NMDA receptors: an in silico approach. Pharmaceutics. 2022;14(6):1123. doi:10.3390/pharmaceutics14061123
- Witten MR, Wissler L, Snow M, et al. X-ray characterization and structure-based optimization of striatal-enriched protein tyrosine phosphatase inhibitors. J Med Chem. 2017;60(22):9299–9319. doi:10.1021/acs.jmedchem.7b01292
- Kong Q, Li G, Zhang F, et al. N-arylimidazoliums as highly selective biomimetic antimicrobial agents. J Med Chem. 2022;65:11309–11321. doi:10.1021/acs.jmedchem.2c00818
- Xie YP, Sangaraiah N, Meng JP, Zhou CH. Unique carbazole-oxadiazole derivatives as new potential antibiotics for combating gram-positive and -negative bacteria. J Med Chem. 2022;65(8):6171–6190. doi:10.1021/acs.jmedchem.2c00001
- Zhang Q, Kong X, Yuan H, Guan H, Li Y, Niu Y. Mangiferin improved palmitate-induced-insulin resistance by promoting free fatty acid metabolism in HepG2 and C2C12 cells via PPARalpha: mangiferin improved insulin resistance. J Diabetes Res. 2019;2019:2052675. doi:10.1155/2019/2052675
- Zhou X, Wang LL, Tang WJ, Tang B. Astragaloside IV inhibits protein tyrosine phosphatase 1B and improves insulin resistance in insulin-resistant HepG2 cells and triglyceride accumulation in oleic acid (OA)-treated HepG2 cells. J Ethnopharmacol. 2021;268:113556. doi:10.1016/j.jep.2020.113556