
Abstract
Introduction
Autologous stem cell transplantation has emerged as a promising strategy for bone repair. However, the osteogenic potential of mesenchymal stem cells derived from diabetic patients is compromised, possibly due to hyperglycemia-induced senescence. The objective of this study was to assess the preconditioning effects of extracellular vesicles derived from H2O2-stimulated adipose-derived stem cells (ADSCs) and non-modified ADSCs on the osteogenic potential of diabetic bone marrow mesenchymal stem cells (BMSCs).
Methods
Sprague-Dawley (SD) rats were experimentally induced into a diabetic state through a high-fat diet followed by an injection of streptozotocin, and diabetic BMSCs were collected from the bone marrow of these rats. Extracellular vesicles (EVs) were isolated from the conditioned media of ADSCs, with or without hydrogen peroxide (H2O2) preconditioning, using density gradient centrifugation. The effects of H2O2 preconditioning on the morphology, marker expression, and particle size of the EVs were analyzed. Furthermore, the impact of EV-pretreatment on the viability, survivability, migration ability, osteogenesis, cellular senescence, and oxidative stress of diabetic BMSCs was examined. Moreover, the expression of the Nrf2/HO-1 pathway was also assessed to explore the underlying mechanism. Additionally, we transplanted EV-pretreated BMSCs into calvarial defects in diabetic rats to assess their in vivo bone formation and anti-senescence capabilities.
Results
Our study demonstrated that pretreatment with EVs from ADSCs significantly improved the viability, senescence, and osteogenic differentiation potential of diabetic BMSCs. Moreover, in-vitro experiments revealed that diabetic BMSCs treated with H2O2-activated EVs exhibited increased viability, reduced senescence, and enhanced osteogenic differentiation compared to those treated with non-modified EVs. Furthermore, when transplanted into rat bone defects, diabetic BMSCs treated with H2O2-activated EVs showed improved bone regeneration potential and enhanced anti-senescence function t compared to those treated with non-modified EVs. Both H2O2-activated EVs and non-modified EVs upregulated the expression of the Nrf2/HO-1 pathway in diabetic BMSCs, however, the promoting effect of H2O2-activated EVs was more pronounced than that of non-modified EVs.
Conclusion
Extracellular vesicles derived from H2O2-preconditioned ADSCs mitigated senescence in diabetic BMSCs and enhanced their bone regenerative functions via the activation of the Nrf2/HO-1 pathway.
Introduction
Diabetes mellitus, a chronic metabolic disease marked by hyperglycemia, is experiencing a rising prevalence worldwide. It is predicted that the number of diabetic individuals will exceed 700 million by 2045.Citation1 Sustained hyperglycemia causes severe disruption in bone metabolism, rendering diabetic patients more vulnerable to bone fractures and often leading to delayed healing or non-union.Citation2 Unfortunately, traditional bone repair methods, while effective for non-diabetic individuals, often fail to yield satisfactory outcomes in diabetic patients.Citation3 Consequently, the development of innovative therapeutic strategies for repairing bone defects in diabetic patients has become a particularly interesting area of research.
Recently, the transplantation of mesenchymal stem cells (MSCs) has emerged as a promising strategy for bone repair, owing to their high proliferative activity, strong osteogenic potential, and ready availability. Evidences from both preclinical animal experiments and clinical trials have demonstrated that MSCs could improve the osteogenesis microenvironment and promote new bone formation.Citation4,Citation5 However, MSCs derived from diabetic individuals exhibited reduced viability, impaired multipotent capacity, and decreased paracrine function compared with those from healthy donors.Citation6 Additionally, animals receiving diabetic MSCs also demonstrated less bone formation compared to those treated with normal MSCs.Citation7,Citation8 The impaired regenerative potential of diabetic MSCs has been a huge impediment to the clinical application of stem cell therapy in diabetic bone regeneration.
The specific mechanism by which diabetes mellitus impairs the function of MSCs is unclear as of yet, but oxidative stress-induced damage has been considered a major cause.Citation9 Elevated glucose levels result in the accumulation of methylglyoxal and advanced glycation end products (AGEs) within cells, leading to the overproduction of reactive oxygen species (ROS) and increased oxidative stress. The disrupted ROS homeostasis interferes with cell metabolism and accelerates cell senescence, resulting in impaired cell functions.Citation10 Interestingly, it was observed that scavenging excessive ROS in diabetic MSCs could restore their viability as well as therapeutic potential. Peng et al reported that overexpression of the antioxidant enzyme glyoxalase-1 in diabetic MSCs, achieved through lentiviral gene transfection, could reverse their defective proangiogenic function.Citation11 Moreover, a previous research demonstrated that pretreating diabetic MSCs with mitoTEMPO, a mitochondrial ROS scavenger, can enhance their viability, migration, and multi-differentiation potential.Citation12
Extracellular vesicles (EVs) are lipid-bound nanoparticles secreted by almost all living cells, and carry a great many proteins, lipids, and nucleic acids, functioning as bio-information messengers.Citation13 It has been previously demonstrated that EVs derived from mesenchymal stem cells (MSCs) can alleviate oxidative stress-induced damage by activating several antioxidant pathways and inhibiting the production of reactive oxygen species (ROS).Citation14 Furthermore, the antioxidant capacity of EVs can be further enhanced through various strategies, including the preconditioning of parent cells, genetic modification of parent cells, and direct loading of antioxidants into the EVs.Citation15,Citation16 Previous research has demonstrated that preconditioning MSCs with moderate concentrations of H2O2 not only enhances their resistance to oxidative stress but also amplifies the antioxidant effects of their paracrine factors.Citation17,Citation18 However, it remains unclear whether stimulating MSCs with H2O2 could enhance the antioxidant and anti-senescence capabilities of their EVs.Citation18
This study aimed to compare the impact of EVs from H2O2-stimulated adipose-derived stem cells (ADSCs) with those from untreated ADSCs on the senescence and osteogenic potential of diabetic bone marrow mesenchymal stem cells (BMSCs). Diabetic BMSCs were collected from type 2 diabetic rats, and the effects of EV-pretreatment on their viability, migration, osteogenic differentiation, and senescence were evaluated. Furthermore, to explore the mechanism underlying the beneficial effects of EV-pretreatment, the Nrf2/HO-1 pathway was examined by Western blotting. Additionally, diabetic BMSCs pretreated with EVs were implanted into a 5-mm rat cranial defect to observe their in vivo osteogenic potential and anti-senescence function.
Materials and Methods
Establishment of the Type 2 Diabetes Mellitus Rat Model
Type 2 diabetes mellitus was experimentally induced in rats through a high-fat diet in combination with the administration of streptozotocin, as described in our previous work.Citation19 The animal study was approved by the Animal Care and Use Committee of the First Affiliated Hospital of Zhengzhou University (no. 2021–KY-1489). All animal experiments were performed and reported according to the Guidelines for the Use of Laboratory Animals by the National Institutes as well as the ARRIVE guidelines. 8-week-old male Sprague Dawley rats (total n = 58) weighing 190–215 g were purchased from the Animal Center of Zhengzhou University and these animals were housed separately in a stable environment (temperature: 20~25 °C; humidity: 50%~60%; 12:12 hour light-dark cycle) with free access to food and water. Until the experiment ended, the rats in the diabetic group were given a diet containing 20% fat, 45% carbohydrate, and 22% protein. In contrast, the rats in the control group were fed a standard diet comprising 5% fat, 52% carbohydrate, and 20% protein. Diabetes mellitus in rats was induced by intraperitoneal injections of streptozotocin (Sigma; 35 mg/kg). The rats, whose blood glucose concentration remained above 16.7 mmol/L starting one week after injection, were diagnosed with diabetes mellitus.
Isolation and Culture of BMSCs
15 weeks after streptozotocin injection, BMSCs were isolated from the femurs of normal and diabetic rats according to the method used in our previous study.Citation20 Briefly, both ends of the femurs were cut off and the bone marrow was flushed out by fresh culture media (89% DMEM/F12 media, 10% fetal bovine serum, and 1% penicillin-streptomycin). After the flushed liquid had been centrifuged at 300×g for 5 min, the obtained cell pellet was diluted in fresh culture media and cultured in a humidified incubator (37°C and 5% CO2). To maintain the cells, the culture media was replaced every three days, and the normal bone marrow mesenchymal stem cells (N-BMSCs) and diabetic bone marrow mesenchymal stem cells (D-BMSCs) were passaged when they reached over 80% confluence. BMSCs at passage 3 were used for the following research.
Osteogenic Differentiation of BMSCs
BMSCs were seeded onto 24‑well plates at a density of 5×10⁴ cells per well and cultured in osteogenesis-inducing media composed of 89% DMEM/F12, 10% fetal bovine serum, 1% penicillin‑streptomycin, 50 mg/mL of ascorbic acid, 10 mM β‑glycerophosphate, and 100 nM dexamethasone (All Sigma-Aldrich, St Louis, MO, USA). After 21 days of incubation, BMSCs were washed twice with PBS, fixed with 4% paraformaldehyde for 20 min at room temperature, washed twice with distilled water, incubated with 2% Alizarin Red S (ARS) solution (Beyotime Institute of Biotechnology, Shanghai, China) for 10 min at room temperature, and washed twice with distilled water. The ARS staining was extracted with 10% (w/v) cetylpyridinium chloride (Aladdin Scientific Corp., Shanghai, China) and the optical density (OD) value of the solution was measured at 560 nm.
Adipogenic Differentiation of BMSCs
Adipogenic differentiation of BSMCs was performed using a rat bone marrow mesenchymal stem cells adipogenic differentiation kit according to the manufacturer’s protocol (Cyagen Biosciences Inc., CA, USA). After 14 days of culture, fat in BMSCs was visualized using a 60% Oil Red O solution (Beyotime) for 30 minutes. The Oil Red O stain was then extracted with isopropanol (Aladdin), and the OD value of the solution was measured at 520 nm.
Isolation and Culture of ADSCs
ADSCs were collected as described in our previous work.Citation21 Briefly, the groin adipose tissue of healthy rats was harvested under aseptic conditions, and the harvested tissue was washed three times with PBS. Then, the adipose tissue was minced and digested in 0.075% type I collagenase solution for 1 hour on a temperature-controlled shaker at 37°C. The mixture was centrifuged at 300×g for 5 min and the supernatant was discarded. The resulting cell pellet at the bottom of the tube was resuspended in fresh culture media and cultured in the same condition as BMSCs. ADSCs at passage 3 were used for the following research.
Stimulating ADSCs with H2O2
ADSCs were stimulated with H2O2 using a method similar to that described by Zhang et al, with a minor modification.Citation18 When ADSCs reached 50% to 60% confluence, their culture medium was replaced with new medium containing 75 µM H2O2. After a 12-hour incubation, these cells were considered H2O2-activated ADSCs. In contrast, ADSCs in the control group (normal ADSCs) received fresh medium supplemented with an equivalent volume of PBS and were then incubated for the same duration.
Isolation of Extracellular Vesicles
Extracellular vesicles from both H2O2-activated adipose-derived stem cells (H-EVs) and normal adipose-derived stem cells (N-EVs) were harvested through a differential ultracentrifugation technique. After being pretreated with H2O2 or PBS for 12 hours, ADSCs were washed twice with PBS and subsequently incubated in culture media consisting of 10% exosome-free fetal bovine serum for 48 hours. After that, the conditioned media was centrifuged 1000×g for 5 min and an additional 3000×g for 10 min to discard the dead cells and large cell debris. Following that, the obtained supernatant was centrifuged at 2000 g for 10 min and 10,000 g for 70 min. After the centrifugation, the EVs-composed pellet at the bottom of the tube was resuspended in PBS and stored at − 80 °C until use. For fluorescent labeling of EVs, they were incubated with DiI (1,1’-dioctadecyl-3,3,3’,3’-tetramethylindocarbocyanine perchlorate, Sigma) for 10 minutes at room temperature and subsequently ultracentrifuged using the aforementioned method.
Identification of Extracellular Vesicles
The morphology of EVs was observed by transmission electron microscope (Tecnai G2 Spirit TEM, Zeiss, Oberkochen, Germany) at 120 kV, while the size distribution of EVs was evaluated by nanoparticle tracking analysis (NTA, ZetaView PMX 110, Particle Metrix). Expressions of TSG101, CD63, and Calnexin in EVs were examined by Western blotting.
Pretreatment for Diabetic BMSCs
Diabetic BMSCs at passage 3 were incubated with N-EVs (resulting in D-BMSCs-N-EVs) or H-EVs (resulting in D-BMSCs-H-EVs) at a concentration of 100 ng/µL for a duration of 5 days, after which they were utilized for subsequent experiments.
Colony Formation Assay
BMSCs were seeded in 6-well plates at a density of 2×10³ cells per well. Fourteen days after seeding, the cells were fixed with 4% paraformaldehyde (PFA) for 10 minutes, stained with 0.1% crystal violet, and then washed three times with PBS. The number of cells in each aggregate was counted under a microscope, with those containing more than 30 cells being considered colonies.
CCK-8 Assay
BMSCs were seeded onto 96‑well plates at a density of 3×10³ cells per well, and their viability at predetermined time points was examined using a CCK-8 assay kit according to the manufacturer’s protocol (Beyotime).
EdU Staining
BMSCs were seeded on 12‑well plates at a density of 5×10⁴ cells/well. Once the cells reached 70% confluence, they were incubated in a culture medium containing 50 μM EdU for 6 h to mark the newly synthesized DNA. After the cells were fixed in 4% paraformaldehyde for 20 min at room temperature, and the EDU in cells was fluorescently labeled according to the manufacturer’s protocols (Beyotime). Following the cell nucleus was stained by DAPI (Sigma, USA) for 10 min at room temperature. The cells stained with EdU were photographed using a fluorescence microscope (Carl Zeiss Meditec, Jena, Germany), and the number of EdU-positive nuclei (red) in five randomly microscopic fields was counted to calculate the EdU-positive rate.
Cell Apoptosis Assay
When the adipose-derived stem cells (ADSCs) cultured in 6-well plates reached 50% to 60% confluence, their culture medium was replaced with a high-glucose culture medium, with the glucose concentration set at 30 mmol/L. Three days later, the apoptosis rate of cells was detected using an Annexin V-PI apoptosis detection kit according to the manufacturer’s protocol (Beyotime).
Scratch Assay
Briefly, cells were seeded in 6-well plates at a density of 2.5×10⁵ cells per well, and allowed to form a confluent monolayer. A sterile 200 µm-pipette tip was then used to create a linear wound across the center of the monolayer. Afterwards, cells were washed twice with PBS and 1mL of fresh media containing 1% FBS was added to each well. Images of the wound were captured immediately after scratching, and then subsequently at 12- and 24-hours post-scratch.
Transwell Assay
Cells are seeded in the upper chamber at a density of 5×10⁴ cells per well and supplemented with in serum-free media, while the lower chamber is filled with complete culture media. After 24 h of incubation, the cells remaining in the upper chamber were removed by wiping with a swab, while the cells that had migrated through the membrane to the lower chamber were fixed and stained with 0.1% crystal violet. After staining, the cells were rinsed with PBS to remove excess dye and then counted in five randomly selected fields under a microscope. The migration ability of cells is evaluated by quantifying the number of cells that have migrated through the membrane.
Alkaline Phosphatase Activity
BMSCs were seeded onto 24‑well plates at a density of 5×10⁴ cells per well and cultured in osteogenesis-inducing media for 14 days. For the quantitative analysis of Alkaline phosphatase (ALP) activity, BMSCs were lysed, and the ALP activity was measured using a commercial ALP assay kit (Beyotime). For the ALP staining, BMSCs were fixed with 4% paraformaldehyde, and ALP expression was visualized using a BCIP/NBT ALP color development Kit (Beyotime).
Cell Senescence
The activity of β-galactosidase in BMSCs was examined to determine whether the cells are in a senescent state. Briefly, cells in 24-well plates were fixed using 4% paraformaldehyde for 15 minutes at room temperature, washed twice with PBS. Subsequently, 1 mL of freshly prepared SA-β-gal staining solution (Beyotime) was added to each well. The culture plates were then placed in a 37°C incubator at constant temperature and left undisturbed for 16 hours. Cells expressing SA-β-gal activity appeared blue under a microscope. Five fields were randomly selected, and the number of positively stained cells was counted.
ROS, MDA, and SOD Assays
Intracellular ROS level, malondialdehyde (MDA) level, and superoxide dismutase (SOD) activity were measured using commercial kits according to the manufacturer’s protocols (Beyotime).
Real-Time Polymerase Chain Reaction (PCR)
At specific time intervals, TRIzol® reagent (Aladdin, Shanghai, China) was added to each well of the six-well plates, which were then placed on ice. The mixture was gently shaken for one minute, and then collected to synthesize cDNA using an RT kit in accordance with the manufacturer’s instructions (Beyotime). Primers for several genes, including P16, P21, P53, runt-related transcription factor 2 (RUNX2), osteopontin (OPN), osteocalcin (OCN), collagen type I (COL1), and GAPDH, were purchased from BioTNT (BioTNT, Shanghai, China) and listed in . The thermocycling protocol comprised of an initial denaturation at 95°C for 5 min, followed by 40 cycles of denaturation at 95°C for 30 sec, annealing at 58°C for 30 sec, and extension at 72°C for 45 sec. The 2-ΔΔCq method was utilized to calculate the relative mRNA expression, with the GADPH gene serving as the internal control.
Table 1 Primer Sequences for RT-qPCR
Western Blot
Briefly, BMSCs were lysed, and a BCA protein assay Kit (Beyotime) was used to determine the protein concentration. Next, 20 μg/lane of cell lysates were resolved on sodium dodecyl sulfate-polyacrylamide gel electrophoresis and transferred to PVDF membranes with a pore size of 0.22 μm. The transferred membranes were blocked with 5% BSA at room temperature for 2 hours, followed by overnight incubation with primary antibodies (Calnexin, 1:500 dilution, sc-23954, Santa Cruz Biotechnology, CA, USA; CD63, 1:500 dilution, sc-5275, Santa Cruz; TSG101, 1:500 dilution, sc-136111, Santa Cruz; COL1, 1:1000 dilution, AF1840, Beyotime; OCN, 1:1000 dilution, AF6300, Beyotime; RUNX2, 1:1000 dilution, AF2593, Beyotime) at 4°C. After washing twice with PBST containing 0.05% Tween (Aladdin), the membranes were incubated with horseradish peroxidase‑conjugated secondary antibodies for 1 hour at 37°C. Protein bands were detected using ECL reagents and then captured using the Image Quant LAS4000 system (Cytiva, USA). Gel‑Pro Analyzer software (version 4.0; Media Cybernetics, Inc) was used to semi‑quantify the protein expression levels, with the expression of GAPDH serving as the control.
Immunofluorescence Staining
The samples were washed twice with PBS, permeabilized with 0.1% Triton X-100 for 10 min, incubated in a blocking solution of 2% BSA, 2% FBS and 0.01% Triton for 30 min at room temperature. Following that, samples were incubated in with primary antibody for OPN (1:200 dilution, 22952-1-AP, Proteintech, USA), Ki67 (1:500 dilution, GB111141, Servicebio Biotech Inc., Wuhan, China), or P21 (1:100 dilution, AP021, Beyotime) overnight at 4°C according to the manufacturer’s protocols and labeled with secondary antibodies at 37°C for one hour. The cell nuclei were stained with DAPI as described above. After being washed twice with PBS, samples were observed under an inverted fluorescence microscope.
Animal Surgical Procedures
The sample size for the animal studies was determined using the Resource Equation Approach.Citation22 Based on the computational formula, the recommended number of experimental animals for each group ranges from 5 to 7. Consequently, eighteen diabetic rats were randomly assigned to a D-BMSCs group (collagen scaffold + diabetic BMSCs, n=6), a D-BMSCs-N-EVs group (collagen scaffold + diabetic BMSCs pretreated with N-EVs, n=6), and a D-BMSCs-H-EVs group (collagen scaffold + diabetic BMSCs pretreated with H-EVs, n=6). The collagen sponge was acquired from the Pashion Scientific Corp. (Shanghai, China), and each scaffold was loaded with 1×10⁶ cells prior to in vivo transplantation. After the rats had been anesthetized with intraperitoneal injections of a mixture of ketamine (80 mg/kg; Bayer Korea, Seoul, Korea)–xylazine (8 mg/kg; Bayer Korea), their scalp was incised, and the parietal bones were separated by blunt dissection. Afterwards, a trephine drill was used to create a circular defect with a diameter of 5 mm on the rat calvaria under ample saline solution, followed by the delicate implantation of scaffolds with or without cells into the defects. Four weeks after the surgery, rats were humanely euthanized by intraperitoneal injection of sodium pentobarbital solution (Bayer Korea) at a dosage of 250 mg/kg.
Micro-CT Measurements
The bone samples were rinsed twice with PBS before being subjected to micro-CT imaging using a GE Xplore Locus SP Micro-CT system (GE Healthcare, Milwaukee, WI, USA) at a resolution of 10 μm. The imaging data were then processed using CTAn software (manufactured by Bruker Corporation, Kontich, Belgium) to generate three-dimensional reconstructions and to analyze new regenerated bone volumes.
Pathological Staining
Following the Micro-CT scan, the bone samples were fixed with 4% paraformaldehyde at room temperature for 3 days and then decalcified in 10% EDTA (Beyotime) at 37 °C for 4 weeks. After decalcification, the specimens were dehydrated with a series of increasing ethanol concentration of (50%, 70%, 80%, 90%, and 100%) and embedded in paraffin wax (Aladdin). The embedded specimens were then cut into sections with a thickness of 5 μm using a microtome, which were subsequently incubated overnight at 60°C, stained with both hematoxylin and eosin (H&E) or Masson, and photographed under a light microscope.
Statistical Analysis
The data were expressed as the mean ± standard deviation. QQ plots and further analyses were conducted using the R programming language (R version 4.2.3) to assess data distribution. The significance between two groups was evaluated using the Welch t-test. For three or more groups, significance was determined by Welch-ANOVA followed by the Games-Howell post-hoc test (sample size = 6 in each group) or permutation tests (sample size = 5 in each group). A statistically significant difference was considered when P-value was less than 0.05.
Results
Establishment of a Diabetic Rat Model
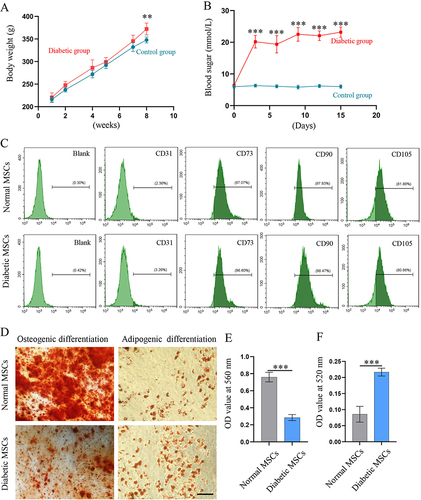
Type 2 diabetes mellitus in rats was induced through the administration of streptozotocin in combination with a high-fat diet. After being fed a high-fat diet for 8 weeks, the average body weight of the intervention group was found to be significantly higher than that of the control group (p=0.001) (). As shown in , the rats’ blood glucose levels rapidly increased in the few days following the STZ injection and remained persistently higher than 16.7 mmol/L in the following 2 weeks (p<0.001).
Figure 1 Characterization of BMSCs from type 2 diabetic rats. Body weights (A) and blood glucose levels (B) of rats in the control and diabetic groups (n = 8). (C) The expressions of CD31, CD73, CD90 and CD105 in BMSCs at passage 3 were detected by flow cytometric analyses. (D) The osteogenic and adipogenic differentiation of BMSCs was confirmed by Alizarin Red S and Oil Red O (scale bar: 100 μm). Semi-quantitative analyses for the (E) osteogenic and (F) adipogenic differentiation of BMSCs (n = 6).
Characterization of BMSCs from Diabetic and Normal Rats
The expression of surface markers and the multipotent differentiation capability of BMSCs were evaluated to characterize their properties. Both diabetic and normal BMSCs were positive for MSCs surface markers (CD73, CD90, and CD105), but negative for the endothelial cell marker CD31 (). Furthermore, osteogenic and adipogenic differentiation assays were conducted to confirm the multipotentiality of BMSCs (). Interestingly, while diabetic BMSCs exhibited poorer osteogenic differentiation compared to normal BMSCs (P<0.001) (), they demonstrated stronger adipogenic differentiation than their normal counterparts (P<0.001) ().
Characterization of EVs from ADSCs
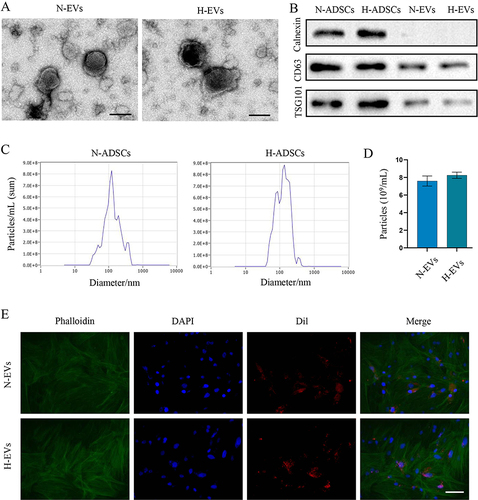
As shown in the TEM images presented in , H2O2 preconditioning did not alter the morphology of EVs, and most of the N-EVs and H-EVs showed a classic cup-shaped or sphere-shaped morphology. Western blot indicated that both two EVs were rich in CD63 (transmembrane/lipid-bound protein), and TSG101 (cytosolic protein), but nearly did not express calnexin, which is an endoplasmic reticulum marker (). NTA analysis illustrated that most of N-EVs and H-EVs had a particle size around 120 nm and pretreatment with H2O2 did not obviously affect the particle size distribution (). The concentration of N-EVs was slightly lower than that of the H-EVs, however, no significant difference was observed between the two groups (P=0.069) (). To verify the internalization efficacy of these EVs, they were labeled with Dil and added to the culture medium of MSCs. As shown in , a considerable number of EVs were taken up by MSCs after one-hour incubation.
Figure 2 Characterization of EVs for ADSCs with or without H2O2 preconditioning. (A) TEM images of N-EVs and H-EVs (Scale bar: 100 nm). (B) The expression of calnexin, CD63 and TSG101 in cells and EVs were determined by Western blotting. Size (C and D) particle concentration of N-EVs and H-EVs from equivalent cells were detected by NTA (n = 5). (E) A considerable number of DiI-labeled N-EVs and H-EVs were taken up by BMSCs after 1 hour of incubation (scale bar: 50 μm).
H-EVs Pretreatment Enhanced the Viability of Diabetic BMSCs
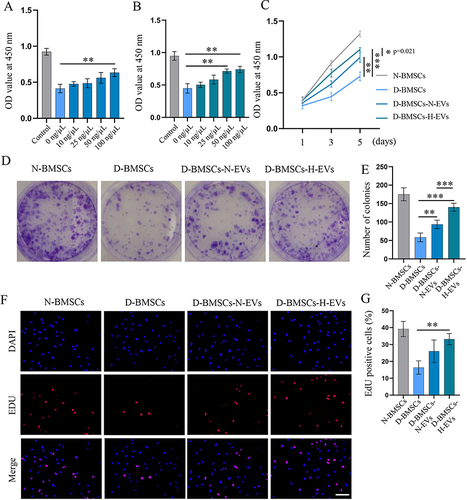
The effects of EVs on the viability of BMSCs were verified through the CCK-8 assay, clonogenic assay, and EdU staining. CCK-8 assay showed that EVs from both normal and H2O2-activated ADSCs increased the OD value of diabetic BMSCs in a dose-dependent manner ( and ). EVs at 100 ng/µL significantly increased the viability of diabetic BMSCs (p=0.003), while H-EVs at 50 ng/µL and 100 ng/µL significantly enhanced the viability of diabetic BMSCs (50 ng/µL: p=0.003; 100 ng/µL: p=0.001). Moreover, the OD value of diabetic BMSCs pretreated with extracellular vesicles was significantly higher than that of the non-modified diabetic BMSCs after a 5-day incubation (D-BMSCs-N-EVs: p=0.001; D-BMSCs-H-EVs: p<0.001) (). The clonogenic assay revealed that the diabetic BMSCs stimulated by H-EVs exhibited substantially higher reproductive viability and formed significantly more colonies compared to both non-modified diabetic BMSCs (p<0.001) and the cells preconditioned with N-EVs (p<0.001) ( and ). EdU staining also demonstrated that the percentage of actively proliferative cells in the D-BMSCs-H-EVs was significantly higher than that of the D-BMSCs group (p=0.001) ( and ).
Figure 3 EV-preconditioning enhanced the viability of diabetic BMSCs. Effects of different concentrations of N-EVs (A) and H-EVs (B) on the viability of diabetic BMSCs after 3-day incubation was examined by CCK8 assay (n = 5). (C) The viability of diabetic BMSCs pretreated with EVs at different timepoints was detected by CCK8 assay (n = 5). Colonies formed by BMSCs after a-10-day incubation were photographed (D) and counted (E) under a light microscope (n = 6). (F) DdU staining was performed to detect the presence of newly synthesized DNA and the rate of EdU positive cells (G) was calculated (scale bar: 100 μm) (n = 5).
Diabetic BMSCs Preconditioned with H-EVs Exhibited Enhanced Resistance to High Glucose Environment
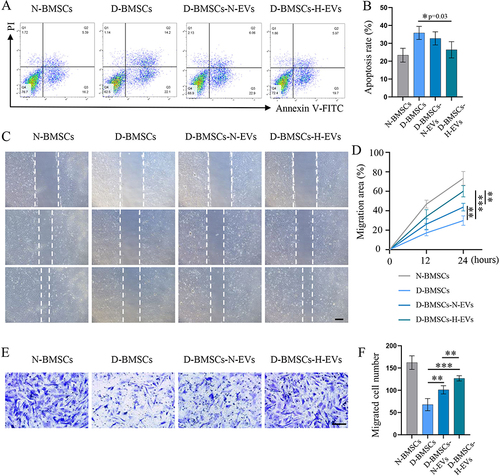
Cells were exposed to a high glucose environment for 3 days and their apoptosis rate was assessed using Annexin V/PI assay. Normal BMSCs had a much lower cell apoptosis rate than diabetic BMSCs when cultured in a high glucose environment, suggesting that the normal BMSCs exhibited greater resistance to damage caused by high glucose compared to the diabetic BMSCs (p=0.008) (). Pretreatment with H-EVs partially restored the resistance of diabetic BMSCs to a high glucose environment. This was evidenced by the significantly fewer apoptotic cells in the H-EVs pretreated group compared to the non-modified diabetic group (p=0.03) ().
Figure 4 Diabetic BMSCs stimulated by H-EVs exhibited enhanced resistance to high glucose and improved migration ability. (A) The apoptosis of BMSCs exposed to high glucose environment was evaluated by the Annexin V/PI assay. (B) Quantitative analysis of cell apoptosis rate (n = 5). (C) representative scratch images of BMSCs after 12 and 24 hours of incubation (scale bar: 200 μm). (D) The migration area of BMSCs was calculated based on the scratch images (n = 5). (E) Cells migrated through the transwell membrane was dyed with crystal violet and (F) counted under a light microscope (n=6, scale bar: 100 μm).
EV-Pretreatment Improved the Migration Ability of Diabetic BMSCs
The migration ability of BMSCs pretreated with or without EVs was evaluated using wound-healing and transwell migration assays. 24 h after scratching, the wound areas in the D-BMSCs-N-EVs and D-BMSCs-H-EVs groups showed a significant reduction compared to the D-BMSCs group (). Quantitative analysis indicated that the migration area of the D-BMSCs-H-EVs group was much higher than that of the D-BMSCs (p<0.001) and the D-BMSCs-N-EVs groups (p=0.005) (). The result of transwell assay was consistent with that of the wound-healing assay: cells that migrated through the transwell membrane in the H-EV-treated group were significantly more than those in the D-BMSCs (p<0.001) and the D-BMSCs-N-EVs groups (p=0.002) ( and ).
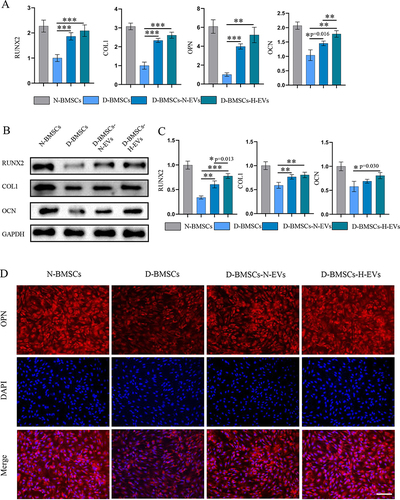
Diabetic BMSCs Stimulated by H-EVs Showed Enhanced Osteogenesis
ALP activity was assessed to examine early osteogenic differentiation, while calcium deposition at the late stage of osteogenic differentiation was detected through ARS staining. ALP staining showed that the H-EV-treated groups showed a much higher ALP expression than the D-BMSCs group after a 14-day osteogenesis induction ( and ). Quantitative analysis also indicated that the cells pretreated with H-EVs exhibited a significantly higher ALP activity than the non-preconditioned MSCs (p<0.001) and cells pretreated the N-EVs (p=0.001) (). Following a 28-day period of osteogenic differentiation induction, calcium deposition in different groups was assessed by ARS staining, revealing that amount of calcium deposition of EV-treated groups was much more than that of the non-preconditioned group ( and ). Semi-quantitative analysis of ARS staining showed that the mineralized matrix in the diabetic MSCs stimulated by H-EVs was much more than that in the non-modified diabetic cells (p<0.001) and cells pretreated the N-EVs (p=0.021) (). Furthermore, PCR revealed that the expressions of the osteogenesis genes, including RUNX2, COL1, OCN and OPN, in the D-BMSCs-N-EVs group were considerably higher than those in the D-BMSCs group (RUNX2: p<0.001; COL1: p<0.001; OPN: p<0.001; OCN: p=0.016) (). Moreover, the gene expression level of OCN in the D-BMSCs-H-EVs was obviously higher than that of the D-BMSCs-N-EVs group (p=0.003). Western blotting indicated that the protein levels of the RUNX2 and COL1 in the D-BMSCs-N-EVs groups D-BMSCs-N-EVs group were significantly higher than those in the D-BMSCs group (RUNX2: p=0.002; COL1: p=0.004) ( and ). Interestingly, all the protein levels of RUNX2, COL1, and OCN in the D-BMSCs-H-EVs was significantly higher than those in the D-BMSCs-N-EVs group (RUNX2: p<0.001; COL1: p=0.001; OCN: p=0.030). OPN staining demonstrated that the expression of OPN proteins was much higher in theEV-pretreated BMSCs compared to the non-preconditioned diabetic cells ().
Figure 5 Diabetic BMSCs stimulated by H-EVs showed enhanced osteogenesis. (A) The expression of ALP in MSCs was visualized using the BCIP/NBT method (scale bar: 100 μm). (B) The photographs of ALP staining and (C) the quantitative analysis of ALP activity in cell lysates demonstrated consistent results. (n = 6) (D) Alizarin Red staining was performed to evaluate calcium deposition in BMSCs (scale bar: 100 μm). (E) The ARS in each well was extracted, (F) and its absorbance was measured at a wavelength of 570 nm for semi-quantitative analysis (n = 6).
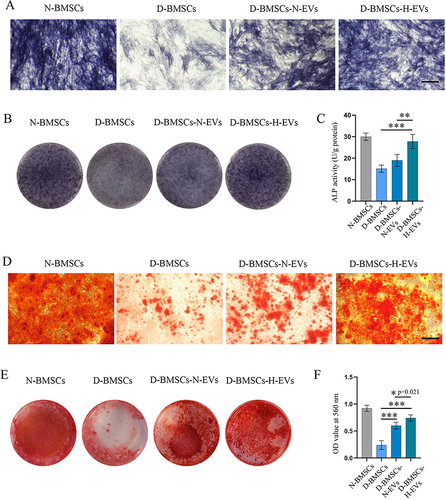
Figure 6 Preconditioning with H-EVs enhanced the expression of osteogenesis-related genes and proteins in diabetic BMSCs. (A) The gene expressions of RUNX2, COL1, OCN and OPN in BMSCs were checked by PCR (n = 5). (B) Western blotting was performed to detect the protein expressions of RUNX2, COL1, and OCN in BMSCs. (C) Semi-quantitative analysis of the content of RUNX2, COL1, and OCN (n = 5). (D) The level of OPN in MSCs was examined using immunofluorescence staining (scale bar: 100 μm).
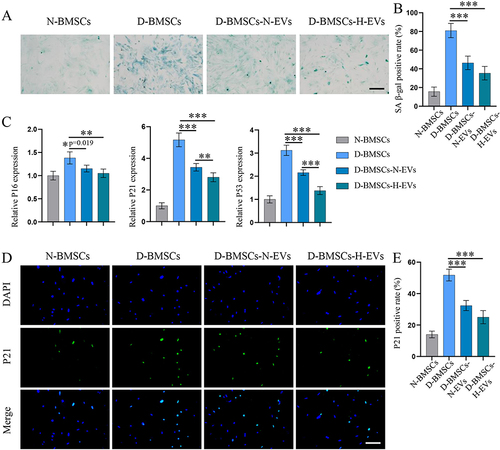
H-EVs Pretreatment Alleviates the Senescence of Diabetic BMSCs
Senescence-associated β-galactosidase- (SA β-gal) staining and PCR for senescence markers were carried out to detect senescence in MSCs. Diabetic MSCs exhibited a significantly higher SA β-gal positive rate than normal BMSCs, but incubation with EVs markedly decreased the SA β-gal positive cell number (D-BMSCs-N-EVs: p<0.001; D-BMSCs-H-EVs: p<0.001) ( and ). Moreover, the EV-pretreated groups showed markedly much lower level of senescence-related genes, including P16 (D-BMSCs-N-EVs: p=0.019; D-BMSCs-H-EVs: p=0.002), P21 (D-BMSCs-N-EVs: p<0.001; D-BMSCs-H-EVs: p<0.001) and P53 (D-BMSCs-N-EVs: p<0.001; D-BMSCs-H-EVs: p<0.001) than the D-BMSCs group (). Interestingly, the gene levels of P21 and P53 in the D-BMSCs-H-EVs groups were significantly lower than those of the D-BMSCs-N-EVs group (P21: p=0.009; P53: p<0.001). Immunofluorescence staining of P21 also demonstrated that the p21-positive cell rate of the EV-treated groups was significantly lower in that of the D-BMSCs group (D-BMSCs-N-EVs: p<0.001; D-BMSCs-H-EVs: p<0.001) ( and ).
Figure 7 H-EVs pretreatment alleviate the senescence of diabetic BMSCs. (A) Representative images of senescence-associated β-galactosidase-(SA β-gal) staining (Scale bar: 100 μm). (B) quantitative analysis of β-gal-positive BMSCs (n = 6). (C) Expression of senescence-related genes, including P16, P21 and P53, was detected by PCR (n = 6). (D) The level of OPN in MSCs was examined using immunofluorescence staining. (E) Quantitative analysis of the proportion of P21-positive cells (n = 5, scale bar: 100 μm).
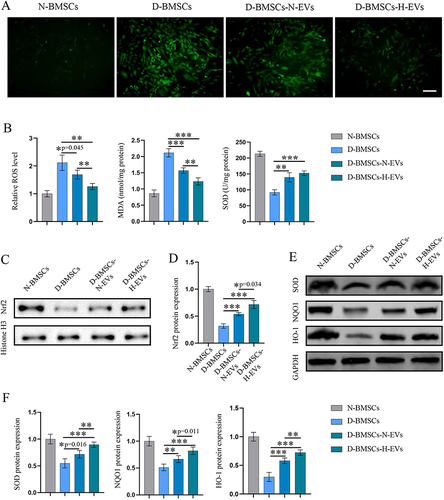
EVs Pretreatment Alleviated Oxidative Stress in Diabetic BMSCs via the Nrf2 Signaling Pathway
As oxidative stress is a major cause of diabetes-induced cellular senescence, we evaluated the oxidative stress by detecting the ROS level, the content of MDA, and SOD viability. As shown in and , diabetic BMSCs exhibited a much higher ROS level and MDA content, but significantly lower SOD viability than normal BMSCs. The EVs, especially the H-EVs, greatly relieved the oxidative stress in diabetic BMSCs, which was confirmed by decreased ROS level (D-BMSCs-N-EVs: p=0.045; D-BMSCs-H-EVs: p=0.001) and MDA content (D-BMSCs-N-EVs: p<0.001; D-BMSCs-H-EVs: p<0.001), as well as increased SOD viability (D-BMSCs-N-EVs: p=0.001; D-BMSCs-H-EVs: p<0.001). Since Nrf2 signaling plays a key role in oxidative defense, the expression of Nrf2 as well as its downstream proteins was determined by Western blot. We observed that EVs pretreatment alleviated the inhibited effects of diabetes on the Nrf2 signaling pathway (D-BMSCs-N-EVs: p<0.001; D-BMSCs-H-EVs: p<0.001) ( and ). As a result, the diabetic BMSCs preconditioned with EVs showed significantly higher expression of NQO1 (D-BMSCs-N-EVs: p=0.006; D-BMSCs-H-EVs: p<0.001), SOD1 (D-BMSCs-N-EVs: p=0.016; D-BMSCs-H-EVs: p<0.001), and HO-1 (D-BMSCs-N-EVs: p<0.001; D-BMSCs-H-EVs: p<0.001) than those non-modified diabetic cells ( and ). Interestingly, the D-BMSCs-H-EVs group exhibited higher levels of Nrf2 (p=0.034), as well as SOD (p=0.005), NQO1 (p=0.011) and HO-1 (p=0.002), than the D-BMSCs-N-EVs group, which may partly explain why the H-EVs had better anti-senescence effects than the N-EVs.
Figure 8 H-EVs pretreatment alleviated oxidative stress and activated the Nrf2 pathway in diabetic BMSCs. (A) The intracellular ROS levels of MSCs was detected using DCFH-DA (scale bar: 100 μm). (B) The relative fluorescence intensity of DCFH-DA was quantified using flow analysis; the MDA level and SOD viability of MSCs were determined using commercial kits (n = 6). (C) Protein expression of Nrf2 in cell nucleus was detected by Western blotting. (D) Semi-quantitative analysis of Nrf2 level (n = 5). (E) Protein expression of SOD, NQO1 and HO-1 in the cytosol. (F) Semi-quantitative analyses of SOD, NQO1 and HO-1 (n = 6).
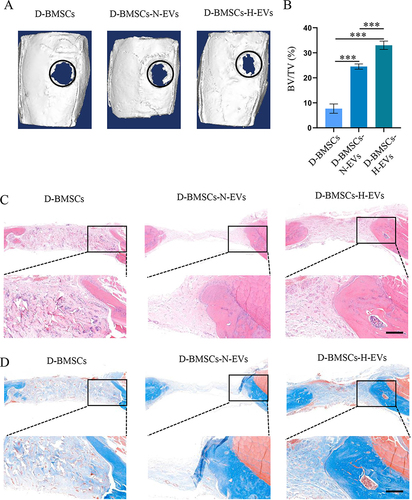
Diabetic BMSCs Pretreated with EVs Accelerated Bone Healing in Type 2 Diabetic Rats
Micro-CT indicated that there was almost no newly formed bone in the D-BMSCs group, whereas a large amount of new bone was found in the D-BMSCs-N-EVs and D-BMSCs-H-EVs groups (). The quantitative analysis indicated the new bone volume of the D-BMSCs-H-EVs group was the greatest among the 3 groups; the newly regenerated bone in the D-BMSCs-N-EVs group was more than that in the D-BMSCs group (p<0.001) but lower than that in the D-BMSCs-H-EVs group (p<0.001) (). The H&E staining and Masson staining demonstrated that only a small amount of new bone tissue could be found in the defect area of the D-BMSCs group and the grafted collagen had not been fully degraded; However, no undegraded materials were found in the D-BMSCs-N-EVs and D-BMSCs-H-EVs groups and a significant amount of new bone tissue had formed in the peripheral defect area of both groups. ( and ).
Figure 9 Diabetic BMSCs stimulated by H-EVs demonstrated increased osteogenic potential in vivo. (A) The 3D reconstruction images of rat calvarial bone 4 weeks after surgery. The black circle indicates the boundary of the initial defect area. (B) Bone volume/total volume (BV/TV) was calculated based on the micro-CT data (n = 6). Sections of tissues in the bone defect area were stained with (C) H&E and (D) Masson. Scale bar: 250 μm.
Diabetic BMSCs Pretreated with EVs Showed Enhanced Anti-Senescence Function in vivo
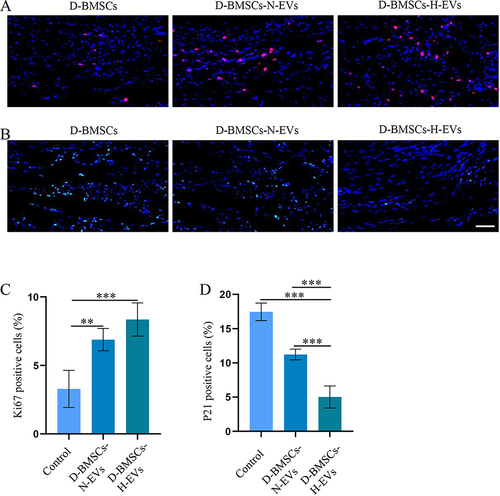
The immunofluorescence staining of Ki67 and p21 was performed to assess cell proliferation and senescence in the defect area. Ki67 protein showed minimal expression in the D-BMSCs group, with higher expression intensities observed in both the D-BMSCs-H-EVs and D-BMSCs-N-EVs groups (). Conversely, p21 protein exhibited elevated expression levels in the D-BMSCs group, while levels were notably reduced in both the D-BMSCs-N-EVs and D-BMSCs-H-EVs groups (). Quantitative analyses of Ki67-positive and P21-positive cells indicated that pretreatment of D-BMSCs with EVs led to increased cell proliferation (D-BMSCs-N-EVs: p=0.001; D-BMSCs-H-EVs: p<0.001) and reduced senescence (D-BMSCs-N-EVs: p<0.001; D-BMSCs-H-EVs: p<0.001) in the defect area ( and ). Although no significant differences in Ki67-positive rates were found between the D-BMSCs-H-EVs and D-BMSCs-N-EVs groups, the P21-positive rate in the D-BMSCs-H-EVs group was significantly lower than that in the D-BMSCs-N-EVs group (p<0.001).
Figure 10 Diabetic BMSCs stimulated by H-EVs demonstrated enhanced anti-senescence function in vivo. (A) Representative immunofluorescent staining of Ki67, and (B) P21 in the defect area. (C) Quantitative analyses of the proportions of Ki67-positive and (D) P21-positive cells in the defect area (n = 6).
Discussion
Various chronic diseases can lead to osteoporosis and delayed bone union, but the underlying mechanisms could vary. For instance, in menopausal women, impaired bone regeneration was commonly attributed to the over-activation of osteoclasts, while in diabetic patients, the main factor was thought to be the reduced osteogenic potential of MSCs and osteoblasts.Citation23 Therefore, restoring the impaired osteogenic potential of diabetic MSCs is crucial to the success of their autologous transplantation. In this study, we discovered that short-term incubation of diabetic BMSCs with EVs derived from healthy ADSCs resulted in improved viability, migration, and osteogenic differentiation of the cells. Furthermore, our Results also showed that preconditioning ADSCs with H2O2 enhanced the antioxidant and anti-senescence properties of their EVs. This enhancement further amplified the beneficial effects of EV pretreatment on diabetic BMSCs.
In this study, diabetes was induced in rats by administering streptozotocin in combination with a high-fat diet. It is a commonly used animal model for Type 2 diabetes, known for its ease of operation and good reproducibility.Citation24 Although MSCs from various tissues possess multipotent capacity, they may exhibit differences in biological behaviors and functions. Comparison to MSCs obtained from other sources, BMSCs exhibit superior osteogenic potential, making them the preferred choice for stem cell transplantation in bone repair.Citation25,Citation26 However, the complications associated with bone marrow aspiration, such as pain, bleeding, and infection, may discourage most individuals from donating their BMSCs. As a significant number of cells are required for EVs production, BMSCs may not be a convenient choice for generating EVs. In contrast, ADSCs can be isolated from adipose tissue using minimally invasive extraction methods, and this tissue harbors up to 500 times more stem cells per unit mass than bone marrow. This makes ADSCs a more compelling source of MSC-derived EVs than BMSCs. Thus, we focused on the application of EVs derived from ADSCs to restore the impaired function of diabetic BMSCs.
In the present work, we observed that, even after being removed from the hyperglycemic environment and cultured in low-glucose medium for a sustained period, diabetic BMSCs still exhibited decreased viability and reduced osteogenic differentiation compared to normal BMSCs. This suggests that the diabetic microenvironment may have long-term detrimental effects on BMSCs’ function. It has been proposed that the main reason for the irreversible impairment of MSC function is oxidative stress-induced premature senescence.Citation9 Indeed, we also found that diabetic BMSCs had a much higher intracellular ROS level and an elevated β-gal positivity rate compared to normal BMSCs. Interestingly, incubating diabetic BMSCs with EVs from ADSCs for 5 days significantly relieved their oxidative stress and decreased the number of β-gal positive cells. Correspondingly, the viability, migration, and osteogenic differentiation of diabetic BMSCs were also markedly enhanced after pretreatment with EVs. Our results agreed with several previous studies, which reported that decreasing ROS production in diabetic MSCs lessened the cellular senescence and improved their biological performance.Citation12,Citation16,Citation27
Accumulating evidence indicated that the therapeutic effect of MSCs could be further enhanced by preconditioning them in a relatively moderate pathological environment, which can initiate the cytoprotective signal pathways of MSCs but does not cause cell apoptosis.Citation28 Recent studies revealed that preincubating MSCs with a low concentration of H2O2 can not only enhance their resistance to oxidative stress but also improve the antioxidant effects of their paracrine factors.Citation17,Citation29 In line with the aforementioned studies, our research revealed that the EVs from H2O2-activated ADSCs exhibit significantly higher levels of antioxidant activity compared to EVs derived from unstimulated cells. It is noteworthy that the diabetic BMSCs stimulated with H2O2-activated EVs showed higher viability and osteogenic differentiation potential than the cells preincubated with normal EVs. These findings provide further evidence that alleviating oxidative stress can lead to improved biological performance in diabetic MSCs, highlighting the crucial role of antioxidant pathways in reversing premature senescence in diabetic MSCs.
Nrf2 is a redox-transcription factor known to play a central role in maintaining biological redox homeostasis. In response to an increase in oxidative stress beyond the physiological level, Nrf2 binds to antioxidant response element (ARE) sites in the cell nucleus, which results in the upregulation of various antioxidant and detoxification genes, including SOD, CAT, NQO1, and HO‐1.Citation30 These genes are able to neutralize ROS, restore cellular homeostasis, and enhance cellular resistance to senescence. Research has shown that activation of the Nrf2 pathway not only helps to prevent cells from oxidative damage but also rejuvenates senescent cells.Citation31 In the present work, we found that both normal and H2O2-activated EVs significantly elevated the expression of Nrf2, suggesting that the anti-senescence effects of EVs on diabetic BMSCs may be due to the activation of the Nrf2 pathway. Notably, we observed that the expression of Nrf2 in the group treated with H2O2-activated EVs was significantly higher than that in the group treated with normal EVs, which may explain why BMSCs treated with H2O2 activated EVs exhibited lower levels of ROS and senescence compared to those treated with normal EVs.
We must acknowledge that this study has several limitations. Firstly, the study did not investigate the effects of EV-pretreatment on the anti-inflammatory properties of diabetic BMSCs. Chronic inflammation is another crucial factor contributing to delayed bone regeneration in diabetes mellitus,Citation32 necessitating further investigation to determine whether reducing senescence in diabetic BMSCs can substantially enhance their immunomodulatory functions. Secondly, considering the variety of bioactive components in MSC-derived EVs, the Nrf2/HO-1 pathway may not be the sole mechanism through which these EVs mitigate cell senescence. Additional studies are necessary to identify other pathways and mechanisms by which MSC-derived EVs may modulate senescence. Thirdly, due to limited funding and time, this study did not fully optimize the method for collecting H-EVs. Further research is essential to assess how variations in H₂O₂ concentration, pre-stimulation duration, and environmental conditions influence the therapeutic effects of H-EVs.
In summary, the results of this study demonstrate the potential of EVs from H2O2-preconditioned adipose-derived stem cells as an effective tool for enhancing the bone regenerative capacity of diabetic BMSCs. Diabetic BMSCs pretreated with H2O2-stimulated EVs demonstrated improved cell viability, migration, and osteogenic differentiation capabilities, while also exhibiting reduced levels of cellular oxidative stress and senescence. The observed beneficial effects of H2O2-stimulated EVs on the behavior of diabetic BMSCs may be attributed to the activation of Nrf2/HO-1 pathway. We hope that these insights will pave the way for the clinical application of autologous BMSCs transplantation in diabetic bone regeneration.
Author Contributions
All authors made a significant contribution to the work reported, whether that is in the conception, study design, execution, acquisition of data, analysis and interpretation, or in all these areas; took part in drafting, revising or critically reviewing the article; gave final approval of the version to be published; have agreed on the journal to which the article has been submitted; and agree to be accountable for all aspects of the work.
Disclosure
The authors declare that there is no conflicts of interest regarding the publication of this paper.
Acknowledgments
The authors acknowledge the assistance received in accessing analytical instruments from the Translational Medicine Center at the First Affiliated Hospital of Zhengzhou University.
Data Sharing Statement
The data used to support the findings of this study are available from the corresponding author upon request.
Additional information
Funding
References
- Standl E, Khunti K, Hansen TB, Schnell O. The global epidemics of diabetes in the 21st century: current situation and perspectives. Eur J Prev Cardiol. 2019;26(2_suppl):7–14. doi:10.1177/2047487319881021
- Ubago-Guisado E, Moratalla-Aranda E, González-Salvatierra S, et al. Do patients with type 2 diabetes have impaired Hip bone microstructure ? A study using 3D modeling of Hip dual-energy X-ray absorptiometry. Front Endocrinol. 2023;13:1069224. doi:10.3389/fendo.2022.1069224
- Camargo WA, de Vries R, van Luijk J, et al. Diabetes mellitus and bone regeneration: a systematic review and meta- analysis of animal studies. Tissue Eng Part B Rev. 2017;23(5):471–479. doi:10.1089/ten.teb.2016.0370
- Le Q, Madhu V, Hart JM, et al. Current evidence on potential of adipose derived stem cells to enhance bone regeneration and future projection. World J Stem Cells. 2021;13(9):1248–1277. doi:10.4252/wjsc.v13.i9.1248
- Sun Y, Wan B, Wang R, et al. Mechanical stimulation on mesenchymal stem cells and surrounding microenvironments in bone regeneration: regulations and applications. Front Cell Dev Biol. 2022;10:808303.
- Hsu -H-H, Wang AYL, Loh CYY, Pai AA, Kao H-K. Therapeutic potential of exosomes derived from diabetic adipose stem cells in cutaneous wound healing of db/db mice. Pharmaceutics. 2022;14(6):1206. doi:10.3390/pharmaceutics14061206
- Ahmadi H, Amini A, Fadaei Fathabady F, et al. Transplantation of photobiomodulation-preconditioned diabetic stem cells accelerates ischemic wound healing in diabetic rats. Stem Cell Res Ther. 2020;11(1):494. doi:10.1186/s13287-020-01967-2
- Suku M, Laiva AL, O’Brien FJ, Keogh MB. Anti-ageing protein β-klotho rejuvenates diabetic stem cells for improved gene-activated scaffold based wound healing. J Pers Med. 2020;11(1):4. doi:10.3390/jpm11010004
- Berlanga-Acosta JA, Guillén-Nieto GE, Rodríguez-Rodríguez N, et al. Cellular Senescence as the Pathogenic Hub of Diabetes-Related Wound Chronicity. Front Endocrinol. 2020;11:573032.
- Sforza A, Vigorelli V, Rurali E, et al. Liraglutide preserves CD34(+) stem cells from dysfunction Induced by high glucose exposure. Cardiovasc Diabetol. 2022;21(1):51. doi:10.1186/s12933-022-01486-9
- Peng Z, Yang X, Qin J, et al. Glyoxalase-1 overexpression reverses defective proangiogenic function of diabetic adipose-derived stem cells in streptozotocin-induced diabetic mice model of critical limb ischemia. Stem Cells Transl Med. 2017;6(1):261–271. doi:10.5966/sctm.2015-0380
- Lian K, Wang Q, Zhao S, et al. Pretreatment of diabetic adipose-derived stem cells with mitoTEMPO reverses their defective proangiogenic function in diabetic mice with critical limb ischemia. Cell Transplant. 2019;28(12):1652–1663. doi:10.1177/0963689719885076
- Guo J, Wang F, Hu Y, et al. Exosome-based bone-targeting drug delivery alleviates impaired osteoblastic bone formation and bone loss in inflammatory bowel diseases. Cell Rep Med. 2023;4:100881.
- Zhang W, Liu R, Chen Y, Wang M, Du J. Crosstalk between oxidative stress and exosomes. Oxid Med Cell Longev. 2022;2022:3553617. doi:10.1155/2022/3553617
- Zeng ZL, Xie H. Mesenchymal stem cell-derived extracellular vesicles: a possible therapeutic strategy for orthopaedic diseases: a narrative review. Biomater Transl. 2022;3(3):175–187. doi:10.12336/biomatertransl.2022.03.002
- Zhang X, Jiang Y, Huang Q, et al. Exosomes derived from adipose-derived stem cells overexpressing glyoxalase-1 protect endothelial cells and enhance angiogenesis in type 2 diabetic mice with limb ischemia. Stem Cell Res Ther. 2021;12(1):403. doi:10.1186/s13287-021-02475-7
- Burón M, Palomares T, Garrido-Pascual P, Herrero de la Parte B, García-Alonso I, Alonso-Varona A. Conditioned medium from H2O2-preconditioned human adipose-derived stem cells ameliorates UVB-induced damage to human dermal fibroblasts. Antioxidants. 2022;11(10):2011. doi:10.3390/antiox11102011
- Zhang YY, Hu ZL, Qi YH, et al. Pretreatment of nucleus pulposus mesenchymal stem cells with appropriate concentration of H(2)O(2) enhances their ability to treat intervertebral disc degeneration. Stem Cell Res Ther. 2022;13:340.
- Li Y, Zhang ZZ. Sustained curcumin release from PLGA microspheres improves bone formation under diabetic conditions by inhibiting the reactive oxygen species production. Drug Des Devel Ther. 2018;12:1453–1466. doi:10.2147/DDDT.S154334
- Li Y, Wang X. Chrysin attenuates high glucose-induced BMSC dysfunction via the activation of the PI3K/AKT/Nrf2 signaling pathway. Drug Des Devel Ther. 2022;16:165–182. doi:10.2147/DDDT.S335024
- Li Y, Gao X, Wang J. Human adipose-derived mesenchymal stem cell-conditioned media suppresses inflammatory bone loss in a lipopolysaccharide-induced murine model. Exp Ther Med. 2018;15(2):1839–1846. doi:10.3892/etm.2017.5606
- Arifin WN, Zahiruddin WM. Sample size calculation in animal studies using resource equation approach. Malays J Med Sci. 2017;24(5):101–105. doi:10.21315/mjms2017.24.5.11
- Deng X, Xu M, Shen M, Cheng J. Effects of type 2 diabetic serum on proliferation and osteogenic differentiation of mesenchymal stem cells. J Diabetes Res. 2018;2018:5765478. doi:10.1155/2018/5765478
- Furman BL. Streptozotocin-induced diabetic models in mice and rats. Current Protocols. 2021;1:e78.
- Mohamed-Ahmed S, Yassin MA, Rashad A, et al. Comparison of bone regenerative capacity of donor-matched human adipose-derived and bone marrow mesenchymal stem cells. Cell Tissue Res. 2021;383(3):1061–1075. doi:10.1007/s00441-020-03315-5
- Deng S, Zhu F, Dai K, Wang J, Liu C. Harvest of functional mesenchymal stem cells derived from in vivo osteo-organoids. Biomater Transl. 2023;4:270–279.
- Ma S, Zhou X, Wang Y, et al. MG53 protein rejuvenates hUC-MSCs and facilitates their therapeutic effects in AD mice by activating Nrf2 signaling pathway. Redox Biol. 2022;53:102325. doi:10.1016/j.redox.2022.102325
- Zhao L, Hu C, Han F, Cai F, Wang J, Chen J. Preconditioning is an effective strategy for improving the efficiency of mesenchymal stem cells in kidney transplantation. Stem Cell Res Ther. 2020;11(1):197. doi:10.1186/s13287-020-01721-8
- Guo L, Du J, Yuan DF, et al. Optimal H(2)O(2) preconditioning to improve bone marrow mesenchymal stem cells’ engraftment in wound healing. Stem Cell Res Ther. 2020;11(1):434. doi:10.1186/s13287-020-01910-5
- Loboda A, Damulewicz M, Pyza E, Jozkowicz A, Dulak J. Role of Nrf2/HO-1 system in development, oxidative stress response and diseases: an evolutionarily conserved mechanism. Cell Mol Life Sci. 2016;73:3221–3247.
- Fang J, Yan Y, Teng X, et al. Melatonin prevents senescence of canine adipose-derived mesenchymal stem cells through activating NRF2 and inhibiting ER stress. Aging. 2018;10(10):2954–2972. doi:10.18632/aging.101602
- Wang Y, Lin Q, Zhang H, et al. M2 macrophage-derived exosomes promote diabetic fracture healing by acting as an immunomodulator. Bioact Mater. 2023;28:273–283. doi:10.1016/j.bioactmat.2023.05.018