
Abstract
Purpose
The Baihe Dihuang decoction (BDD) is a representative traditional Chinese medicinal formula that has been used to treat anxiety disorders for thousands of years. This study aimed to reveal mechanisms of anxiolytic effects of BDD with multidimensional omics.
Methods
First, 28-day chronic restraint stress (CRS) was used to create a rat model of anxiety, and the open field test and elevated plus maze were used to assess anxiety-like behavior. Enzyme-linked immunosorbent assay (ELISA), hematoxylin–eosin staining, and immunofluorescence staining were used to evaluate inflammatory response. Besides, 16S rRNA gene sequencing assessed fecal microbiota composition and differential microbiota. Non-targeted metabolomics analysis of feces was performed to determine fecal biomarkers, and targeted metabolomics was used to observe the levels of hippocampus neurotransmitters. Finally, Pearson correlation analysis was used to examine relationships among gut microbiota, fecal metabolites, and neurotransmitters.
Results
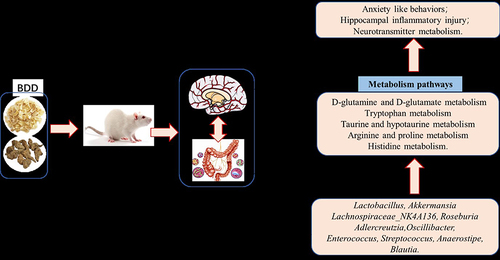
BDD significantly improved anxiety-like behaviors in CRS-induced rats and effectively ameliorated hippocampal neuronal damage and abnormal activation of hippocampal microglia. It also had a profound effect on the diversity of microbiota, as evidenced by significant changes in the abundance of 10 potential microbial biomarkers at the genus level. Additionally, BDD led to significant alterations in 18 fecal metabolites and 12 hippocampal neurotransmitters, with the majority of the metabolites implicated in amino acid metabolism pathways such as D-glutamine and D-glutamate, alanine, arginine and proline, and tryptophan metabolism. Furthermore, Pearson analysis showed a strong link among gut microbiota, metabolites, and neurotransmitters during anxiety and BDD treatment.
Conclusion
BDD can effectively improve anxiety-like behaviors by regulating the gut–brain axis, including gut microbiota and metabolite modification, suppression of hippocampal neuronal inflammation, and regulation of neurotransmitters.
Graphical Abstract
Introduction
Anxiety disorder is a common mood condition that is characterized by anxiety and fear.Citation1 According to epidemiological studies, anxiety disorder is the most common and prevalent disabling mental illness worldwide, with a lifetime prevalence of 28.8%.Citation2 The high morbidity, recurrence, and disability rates of anxiety disorders greatly burden patients, their families, and society.Citation3 Although chemical drugs may relieve anxiety symptoms, they cause severe side effects in some patients, such as sleepiness, sexual dysfunction, and weight gain.Citation4 Therefore, it is imperative to implement new therapeutic approaches and innovate the development of anxiolytic medications.
Traditional Chinese medicine has played an important role in treating anxiety due to its multi-component, multi-target approach with minimal side effects. The Baihe Dihuang decoction (BDD) is a traditional Chinese medicinal formula with a long history of use in China dating back to 200 AD for the treatment of “Baihe disease”. This formula was originally described in the “Synopsis of Prescriptions of the Golden Chamber” by Zhongjing Zhang, and consists of two herbs, Lilium lancifolium Thunb and Rehmannia glutinosa (Gaertn). DC. (http://www.th eplantlist.org). The “Baihe disease” presents symptoms that resemble those of anxiety disorders, such as anxiety, fear, muscle tension, panic attacks, and apprehension. At present, BDD is still used in clinical practice for treating patients with anxiety disorder, and it has also been found to exert anxiolytic-like effects in animals.Citation5–7
Previous studies have shown that many ingredients of BBD have antianxiety effects. In our previous study, the main anxiolytic ingredients of BBD were detected through the use of the spectrum–effect relationship, and these included regalosides A, B, C, D, and H, acteoside, and isoacteoside.Citation5 The anxiolytic function of catalpol is mediated by upregulating the expression of brain-derived neurotrophic factor and repairing the hypothalamus–pituitary–adrenal (HPA) axis.Citation8 Acetoside (verbascoside) exhibits anxiolytic effects through its interaction with gamma-aminobutyric acid (GABA) A receptors,Citation9 while regaloside A plays an important neuroprotective role by modifying brain-derived neurotrophic factor and tyrosine kinase receptor B.Citation10 Rehmannia glutinosa polysaccharides activate the immune system.Citation11
Recent advancements in basic research have contributed to a more comprehensive understanding of the pharmacological mechanisms of BDD. The pharmacological mechanisms of BBD typically entail augmenting monoamine neurotransmitter levels, mitigating oxidative stress responses, regulating circadian rhythms, enhancing neurotrophic signaling pathways, antagonizing excessive activation of the HPA axis, and inhibiting inflammatory responses.Citation12,Citation13 In addition, BDD exerts neuroprotective effects by correcting neurotransmitter deficits and inflammation imbalance in the corticosterone (CORT)-induced nerve cell injury model.Citation14 Moreover, it is noteworthy that the anxiolytic effect and molecular mechanism of BBD have not been fully elucidated and require further study.
Despite many proposed theories explaining the pathogenesis of anxiety, such as neurotransmitter deficits and neuroimmune dysregulation,Citation15 none have been universally accepted. Another hypothesis suggests that the gut microbiota may be closely associated with anxiety disorders. Patients with anxiety disorders have significantly different gut microbiota than healthy individuals, which is in line with the findings of previous animal model studies.Citation16 Additionally, germ-free mice exhibit significant anxiety symptoms when they receive fecal microbial transplants from mice with anxiety.Citation17 Previous research has shown an interconnection or bidirectional communication between the brain (including the autonomic nervous, neuroendocrine, and neural-immune systems) and the gut (and its microbiota), referred to as the theory of the microbiota–gut–brain (MGB) axis.Citation18 The gut microbiota and its metabolites are important for microglia development and function. Imbalance in gut microbiota can lead to neuroinflammation, which is linked to stress-induced anxiety. Therefore, the gut microbiota, metabolites, and neuroinflammation are key factors in the development of anxiety disorders through the MGB.Citation19–21 These findings offer novel insights into the mechanisms of BBD.
In our previous study, BDD improved anxiety-like behavior and neuronal damage in chronic restraint stress (CRS)-induced rats by inhibiting excessive inflammasome activation.Citation6 However, it remains unclear whether BDD can alleviate anxiety-associated neuroinflammation by influencing the gut microbiota and associated metabolites. Herein, we hypothesized that BDD alleviates anxiety-like behaviors and hippocampal neuroinflammation by improving the gut microbiota and its metabolites. To investigate this issue, 16S rRNA gene sequencing technology, non-targeted metabolomics, and targeted metabolomics approaches were used.
Materials and Methods
Drugs and Reagents
Lilium lancifolium Thunb (Lilii Bulbus) was obtained from Longshan (Hunan, China). Rehmannia glutinosa Libosch (Rehmanniae radix) was obtained from Jiaozuo (Henan, China). The two botanical drugs were purchased from Hunan Nanguo Yaodu Chinese Herbal Pieces Co., Ltd. (Hunan, China). Voucher specimens of Lilii Bulbus (voucher number: 430426–202019-0713LY) and Rehmanniae radix (voucher number: 410823–202029-0289LY) were deposited in the herbarium of the Institute of Medicinal Plant Development, Hunan Academy of Chinese Medicine (Hunan, China), and authenticated by Prof. Yu-Min Zhang, an expert at The First Hospital of Hunan University of Chinese Medicine. The two botanical drugs met the requirements of the Pharmacopoeia of People’s Republic of China (2020 Edition). Venlafaxine capsules (20 mg/tablet, Pfizer Ireland Pharmaceuticals, Lot No. CN3193D) were purchased from the First Affiliated Hospital of Hunan University of Chinese Medicine. All enzyme-linked immunosorbent assay (ELISA) kits for measuring interleukin (IL)-1β (70-EK301B/3), IL-6 (70-EK306/3), tumor necrosis factor (TNF)-α (70-EK3822/2), and IL-18 (70-EK218) were purchased from Hangzhou Lianke Biotechnology Co., Ltd. (Hangzhou, China). The hematoxylin–eosin (HE) staining kit (G1003) was purchased from Wuhan Xavier Biotechnology Co., Ltd. (Hangzhou, China), and anti–ionized calcium-binding adapter molecule 1 (Iba1) antibodies (ab5076) were purchased from Abcam Trading (Shanghai) Co., Ltd. (Shanghai, China). Analytical-grade materials and solvents were used in all experiments.
BDD Preparation and Quantity Control
Lilii Bulbus and Rehmanniae radix were extracted in a 1:1 proportion, immersed in water for 0.5 hours, and decocted twice for 1 hour each at solid: liquid ratios of 10 and 8, respectively. After filtration, the filtrate was concentrated to a relative density of 1.10 at 60°C under vacuum conditions. All extracts were evaporated under reduced pressure and freeze-dried, where 30 g botanical drug could yield approximately 6 g of extract. The quality control and identification of BDD were conducted using ultra-performance liquid chromatography coupled with time of flight mass spectrometry (UPLC-Q-TOF/MS). The UPLC-Q-TOF/MS fingerprints of BDD were investigated in our previous study.Citation5
Animals
Specific pathogen-free healthy male Sprague–Dawley rats (200±20 g, 430,727,211,101225,165) were obtained from Hunan Slaughter Jing da Laboratory Animal Co., Ltd. (Changsha, China). The rats were housed at the Science and Technology Innovation Center of The Hunan University of Chinese Medicine (Changsha, China). Before establishing the disease model, a 7-day acclimatization period was adopted for all of the rats under standard laboratory conditions (temperature, 22±2°C; humidity, 60%±5%; normal circadian rhythm of light). All animal experiments were conducted following the animal experimental guidelines set by the National Institutes of Health Guide for the Care and Use of Laboratory Animals, were approved by the Institutional Animal Protection and Use Committee of Hunan University of Chinese Medicine, and conformed to current animal welfare guidelines (approval number: LLBH-202103120003).
Modeling and BDD Intervention
Each experimental group, except the control group, was subjected to CRS to induce anxiety by restraining them in immobilizers for 3 hours/day for a total of 28 days.Citation22–25 Successful establishment of the model was determined using behavioral indexes ().
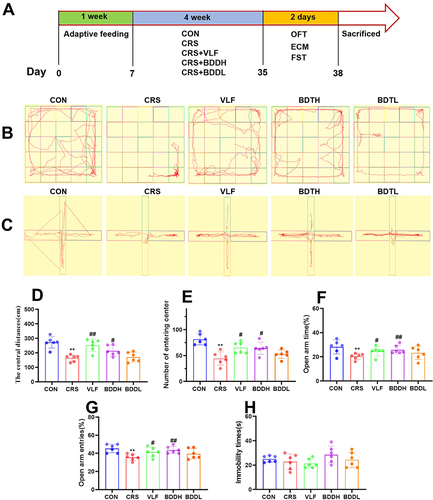
Figure 1 BDD improves anxiety behaviors. (A) Anxiety-like behaviors induced by CRS. (B and C) The movement trails of the rats in each group assessed using a video tracking software in the open field test (B) and elevated cross maze test (C). (D and E) Results of open field test were the center distance (D) and central enter times (E). (F and G) Results of elevated plus maze test were the proportion of time keeping the open arm (OT%) (F) and the proportion of entering the open arm (OE%) (G). The immobile times in the forced swimming test (H). Values are expressed as means ± SD. n=6 rats per group. **P<0.01, significant differences compared with the CON group; #P<0.05, ##P<0.01, significant differences compared with the CRS group.
The drug was orally administered on the 8th day of the model establishment, with the drug dose being converted from an average adult body weight of 60 g·d−1. All rats were administered the appropriate agents by gavage at a dose of 1 mL/100 g body weight 30–60 minutes before being subjected to CRS. The doses for the various agents were as follows: venlafaxine capsules (VLF), 13.5 mg·kg−1·d−1; low-dosage BDD (BDDL), 0.8 g·kg−1·d−1 (with a botanical drug dose of 4 g·kg−1·d−1); and high-dosage BDD (BDDH), 3.2 g·kg−1·d−1 (with a botanical drug dose of 16 g·kg−1·d−1). The rats in the control (CON) and model (CRS) groups received the same volume of distilled water.
Behavioral Test
Open field test (OFT): The rats were placed in the center of a black box (80 × 80×40 cm) with 25 squares at the bottom. After being allowed 30 seconds of free movement, the number of instances entering the center and the center distance were recorded over a 4-minute period.
Elevated cross maze (ECM): The ECM consisted of four cross-shaped arms elevated 50 cm above the ground. The two opposing arms were enclosed by 40-cm-high walls, whereas the other two arms were completely open. The rats were individually placed at the center of the ECM and allowed to explore for 5 minutes. We recorded and calculated the frequency at which the rats entered the open and closed arms, time spent in the open arm, open-arm entry percentages (OE), and open-arm entry time percentages (OT).
Forced swimming test (FST): The rats were placed in a special forced swimming tube for rats (diameter, 14 cm; depth, 25 cm; temperature, 24–26°C). Subsequently, they were forced to swim, and their behaviors were recorded. Immobility was recorded when the rats did not attempt to escape, except by keeping their heads above the water for breathing. The examination duration was kept at 5 minutes. The first minute was used for acclimation, and the remaining period was used to record the immobility time. Water was changed after every three animals, and the water level was kept constant.
Elisa
Hippocampal tissues were rapidly harvested from sacrificed rats. For lysate preparation, the tissues were homogenized in phosphate-buffered saline and centrifuged at 13,000 r.min−1 for 10 minutes at 4°C. We measured hippocampal levels of IL-1β, IL-6, TNF-α, and IL-18. The experimental steps were performed by following the manufacturer’s instructions.
HE and Immunofluorescence Staining
An HE staining kit was used for staining. The brain tissues of the rats were dehydrated in an alcohol gradient, permeabilized with xylene, paraffin-embedded, sectioned, dewaxed, and stained with HE. The stained sections were dehydrated, permeabilized, and sealed, and histopathological changes in the hippocampus were examined under a microscope.
Immunofluorescence staining of the microglial marker Iba1 was used to assess microglial morphology and activation. Briefly, the brain sections were fixed in 4% paraformaldehyde and permeabilized with 0.1% Triton X-100. Then, the slides were incubated with the primary Iba1 antibody at 4°C overnight. After washing three times for 10 minutes per wash, the samples were incubated in phosphate-buffered saline with the secondary antibody (goat anti-rabbit Alexa Fluor 594 [1:400]) for 1 hour at room temperature. Finally, immunofluorescence staining was analyzed using a confocal laser scanning microscope.
16S rRNA Gene Sequencing Analysis
The E.Z.N.A. ® Soil DNA kit (Omega Bio-Tek, Norcross, GA, US) was used to isolate genomic DNA from microbial fecal samples analyzed on a 1% agarose gel. A NanoDrop 2000 UV–vis spectrophotometer (Thermo Scientific, Wilmington, USA) was used to measure the DNA concentration and purity. The hypervariable region V3–V4 of the bacterial 16S rRNA gene was amplified using primer pairs 338F and 806R in an ABI Gene Amp® 9700 PCR thermocycler (ABI, CA, USA). Purified amplicons were pooled in equimolar ratios and paired-end sequenced on an Illumina MiSeq PE300 instrument (Illumina, San Diego, USA).
Fastp version 0.20.0 was used to demultiplex quality-filtered raw 16S rRNA gene sequencing reads, followed by merging with FLASH version 1.2.11. Based on UPARSE version 7.1, operational taxonomic units (OTUs) with a 97% similarity threshold were clustered, and chimeric sequences were identified and removed. Based on the 16S rRNA database (Silva v138) with a confidence threshold of 0.70, the RDP Classifier version 2.2 was used to analyze the taxonomy of each OTU representative sequence. Alpha diversity was calculated using the observed Ace, Chao, Shannon, and Simpson indexes. Non-metric multidimensional scaling (NMDS) and principal coordinate analysis (PCoA) were used for beta-diversity analysis based on Bray–Curtis dissimilarities. Finally, we performed intergroup comparisons of the gut microbial composition.
Metabolic Profiling
Chromatographic analysis of fecal metabolites was performed on an ExionLCTMAD system (AB Sciex, USA) equipped with an ACQUITY Ultra Performance Liquid Chromatography (UPLC) HSS T3 column (100 mm × 2.1 mm, 1.8 µm particle size; Waters, Milford, USA). The mobile phases included solvent A (comprising 95% water, 5% acetonitrile, and 0.1% formic acid) and solvent B (comprising 0.1% formic acid in 47.5% acetonitrile: 47.5% isopropanol: 5% water (v/v/v)). The solvent gradient changed as follows: from 0 to 3.5 minutes, 100% (A) to 75.5% (A), 0.4 mL/minute; from 3.5 to 5 minutes, 75.5% (A) to 35% (A), 0.4 mL/minute; from 5 to 5.5 minutes, 35% (A) to 0% (A), 0.4 mL/minute; from 5.5 to 7.4 minutes, 0% (A), 0.4–0.6 mL/minute; from 7.4 to 7.6 minutes, 0% (A) to 48.5% (A), 0.6 mL/minute; from 7.6 to 7.8 minutes, 48.5% (A) to 100% (A), 0.6–0.5 mL/minute; from 7.8 to 9 minutes, 100% (A), 0.5–0.4 mL/minute; and from 9 to 10 minutes, 100% (A), 0.4 mL/minute. The sample injection volume was 2 µL. The column temperature was maintained at 40°C. During storage, the samples were maintained at 4°C.
Electrospray ionization sources were used in the UPLC system coupled to a quadrupole-time-of-flight mass spectrometer (Triple TOFTM5600+, AB Sciex, USA). The optimal conditions were as follows: scan mass range, 70–1050 m/z; source temperature, 425°C; curtain gas, 30 psi; ion sources GS1 and GS2, 50 psi; ion-spray voltage floating, –3500 and 3500 V in the negative and positive modes, respectively; declustering potential, 80 V; collision energy, 20–60 V rolling for MS/MS.
The Human Metabolome Database (HMDB) and Metlin database were used to identify metabolic features using accurate mass spectra, MS/MS fragment spectra, and isotope ratios. We performed a principal component analysis (PCA) and orthogonal partial least squares discriminate analysis (OPLS-DA) using Simca-P. The differential metabolites were selected based on the VIP values (VIP>1.0) of OPLS-DA combined with Student’s t test (P<0.05).
Neurotransmitter Concentration Analysis
Chromatographic analysis of neurotransmitter metabolites was performed on an ExionLC AD system (AB Sciex, USA) equipped with a Waters HSS T3 column (100 mm × 2.1 mm; 1.8 µm particle size; Waters, Milford, USA). Separation of the metabolites was achieved at a 0.3 mL/minute flow rate with a gradient mobile phase comprising 0.1% formic acid in water and 0.1% formic acid as solvent A and acetonitrile as solvent B. The solvent gradient changed as follows: from 0 to 1 minute, 100% (A); from 1 to 3 minutes, 100% (A) to 95% (A); from 3 to 5 minutes, 95% (A) to 90% (A); from 5 to 6 minutes, 90% (A) to 85% (A); from 6 to 7 minutes, 85% (A); from 7 to 10 minutes, 85% (A) to 40% (A); from 10 to 11 minutes, 40% (A) to 0% (A); from 11 to 12 minutes, 0% (A); from 12 to 12.01 minutes, 0% (A) to 100% (A); and from 12.01 to 15 minutes, 100% (A). The sample injection volume was 1 μL. The column temperature was maintained at 35°C. During storage, the samples were maintained at 4°C.
Electrospray ionization sources were used in the UPLC system coupled to a mass spectrometer (QTRAP® 6500+, AB Sciex, USA). The optimal conditions were as follows: curtain gas, 35 psi; ion source GS1 and GS2, 55 psi; ion-spray voltage floating, −5500 and 4500 V in the negative and positive modes, respectively; and the collision gas was medium.
Appropriate amounts of 48 neurotransmitter standards were weighed and added to a 10-mL measuring cylinder as reference substances. Subsequently, we performed chromatography, followed by calculations and creation of the calibration curves. Next, we weighed a certain amount of rat feces, added 20 μL of isotope internal standard (5000 ng/mL) and 480 μL of 80% methanol aqueous solution, homogenized for 6 minutes, and centrifuged at 14,000 rpm for 15 minutes. Finally, the supernatant that was used for mass spectrometry was freeze-dried and redissolved in water, and then centrifuged at 14,000 rpm for 15 minutes.
Statistical Analysis
All data were presented as the means ± standard errors. Statistical and graphical analyses were performed using SPSS 23.0 and GraphPad Prism 6.0, respectively. Intergroup comparisons were performed using a simple analysis of variance. Metabolic pathways related to the differential metabolites were analyzed using Metabo Analyst 5.0 (https://www.metaboanalyst.ca/). Metabolic pathways with impact values ≥0.1 were considered potential target pathways according to the Kyoto Encyclopedia of Genes and Genomes and HMDB databases. Correlations between the gut microbiota and its metabolites were assessed using Pearson’s correlation analysis. P<0.05 was considered statistically significant.
Results
Quality Control and Identification of BDD
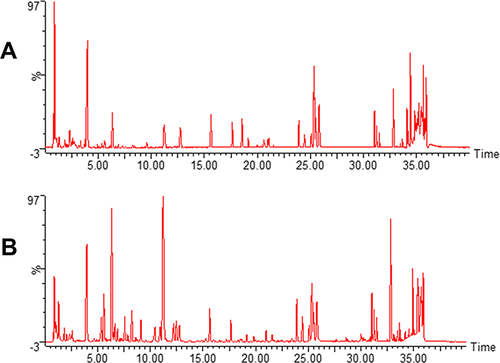
A total of 35 metabolites were successfully identified in the BDD sample. The identification results of these compounds are shown in , and .
Table 1 Characterization of the Main Metabolites in BDD by UPLC-Q-TOF/MS
Figure 2 Representative total ion current profiles of BDD in positive (A) and negative (B) ion modes.
BDD Improves Anxiety Behaviors in the Rat Model of CRS
In the OFT (), the CRS group had fewer entries to the center of the box and lower center distances than the CON group (P<0.01), which were significantly increased after the treatment with VLF (P<0.01 or P<0.05) and BDDH (P<0.05). In the ECM (), compared with the CON group, the CRS group showed a marked decrease in OE (P<0.01) and OT (P<0.01), which were significantly increased after the treatment with VLF (P<0.05) and BDDH (P<0.01). However, in the FST (), there was no significant difference between the CON group and the CRS group. Collectively, these results showed that CRS successfully induced anxiety-like behaviors in the rats, which were significantly reversed by BDDH.
BDD Reduces Inflammatory Factor Levels, Hippocampal Damage, and Microglial Activation in the Rat Model of CRS
As shown in , compared with the CON group, the CRS group had significantly higher hippocampal levels of IL-1β, IL-6, TNF-α, and IL-18 (P<0.01 or P<0.05), which were significantly decreased following VLF or BDDH treatment (P<0.01 or P<0.05).
Figure 3 BDD reduces inflammatory factors, hippocampal damage, and microglia activation. (A–D) Levels of inflammatory factors in the hippocampus (n=6). (E) Representative HE staining of hippocampal tissue (200×). (F) Representative immunofluorescence staining of IBA1 (red) in the hippocampal tissue (100×). Values are expressed as means ± SD. (n=6). *P<0.05, **P<0.01, significant differences compared with the CON group; #P<0.05, ##P<0.01, significant differences compared with the CRS group.
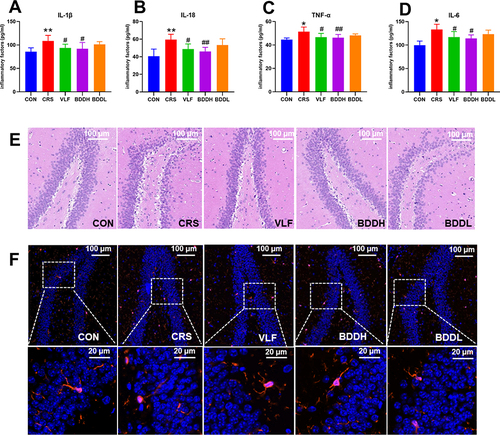
As shown in , compared with the CON group, the hippocampal neurons in the CRS group were sparse, cells were atrophic and fragmented, cell layers were fewer, cell gaps were larger, nucleoli were invisible, and some neurons appeared vacuolated. These pathological changes were reversed by VLF or BDDH treatment, indicating the protective effects of VLF and BDDH on hippocampal neurons in the CRS-induced rats.
As shown in , Iba1 protein in the hippocampal tissue in the CRS group was upregulated compared with that in the CON group. Simultaneously, the microglial morphology in the CRS group changed from branched to amoeboid. These changes demonstrated the activation of hippocampal cortical microglia in the CRS-induced rats, which was inhibited by BDDH and VLF treatment.
BDD Reverses Abnormal Diversity of the Gut Microbiota in the Rat Model of CRS
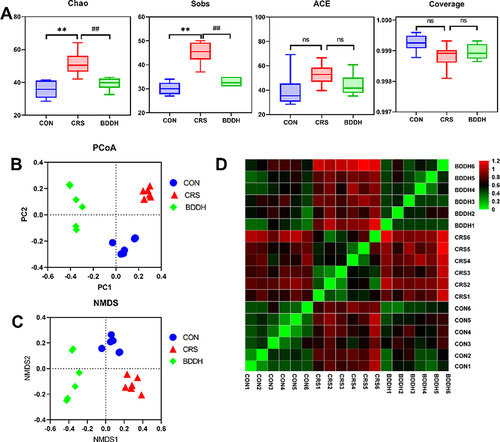
Alpha diversity is a comprehensive index measuring the species richness and evenness of the flora. The Ace, Chao, sobs, and coverage indexes were used to reflect alpha diversity. Compared with the CON group, the CRS group had significantly higher Chao and sobs values (P<0.01), which were significantly (P<0.01) decreased after BDD treatment (). PCoA and NMDS analysis were performed to analyze the β-diversity of the gut microbiota of the rats in each group ( and ). Compared with the CON group, the CRS group showed altered composition of the gut microbiota. Moreover, the results of the NMDS and PCoA analyses were consistent (). The sample distance heat map at the OTU level showed that the community composition in the BDD group was closer to that in the CON group than that in the CRS group (). In conclusion, BDD significantly ameliorated the disorder of the gut microbiota in the CRS-induced rats.
Figure 4 BDD reverses abnormal diversity of gut microbiota. (A) Alpha diversity analysis of the CON, the CRS, and BDDH groups. (B) Principal coordinate analysis. (C) Non-metric multidimensional scaling analysis of the CON, CRS, and BDDH groups based on the weighted UniFrac distance algorithm. (D) Samples distances heat map on OTU level. n=6 rats per group. **P<0.01, significant differences compared with the CON group; ##P<0.01, significant differences compared with the CRS group; ns, no significant difference between two groups.
BDD Ameliorates the Abnormal Microbiota Abundance in the Rat Model of CRS
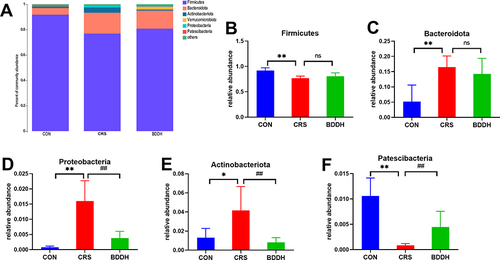
At the phylum level, the most dominant gut microorganisms in each group were Firmicutes and Bacteroidota (). As shown in , compared with the CON group, the CRS group had lower relative abundance of Firmicutes and Patescibacteria (P<0.01). After BDD treatment, Patescibacteria was significantly increased (P<0.01), whereas Firmicutes showed no significant difference, although it continued an increasing trend. The CRS group showed significantly higher relative abundances of Bacteroidota (P<0.01), Proteobacteria (P<0.01), and Actinobacteria (P<0.05) compared with the CON group, which were significantly lowered by BDD treatment (P<0.01), except for Bacteroidota.
Figure 5 BDD ameliorates the abnormal abundance of potential microbial biomarkers at the phylum level. (A) Average relative abundances at the phylum level in the CON, the CRS, and BDD groups. (B–F) Comparison of relative abundances of potential microbial biomarkers at the phylum level in the CON, CRS, and BDD groups. n=6 rats per group. *P<0.05, **P<0.01, significant differences compared with the CON group; ##P<0.01, significant differences compared with the CRS group; ns, no significant difference between two groups.
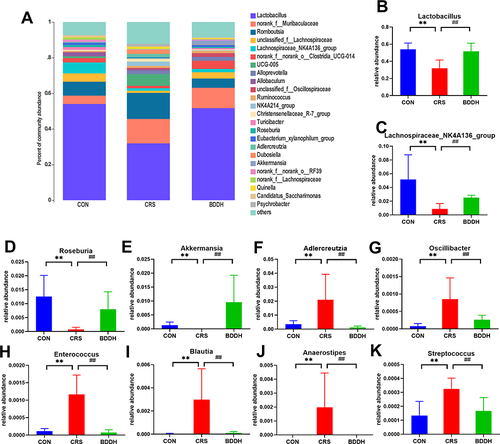
As shown in , Lactobacillus was the most abundant microbial taxon at the genus level, accounting for approximately 35% of the relative abundance in all four groups of rats. Compared with the CON group, the CRS group showed a significantly lower relative abundance of Lactobacillus, Lachnospiraceae_NK4A136, Roseburia, and Akkermansia (P<0.01), and a significantly higher abundance of Adlercreutzia, Oscillibacter, Enterococcus, Streptococcus, Anaerostipe, and Blautia (P<0.01). Compared with the CRS group, BDD significantly increased the abundance of Lactobacillus, Lachnospiraceae_NK4A136_group, Roseburia, and Akkermansia (P<0.01) and significantly decreased the abundance of Adlercreutzia, Oscillibacter, Enterococcus, Streptococcus, and Blautia (P<0.01). Furthermore, Anaerostipes was present in the CRS group, but not in the CON and BDD groups.
Figure 6 BDD ameliorates the abnormal abundance of potential microbial biomarkers at the genus level. (A) Average relative abundances at the genus level in the CON, the CRS, and BDDH groups. (B–K) Comparison of relative abundances of potential microbial biomarkers at the genus level in the CON, CRS, and BDDH groups. n=6 rats per group. **P<0.01, significant differences compared with the CON group. ##P<0.01, significant differences compared with the CRS group.
BDD Normalizes the Disrupted Metabolic Profiles in the Rat Model of CRS
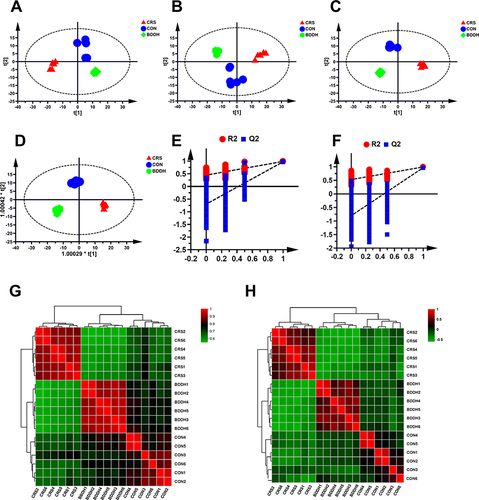
As shown in , PCA and OPLS-DA scatter plots in both positive and negative ion modes were applied to investigate changes in fecal metabolites. While the CON and CRS groups showed remarkable distinctions, the OPLS-DA model classification parameters showed that the models did not overfit (positive ion mode: R2X=0.674, R2Y=0.988, Q2=0.962; negative ion mode: R2X=0.797, R2Y=0.988), but reflected the metabolic changes ( and ), indicating that CRS induction significantly altered the fecal metabolites of the rats. The correlation between samples in both positive and negative ion modes showed that the BDD group pattern tended to be closer to that of the CON group ( and ), indicating the significant regulatory effect of BDD on the fecal metabolic profile of the CRS-induced rats.
Figure 7 BDD normalizes the disturbed metabolic profiles. (A and B) PCA score plots of fecal samples of rats in different groups in positive (A) mode and negative mode (B). (C and D) OPLS DA score plots fecal samples of rats in different groups in positive mode (C) and negative mode (D). (E and F) OPLS DA model validation plot of fecal samples of rats in different groups in positive mode (E) and negative mode (F). (G and H) The heat map of different metabolites both in positive (G) and in negative ion modes (H). R2 and Q2 represent the interpretation rate of the model to the matrix and the prediction ability of the model, respectively.
BDD Significantly Ameliorates Abnormal Metabolite Levels in the Rat Model of CRS
As shown in , a total of 19 metabolites were identified. Compared with the CON group, the CRS group demonstrated significantly higher levels of kynurenine, cortisol, and N’-formyl kynurenine (P<0.01), and significantly lower levels of (S)-glutamic acid, L-glutamine, urocanic acid, palmitoylethanolamide, taurine, N1-acetylspermidine, spermidine, L-arginine, D-ornithine, 1.4-diaminobutane, 5-hydroxyindoleacetic acid, pantothenic acid, arachidonoyl ethanolamide, 9S-hydroxy-10E,12Z-octadecadienoic acid, N-acetylputrescine, and lysoPC (14:1(9Z)) (P<0.01 or P<0.05). All these changes, except for urocanic acid, were significantly reversed (P<0.01 or P<0.05) by BDD treatment.
Table 2 Potential Biomarkers Associated with CRS and Their Variation Tendency After BDD Treatment Based on UPLC-Q-TOF/MS
BDD Recovers Neurotransmitter Dysfunction in the Rat Model of CRS
Liquid chromatography–mass spectrometry targeting metabolomics, used to analyze the neurotransmitter composition and content in the rat hippocampus, identified 29 neurotransmitters. As shown in and , we found disrupted hippocampal neurotransmitter metabolism in the CRS-induced rats, which was significantly different from that in the CON group, as demonstrated by PCA and OPLS-DA. According to the heat map (), the BDD group clustered closer to the CON group, whereas the CRS group was significantly different. Taken together, these data indicate that BDD exerts a modulatory effect on hippocampal neurotransmitter metabolism.
Figure 8 BDD significantly recovers neurotransmitter dysfunction. (A) PCA score plots of neurotransmitters. (B) OPLS DA score plots of neurotransmitters. (C) Heat map of neurotransmitters. (D) Levels of neurotransmitters in the hippocampus. n= 6 rats per group. *P<0.05, **P<0.01, significant differences compared with the CON group; #P<0.05, ##P<0.01, significant differences compared with the CRS group.
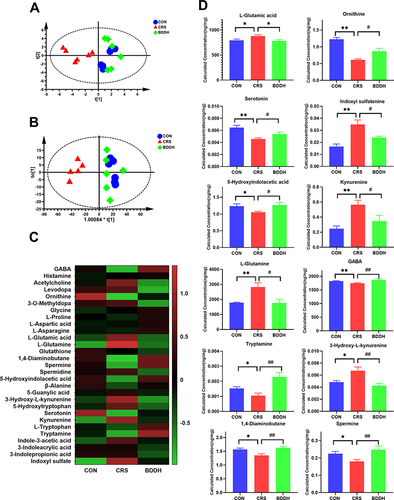
The hippocampal neurotransmitter content in each group is shown in . Compared with the CON group, the CRS group showed significantly lower levels of GABA, 5-HT, ornithine, tryptamine, 5-hydroxyindolacetic acid, 1.4-diaminobutane, and spermine (P<0.05), and significantly higher levels of L-glutamic acid, L-glutamine, 3-hydroxy-L-kynurenine, kynurenine, and indoxyl sulfate. All these changes were significantly reversed (P<0.01 or P<0.05) by BDD treatment.
BDD Improves the Neurotransmitter Metabolic Pathway in the Rat Model of CRS
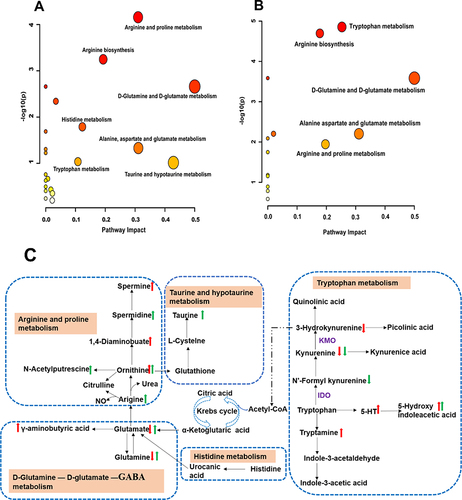
In the pathway enrichment analysis, the pathway impact represented the value of metabolic pathway importance, calculated using topology-based pathway enrichment analysis. Moreover, log P represented the significance level of the metabolic pathway enrichment analysis. The metabolic pathways with an impact value ≥0.1 were considered the most relevant pathways involved in the effect of BDD in the CRS-induced rats. As shown in , six metabolic pathways, namely D-glutamine and D-glutamate; taurine and hypotaurine; alanine, aspartate, and glutamate; arginine and proline; tryptophan; and histidine metabolism, were screened for pathway analysis of significantly altered fecal metabolites. As shown in , the following five metabolic pathways were screened for pathway analysis of differential neurotransmitter metabolites: D-glutamine and D-glutamate; alanine, aspartate, and glutamate; arginine and proline; tryptophan; and histidine metabolism. The common pathways identified by both pathway analyses were D-glutamine and D-glutamate; alanine, aspartate, and glutamate; arginine and proline; tryptophan; and histidine metabolism (as shown in ). These metabolic pathways are closely related to neurotransmitter metabolism.
Figure 9 Metabolic pathways and network analysis. (A and B) Summary of pathway analysis in fecal (A) and hippocampus (B) samples with MetaboAnalyst. (C) Metabolic network analysis. Red up arrow or red down arrow means that the hippocampal metabolite is significantly increased or decreased compared with the CRS group; green up arrow or green down arrow means that the fecal metabolite is significantly increased or decreased compared with the CRS group.
Correlations Between Altered Gut Microbiota and Potential Metabolites
Pearson correlation analysis was conducted to examine the relationship between intestinal microbiota distribution and metabolites. As shown in , fecal metabolites and bacterial markers showed broad correlations. Lactobacillus correlated positively with lysoPC (14:1(9Z)), N1-acetylspermidine, L-glutamine, taurine, L-arginine, spermidine, D-ornithine, arachidonoyl ethanolamide, pantothenic acid, palmitoylethanolamide, 5-hydroxyindoleacetic acid, and 1.4-diaminobutane (P<0.01), and negatively with N-formylkynurenine (P<0.01). Lachnospiraceae_NK4A136 positively correlated with spermidine, arachidonoyl ethanolamide, and urocanic acid (P<0.01). Roseburia positively correlated with spermidine (P<0.01). Adlercreutzia, Enterococcus, and Blautia correlated positively with N-formylkynurenine (P<0.01), and negatively with palmitoylethanolamide, pantothenic acid, 9S-hydroxy-10E,12Z-octadecadienoic acid, and spermidine (P<0.01). Adlercreutzia negatively correlated with 1.4-diaminobutane and N1-acetylspermidine (P<0.01). Enterococcus negatively correlated with arachidonoyl ethanolamide, D-ornithine, L-arginine, L-glutamine, and LysoPC(14:1(9Z)) (P<0.01). Blautia negatively correlated with N1-acetylspermidine, 1.4-diaminobutane, and lysoPC(14:1(9Z)) (P<0.01). Anaerostipes negatively correlated with N1-acetylspermidine and L-arginine (P<0.01).
Figure 10 Correlation analysis between metabolites and microorganisms. Pearson correlation analysis among microbial biomarkers and differential metabolites in fecal samples (A). Pearson correlation analysis among microbial biomarkers and neurotransmitters in the hippocampus (B). The color key represents Pearson’s correlation coefficient. The green color indicates positive correlations, while the red color indicates negative correlations. n=6 rats per group, significance is indicated as *P<0.01.
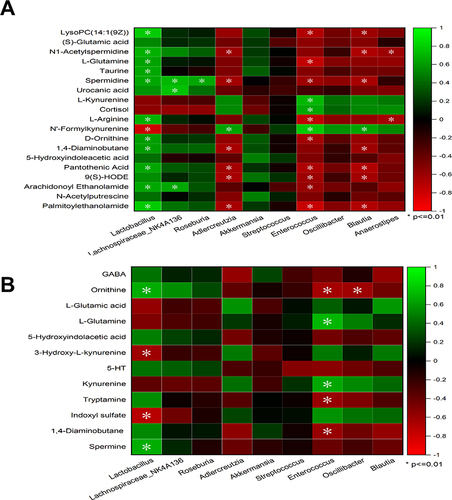
As shown in , hippocampal neurotransmitters and bacterial markers showed broad correlations. Lactobacillus correlated positively with spermidine and ornithine (P<0.01) and negatively with 3-hydroxy-L-kynurenine and indoxyl sulfate (P<0.01). Enterococcus correlated positively with L-glutamine and kynurenine (P<0.01) and negatively with tryptamine, and 1.4-diaminobutane and ornithine (P<0.01). Oscillibacter negatively correlated with ornithine (P<0.01).
Discussion
BDD, an effective traditional Chinese medicine, is widely used for the treatment of anxiety disorders. However, its specific mechanism of action remains unclear. Recent evidence suggests that dysbiosis of gut bacteria and their metabolites plays a key role in the development of anxiety through the MGB axis.Citation26 In the present study, we aimed to investigate the effects of BDD on CRS-induced hippocampal neuroinflammation and anxiety-like behaviors in rats, and to explore its impact on gut bacterial and metabolite dysbiosis.
Neuroinflammation triggered by microglia is responsible for anxiety-like behaviors. Activated microglia and elevated levels of inflammatory factors (such as IL-1β, IL-6, and TNF-α) have been reported in patients with anxiety, these are related to the severity of anxiety and result in the decreased synthesis of 5-HT.Citation27,Citation28 Our findings showed that hippocampal microglial morphology changed significantly in the CRS group. After BDD intervention, the abnormal microglial activation was inhibited, and the expression of inflammatory factors was reduced. This indicates that BDD plays an anxiolytic effect possibly through inhibiting the activation of hippocampal microglia and reducing the expression of inflammatory factors.
The gut microbiota is crucially involved in anxiety. At the genus level, BDD led to the proliferation of several important beneficial bacteria, including Lactobacillus and Akkermansia. Lactobacillus is the main kind of intestinal microbiota and is most commonly used as a probiotic, owing to its ability to regulate the imbalance in the intestinal flora, inhibit the colonization of pathogenic bacteria, enhance the interaction between intestinal microflora and host, and positively affect behavior and mood.Citation29 The abundance of Lactobacillus is decreased in anxious animals, whereas Lactobacillus supplementation significantly alleviates anxiety symptoms.Citation30 Lactobacillus exerts anxiolytic effects by promoting neurotransmitter function.Citation31 Moreover, Lactobacillus rhamnosus can modulate the expression of central GABA receptors and downregulate the HPA axis through the vagal pathway, thereby exerting anxiolytic effects.Citation31 Additionally, Lactobacillus may exert neuroprotective effects by regulating the release of inflammatory cytokines.Citation32 As a probiotic, Akkermansia secretes immunoglobulin A (IgA) and beneficial antimicrobial peptides that help maintain intestinal barrier integrity, prevent inflammation, and enhance immunity.Citation33 It has been found that Akkermansia abundance is closely associated with anxiety-like behavior in mice.Citation34 Moreover, we found a decrease in inflammation-related bacteria, such as Enterococcus, Streptococcus, Oscillibacter, and Blautia, in the BDD group. Oscillibacter is a Gram-negative bacterium that releases lipopolysaccharide, which is more easily absorbed into the bloodstream after intestinal barrier damage and further induces the release of peripheral and central proinflammatory cytokines that are crucial in the pathogenesis of neuroinflammation.Citation35
We used non-targeted metabolomics and targeted metabolomics to explore the treatment mechanism of BDD on anxiety. We found that BBD has an effect on multiple metabolites in common with five metabolic pathways in the treatment of anxiety, including D-glutamine and D-glutamate; alanine, aspartate, and glutamate; arginine and proline; tryptophan; and histidine metabolism.
The tryptophan metabolic pathway, mainly the tryptophan kynurenine pathway, plays a key role in regulating mental rhythm. Abnormalities in this pathway give rise to neurotoxic metabolites such as 3-hydroxy acid and quinolinic acid, and reduce the level of 5-HT, which triggers anxiety symptoms.Citation36 There is accumulating evidence indicating that kynurenine metabolism is involved in brain inflammatory injury, and tryptophan is metabolized to kynurenine by indoleamine 2.3-dioxygenase (IDO), which is upregulated by proinflammatory cytokines.Citation37 In this study, BDD restored abnormal metabolites of tryptophan, such as 5-HT, tryptophan, kynurenine, 5-hydroxyindolacetic acid, and 3-hydroxy-L-kynurenine, and inhibited abnormal microglial activation, suggesting that BDD regulated excessive activation of the microglia in the CRS-induced rats and was closely associated with the tryptophan kynurenine pathway.
Glu and GABA, an important excitatory neurotransmitter and inhibitory neurotransmitter, lead to neurotoxicity and reduce neuronal excitability, respectively. Anxiety disorders are associated with abnormally high levels of Glu and Gln, and abnormally low levels of GABA.Citation38,Citation39 Astrocyte activation leads to elevated Glu concentrations in the synaptic cleft, resulting in Glu excitotoxicity.Citation40 In this study, BDD modulated neurotransmitters such as Glu, Gln, and GABA, suggesting that BDD alleviated the anxiety-like behaviors by regulating the levels of Glu, Gln, and GABA in the CRS-induced rats.
There is evidence confirming that arginine and proline metabolism are closely related to anxiety disorders. Arginine is metabolized either by inducible nitric oxide synthase and produces nitric oxide and citrulline, or by arginase and produces urea and ornithine. Ornithine is metabolized into proline and polyamines (agmatine, putrescine, spermine). Polyamines play an important role in brain immune homeostasis as key regulators of cellular excitability.Citation41 5-HT, dopamine, and noradrenaline are critical nitric oxide–mediated neurotransmitters associated with mental disorders. Additionally, arginine supplementation reduces anxiety symptoms in healthy adults.Citation42 In the present study, abnormal metabolite levels of arginine and proline, such as ornithine, 1.4-diaminobutane, and spermine, in the CRS-induced rats were reversed by BDD, suggesting that BDD has an anxiolytic effect possibly through regulating the arginine and proline metabolic pathways.
The gut microbiota might influence the development of anxiety-like behaviors by regulating the microbiota–metabolite axis. The kynurenine/tryptophan metabolism restores to normal after probiotic administration (Lactobacillus helveticus and Bifidobacterium longum).Citation43 In sterile mice, abnormal plasma 5-HT/tryptophan metabolism returns to normal after bacterial transplantation.Citation44 Kynurenine metabolism is influenced by the intestinal flora through the regulation of IDO activity or the direct synthesis of kynurenine via specific gut bacterial strains.Citation45 Lactobacillus, the most important symbiotic bacteria that metabolize tryptophan to 5-HT, can pass through the blood–brain barrier.Citation46 Lactobacillus and Akkermansia convert tryptophan to indole and indole derivatives, which are associated with anxiety-like behavior in rats.Citation47 In the present study, we showed a significant correlation between gut microbiota and the neurotransmitters metabolic pathway, suggesting that BDD improves anxiety-like behaviors, which may be associated with the regulation of the microbiota–metabolite axis.
Conclusions
In summary, BDD demonstrates a notable improvement in anxiety-like behavior in CRS-induced rats through the regulation of the MGB axis. This regulatory effect is achieved through various routes, including the suppression of hippocampal inflammation, modulation of gut microbiota and fecal metabolites, and enhancement of hippocampal neurotransmitter levels. The antianxiety properties of BDD are distinct from those of conventional serotonin and noradrenaline reuptake inhibitors such as VLF. Thus, BDD may offer a promising alternative treatment for anxiety disorders, owing to its unique antianxiety effects.
Author Contributions
All authors made a significant contribution to the work reported, whether that is in the conception, study design, execution, acquisition of data, analysis and interpretation, or in all these areas; took part in drafting, revising or critically reviewing the article; gave final approval of the version to be published; have agreed on the journal to which the article has been submitted; and agree to be accountable for all aspects of the work.
Disclosure
The authors declare no conflict of interest.
Data Sharing Statement
Raw sequencing data can be identified in the NCBI Sequence Read Archive (accession number PRJNA1047763). The datasets during the current study available from the corresponding author on reasonable request.
Additional information
Funding
References
- Wang M, Cao L, Li H, et al. Dysfunction of resting-state functional connectivity of amygdala subregions in drug-naïve patients with generalized anxiety disorder. Front Psychiatry. 2021;12:758978. doi:10.3389/fpsyt.2021.758978
- Kessler RC, Berglund P, Demler O, et al. Lifetime prevalence and age-of-onset distributions of DSM-IV disorders in the national comorbidity survey replication. Arch Gen Psychiatry. 2005;62(6):593–602. doi:10.1001/archpsyc.62.6.593
- Whiteford HA, Degenhardt L, Rehm J, et al. Global burden of disease attributable to mental and substance use disorders: findings from the global burden of disease study 2010. Lancet. 2013;382:1575–1586. doi:10.1016/S0140-6736(13)61611-6
- Lord CC, Wyler SC, Wan R, et al. The atypical antipsychotic olanzapine causes weight gain by targeting serotonin receptor 2C. J Clin Invest. 2017;127(9):3402–3406. doi:10.1172/JCI93362
- Tang L, Zhao HQ, Yang H, et al. Spectrum-effect relationship combined with bioactivity evaluation to discover the main anxiolytic active components of Baihe Dihuang decoction. J Ethnopharmacol. 2023;319(Pt 1):117090. doi:10.1016/j.jep.2023.117090
- Zhao HQ, Tang L, Wu BR, et al. Baihe Dihuangtang improves hippocampal neuron damage in anxious depression model rats by inhibiting NLRP3 inflammasome activation. Chin J Exp Tradit Med Formulae. 2021;27(20):7–14.
- Xue X, Pan J, Zhang H, et al. Baihe Dihuang (Lilium henryi Baker and Rehmannia glutinosa) decoction attenuates somatostatin interneurons deficits in prefrontal cortex of depression via miRNA-144-3p mediated GABA synthesis and release. J Ethnopharmacol. 2022;292:115218. doi:10.1016/j.jep.2022.115218
- Sun Y, Ji J, Zha Z, et al. Effect and mechanism of catalpol on remyelination via regulation of the NOTCH1 signaling pathway. Front Pharmacol. 2021;12:628209. doi:10.3389/fphar.2021.628209
- Razavi BM, Zargarani N, Hosseinzadeh H. Anti-anxiety and hypnotic effects of ethanolic and aqueous extracts of Lippia citriodora leaves and verbascoside in mice. Avicenna J Phytomed. 2017;7(4):353–365.
- Yuan ZY, Li ZY, Zhao HQ, et al. Effects of different drying methods on the chemical constituents of Lilium lancifolium Thunb. based on UHPLC-MS analysis and antidepressant activity of the main chemical component regaloside A. J Sep Sci. 2021;44(5):992–1004. doi:10.1002/jssc.202000969
- Xu L, Kwak M, Zhang W, et al. Rehmannia glutinosa polysaccharide induces toll-like receptor 4 dependent spleen dendritic cell maturation and anti-cancer immunity. Oncoimmunology. 2017;6(7):e1325981. doi:10.1080/2162402X.2017.1325981
- Zhang H, Xue X, Pan J, et al. Integrated analysis of the chemical-material basis and molecular mechanisms for the classic herbal formula of lily bulb and rehmannia decoction in alleviating depression. Chin Med. 2021;16:107. doi:10.1186/s13020-021-00519-x
- Miao M, Peng M, Chen H, et al. Effects of Baihe Dihuang powder on chronic stress depression rat models. Saudi J Biol Sci. 2019;26:582–588. doi:10.1016/j.sjbs.2018.12.002
- Pan J, Lu Y, Wang S, et al. Synergistic neuroprotective effects of two natural medicinal plants against CORT-induced nerve cell injury by correcting neurotransmitter deficits and inflammation imbalance. Phytomedicine. 2023;121:155102. doi:10.1016/j.phymed.2023.155102
- Bartlett AA, Singh R, Hunter RG. Anxiety and epigenetics. Adv Exp Med Biol. 2017;978:145–166.
- Sherwin E, Bordenstein SR, Quinn JL, et al. Microbiota and the social brain. Science. 2019;366(6465):eaar2016. doi:10.1126/science.aar2016
- Li N, Wang Q, Wang Y, et al. Fecal microbiota transplantation from chronic unpredictable mild stress mice donors affects anxiety-like and depression-like behavior in recipient mice via the gut microbiota-inflammation-brain axis. Stress. 2019;22(5):592–602. doi:10.1080/10253890.2019.1617267
- Foster JA, Neufeld KA. Gut-brain axis: how the microbiome influences anxiety and depression. Trends Neurosci. 2013;36:305–312. doi:10.1016/j.tins.2013.01.005
- Needham BD, Funabashi M, Adame MD, et al. A gut-derived metabolite alters brain activity and anxiety behaviour in mice. Nature. 2022;602(7898):647–653.
- Tian X, Wang G, Teng F, et al. Zhi Zi Chi decoction (Gardeniae fructus and semen Sojae Praeparatum) attenuates anxious depression via modulating microbiota-gut-brain axis in corticosterone combined with chronic restraint stress-induced mice. CNS Neurosci Ther. 2024;30(4):e14519. doi:10.1111/cns.14519
- Chi L, Cheng X, Lin L, et al. Porphyromonas gingivalis -induced cognitive impairment is Associated with gut dysbiosis, neuroinflammation, and glymphatic dysfunction. Front Cell Infect Microbiol. 2021;11:755925. doi:10.3389/fcimb.2021.755925
- Yan Y, Li J, Zhang Y, et al. Screening the effective components of Suanzaoren decoction on the treatment of chronic restraint stress induced anxiety-like mice by integrated chinmedomics and network pharmacology. Phytomedicine. 2023;115:154853. doi:10.1016/j.phymed.2023.154853
- Campos AC, Fogaça MV, Aguiar DC, et al. Animal models of anxiety disorders and stress. Braz J Psychiatry. 2013;35(Suppl 2):S101–11. doi:10.1590/1516-4446-2013-1139
- Geng X, Wu H, Li Z, et al. Jie-Yu-He-Huan Capsule ameliorates anxiety-like behaviours in rats exposed to chronic restraint stress via the cAMP/PKA/CREB/BDNF signaling pathway. Oxid Med Cell Longevity. 2021;2021:1703981.
- Kuti D, Winkler Z, Horváth K, et al. The metabolic stress response: adaptation to acute-, repeated- and chronic challenges in mice. IScience. 2022;25(8):104693. doi:10.1016/j.isci.2022.104693
- Zhang F, Zhou Y, Chen H, et al. Curcumin alleviates DSS-induced anxiety-like behaviors via the microbial-brain-gut axis. Oxid Med Cell Longev;2022. 6244757. doi:10.1155/2022/6244757
- Vogelzangs N, Beekman AT, de Jonge P. Anxiety disorders and inflammation in a large adult cohort. Transl Psychiatry. 2013;3:e249. doi:10.1038/tp.2013.27
- Guillemin GJ, Smythe G, Takikawa O, et al. Expression of indoleamine 2,3-dioxygenase and production of quinolinic acid by human microglia, astrocytes, and neurons. Glia. 2005;49(1):15–23. doi:10.1002/glia.20090
- Shi CW, Cheng MY, Yang X, et al. Probiotic lactobacillus rhamnosus GG promotes mouse gut microbiota diversity and T cell differentiation. Front Microbiol. 2020;11:607735. doi:10.3389/fmicb.2020.607735
- Aucoin M, LaChance L, Naidoo U, et al. Diet and anxiety: a scoping review. Nutrients. 2021;13(12):4418. doi:10.3390/nu13124418
- Bravo JA, Forsythe P, Chew MV, et al. Ingestion of Lactobacillus strain regulates emotional behavior and central GABA receptor expression in a mouse via the vagus nerve. Proc Natl Acad Sci USA. 2011;108(38):16050–16055. doi:10.1073/pnas.1102999108
- Cui C, Han Y, Li H, et al. Curcumin-driven reprogramming of the gut microbiota and metabolome ameliorates motor deficits and neuroinflammation in a mouse model of Parkinson’s disease. Front Cell Infect Microbiol. 2022;12:887407. doi:10.3389/fcimb.2022.887407
- Hidalgo-Cantabrana C, Delgado S, Ruiz L, et al. Bifidobacteria and their health-promoting effects. Microbiol Spectr. 2017;5(3):10. doi:10.1128/microbiolspec.BAD-0010-2016
- McGaughey KD, Yilmaz-Swenson T, Elsayed NM, et al. Relative abundance of Akkermansia spp. and other bacterial phylotypes correlates with anxiety- and depressive-like behavior following social defeat in mice. Sci Rep Mar. 2019;9(1):3281. doi:10.1038/s41598-019-40140-5
- Song JJ, Tian WJ, Kwok LY, et al. Effects of microencapsulated Lactobacillus plantarum LIP-1 on the gut microbiota of hyperlipidaemic rats. Br. J Nutr. 2017;118:481–492. doi:10.1017/S0007114517002380
- Deng Y, Zhou M, Wang J, et al. Involvement of the microbiota-gut-brain axis in chronic restraint stress: disturbances of the kynurenine metabolic pathway in both the gut and brain. Gut Microbes. 2021;13(1):1–16. doi:10.1080/19490976.2020.1869501
- Parrott JM, Redus L, Santana-Coelho D, et al. Neurotoxic kynurenine metabolism is increased in the dorsal hippocampus and drives distinct depressive behaviors during inflammation. Transl Psychiatry. 2016;6(10):e918. doi:10.1038/tp.2016.200
- Hasler G, Buchmann A, Haynes M, et al. Association between prefrontal glutamine levels and neuroticism determined using proton magnetic resonance spectroscopy. Transl Psychiatry. 2019;9(1):170. doi:10.1038/s41398-019-0500-z
- Lange MD, Jüngling K, Paulukat L, et al. Glutamic acid decarboxylase 65: a link between GABAergic synaptic plasticity in the lateral amygdala and conditioned fear generalization. Neuropsychopharmacology. 2014;39(9):2211–2220. doi:10.1038/npp.2014.72
- Hansen F, Galland F, Lirio F, et al. Methylglyoxal induces changes in the glyoxalase system and impairs glutamate uptake activity in primary astrocytes. Oxid Med Cell Longev. 2017;2017:9574201. doi:10.1155/2017/9574201
- Limon A, Delbruck E, Yassine A, et al. Electrophysiological evaluation of extracellular spermine and alkaline pH on synaptic human GABA(A) receptors. Transl Psychiatry. 2019;9(1):218. doi:10.1038/s41398-019-0551-1
- Smriga M, Ando T, Akutsu M, et al. Oral treatment with L-lysine and L-arginine reduces anxiety and basal cortisol levels in healthy humans. Biomed Res. 2007;28:85–90. doi:10.2220/biomedres.28.85
- Tao X, Yan M, Wang L, et al. Homeostasis imbalance of microglia and astrocytes leads to alteration in the metabolites of the kynurenine pathway in LPS-induced depressive-like mice. Int J Mol Sci. 2020;21(4):1460. doi:10.3390/ijms21041460
- Kong Q, Chen Q, Mao X, et al. Bifidobacterium longum CCFM1077 ameliorated neurotransmitter disorder and neuroinflammation closely linked to regulation in the kynurenine pathway of autistic-like rats. Nutrients. 2022;14(8):1615. doi:10.3390/nu14081615
- Wu L, Ran L, Wu Y, et al. Oral Administration of 5-hydroxytryptophan restores gut microbiota dysbiosis in a mouse model of depression. Front Microbiol. 2022;13:864571. doi:10.3389/fmicb.2022.864571
- Kaur H, Bose C, Mande SS. Tryptophan metabolism by gut microbiome and gut-brain-axis: an in silico analysis. Front Neurosci. 2019;13:1365. doi:10.3389/fnins.2019.01365
- Lee YJ, Lee S, Kim DM. Translational detection of indole by complementary cell-free protein synthesis assay. Front Bioeng Biotechnol. 2022;10:900162. doi:10.3389/fbioe.2022.900162