Abstract
Acquired immunodeficiency syndrome is a public health problem worldwide caused by the Human immunodeficiency virus (HIV). Treatment with antiretroviral drugs is the best option for viral suppression, reducing morbidity and mortality. However, viral resistance in HIV-1 therapy has been reported. HIV-1 integrase (IN) is an essential enzyme for effective viral replication and an attractive target for the development of new inhibitors. In the study reported here, two- and three-dimensional quantitative structure–activity relationship (2D/3D-QSAR) studies, applying hologram quantitative structure–activity relationship (HQSAR) and comparative molecular field analysis (CoMFA) methods, respectively, were performed on a series of tricyclic phthalimide HIV-1 IN inhibitors. The best HQSAR model (q 2 = 0.802, r 2 = 0.972) was obtained using atoms, bonds, and connectivity as the fragment distinction, a fragment size of 2–5 atoms, hologram length of 61 bins, and six components. The best CoMFA model (q 2 = 0.748, r 2 = 0.974) was obtained with alignment of all atoms of the tricyclic phthalimide moiety (alignment II). The HQSAR contribution map identified that the carbonyl-hydroxy-aromatic nitrogen motif made a positive contribution to the activity of the compounds. Furthermore, CoMFA contour maps suggested that bulky groups in meta and para positions in the phenyl ring would increase the biological activity of this class. The conclusions of this work may lead to a better understanding of HIV-1 IN inhibition and contribute to the design of new and more potent derivatives.
Keywords:
Introduction
Acquired immunodeficiency syndrome (AIDS) is a public health problem worldwide caused by the Human immunodeficiency virus (HIV). It is estimated that 33.3 million people are infected with HIV-1 and about 2.1 million deaths are reported every year that are related to AIDS.Citation1 HIV-1 infection is characterized by destruction of immune cells, especially T lymphocytes, which are responsible for the immune response against antigens, pathogens, and cancer cells.Citation2
The HIV-1 replication cycle depends on different macromolecules, including three viral enzymes, namely, reverse transcriptase, protease, and integrase (IN). Currently, reverse transcriptase and protease are targets for several antiretroviral US Food and Drug Administration-approved drugs, such as efavirenz and indinavir, respectively, while for IN there are just two, raltegravir and elvitegravir.Citation3,Citation4
Treatment with antiretroviral drugs is the best option for viral suppression, reducing morbidity and mortality. However, as viral resistance in HIV therapy has been reported,Citation5–Citation7 additional therapeutic approaches are needed.Citation8 HIV-1 IN is one of three essential enzymes required for viral replication, and the absence of a host-cell equivalent target means that IN inhibitors may not interfere with cellular physiological process, suggesting that they are an attractive target for biological active compounds.Citation8 Thus, resistance to HIV-1 IN inhibitors is the greatest problem and the discovery of new potential inhibitors is essential for AIDS treatment.Citation5,Citation7
In an attempt to design new chemical entities with efficient antiretroviral activity, we explored the two-dimensional (2D) and three-dimensional (3D) molecular features of a series of tricyclic phthalimide HIV-1 IN inhibitors developed by Verschueren et al,Citation9 using two- and three-dimensional quantitative structure–activity relationship (2D/3D-QSAR) approaches, namely, hologram quantitative structure–activity relationship (HQSAR)Citation10 and comparative molecular field analysis (CoMFA)Citation11 methods, respectively, which are powerful ligand-based strategies in drug design.Citation12
Materials and methods
Dataset
The same dataset was used for the HQSAR and CoMFA studies containing the 42 tricyclic phthalimides developed by Verschueren et alCitation9 showing HIV IN inhibitory activity (). The biological activity of all compounds was used as originally expressed, as pIC50 (M) values (−Log of the half maximal inhibitory concentration, IC50) values. The 42 compounds were divided into training (30 compounds) and test (12 compounds) sets, ensuring that both sets contained structurally diverse compounds with high, medium and low activity, to avoid possible problems during the external validation.
Table 1 Chemical structures and biological data of 42 tricyclic phthalimide HIV-1 integrase inhibitors
Molecular modeling design and conformational analysis
All tricyclic phthalimides (1–42) were built using SPARTAN’10 software (Wavefunction, Inc, Irvine, CA, USA) for Windows XP®. Conformational analysis was performed with the conformer distribution Monte Carlo method, using Merck Molecular Force Field 94 (MMFF94). The lowest energy conformations were geometrically optimized by the Parameterized Model number 3 (PM3) semi-empirical method available in the program. In the absence of a compound from the phthalimide class co-crystallized with HIV-1 IN, the lowest energy conformations were used as the bioactive conformation, a methodology successfully used by other authors.Citation12–Citation14
HQSAR models
The structures of tricyclic phthalimides were converted into fragments initially using the default fragment size of 4–7 atoms per fragment. All fragments were allocated in defined molecular hologram lengths (53, 59, 61, 71, 83, 97, 151, 199, 257, 307, 353, 401 bins) and fragment distinction analysis was performed in terms of atoms, bonds, connectivity, hydrogen, and donor/acceptor atoms. Since these parameters may affect HQSAR models, different combinations of these parameters were considered during the HQSAR runs.Citation15
After the partial least-squares (PLS) analysis, several QSAR models were generated for each distinguishing fragment (). Importantly, in the HQSAR method, the alignment step is not necessary for the generation of a model. All QSAR models were generated using PLS and the internal validation was performed by leave-one-out (LOO) cross-validation. An external validation was performed with the test set compounds, which was not considered in the HQSAR model development.
Table 2 Summary of hologram quantitative structure–activity relationship (HQSAR) statistical indexes for the influence of various fragment distinctions (FD), using 4–7 as the fragment size parameter
3D-QSAR molecular alignment
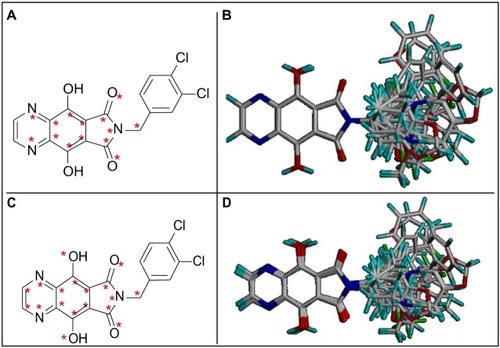
Conformer selection and molecular alignment are the most essential steps in 3D-QSAR studies. The accuracy and reliability of the CoMFA model is directly dependent on the molecular alignment rule.Citation11 In this study, the alignments were carried out using the SYBYL-X 1.1 software package (Tripos International, St Louis, MO, USA) and made based on the presence of a moiety common to all derivatives, by adopting the RMS (root mean square) atom-fit rule for superposition of individual atoms. Two different alignments were performed and three models were generated from each one. The most active compound from the series (33) was used as the template for both alignments (). In alignment I, all atoms of the tricyclic phthalimide moiety were chosen, except for the hydroxyl groups and external carbon atoms of the pyrazine ring. In alignment II, all atoms of tricyclic phthalimide moiety were chosen ().
Figure 1 Selected atoms to alignment I (A) and three-dimensional (3D) view of superimposed aligned molecules (B). Selected atoms to alignment II (C) and 3D view of superimposed aligned molecules (D).
CoMFA 3D-QSAR models
For CoMFA calculations, steric and electrostatic interactions were calculated using three different probes: an sp 3-hybridized carbon atom with +1.0 charge (Csp 3 + 1), a hydrogen atom with +1.0 charge (H + 1), and an sp 3 oxygen atom with −1.0 charge (Osp 3 − 1). Tripos standard and indicator force fields with a distance-dependent dielectric constant at all intersections in a regularly spaced grid (1 and 2 Å) were evaluated ( and ). The default value of 30 kcal/mol was set as the maximum steric and electrostatic energy cutoff. A PLS approach was used to derive 3D-QSAR and the cross-validation with the LOO methodCitation11 to maximize the probability that the results would have predictive validity.
Table 3 Summary of hologram quantitative structure–activity relationship statistical indexes for the influence of various fragment sizes (FS), using atoms (Models 16–21); bonds and connectivity (Models 22–27); or atoms, bonds, and connectivity (Models 28–33) as the fragment distinction parameter
Table 4 Comparative molecular field analysis for alignments I and II using Tripos standard and indicator force fields with a lattice spacing of 2 Å
Table 5 Comparative molecular field analysis for alignment II using lattice spacing of 1 Å and Csp 3 (+1) as the probe atom
Results and discussion
HQSAR models
The dataset used for the HQSAR studies contained the 42 tricyclic phthalimides developed by Verschueren et alCitation9 showing HIV-1 IN inhibitory activity. The chemical structures and biological data of these inhibitors are listed in . The compounds’ distribution in the training (30) and test (12) sets, an important step in the development of QSAR models, was careful, aiming to maximize the test set diversity and to analyze the model prediction accuracy.
HQSAR studies require values to be selected for the parameters that specify the hologram length, as well as the size and type of fragments to be encoded.Citation16 The molecular fragments were generated using the following fragment distinction parameters: atoms, bonds, connections, hydrogen atoms, chirality, and donor/acceptor atoms. The HQSAR models were first generated using the default fragment size (4–7 atoms) combined with various fragment types and various hologram lengths (). To identify how the fragment size could influence the statistical parameters, we tested different fragment sizes (2–5, 3–6, 4–7, 5–8, 6–9, and 7–10 atoms) on the three best fragment distinction parameters of this model having the highest statistical indexes (models 1, 10, and 15) ().
The best HQSAR model for these HIV-1 IN inhibitors was found to be model 28, with atoms, bonds, and connectivity as the fragment distinction parameters, and 2–5 atoms as the fragment size, showing good predictive capacity (q 2 = 0.802), high data fitting (r 2 = 0.972), and low cross-validated standard error (SEcv = 0.340) ().
HQSAR contribution maps
According to the HQSAR method, it is possible to predict the activity value of a molecule by mapping its structural fragments. Thus, HQSAR contribution map analysis is an important step toward understanding the individual atomic contributions to the biological activities through a color code. This code ranges from red to green in a spectrum indicating favorable (yellow, green blue, and green), neutral (white), and unfavorable (red, red orange, and orange) contributions ().
Figure 2 The hologram quantitative structure–activity relationship contribution maps of the most (33) and least (8) potent HIV-1 integrase inhibitors.
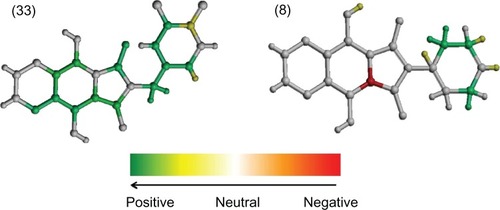
The fragment contribution map of the most active compound, 33, shows no fragments with negative contribution (). As can be seen, the carbonyl-hydroxy-aromatic nitrogen motif was colored white and green, indicating neutral and positive contributions to activity, respectively, since this moiety is common for all compounds and provides a structural scaffold for holding the pharmacophoric groups in suitable orientation for maximum complementarity with the catalytic site of HIV-1 IN.Citation9 Furthermore, the carbonyl and hydroxyl oxygens could chelate the Mg2+ ion in the active site, an essential interaction for enzyme inhibition.Citation9,Citation17,Citation18
In addition, the methylene spacer (colored green) that links the phthalimide nitrogen to the 3,4-dichlorophenyl group (mostly colored green and yellow) in compound 33 appears to be important for directing this bulky aromatic group in the active site of the enzyme, as suggested by docking studies.Citation7 This is consistent with benzodioxoles 13, 14, and 15, since the compound with one methylene spacer (14) was more potent than that with none (13) or with two (15) methylene spacers.Citation7
CoMFA models
In the present work, all CoMFA models were derived using the same training and test sets as in the HQSAR analysis. To validate the reliability of these models, all important statistical parameters were analyzed, including LOO cross-validated correlation coefficient (q 2), non-cross-validated correlation coefficient (r 2), standard error of the estimate (SEE) and F-statistic values. To see how the alignment rule could influence the predictive capability of a model, two different alignments, I and II, were proposed, and three different probe atoms and lattice spacing (1 and 2 Å) were performed to obtain the best model. The statistical results obtained from the CoMFA models are summarized in .
The PLS statistical analyses performed for alignment I showed that the best model generated was self-consistent (r 2 = 0.973), with good predictive ability (q 2 = 0.625), and low SEE (0.130), with optimum number of components (six) determined by SAMPLS (sample–distance PLS) analysis implemented in SYBYL-X 1.1. As can be seen in , this model was obtained using a carbon sp 3 (+1) probe atom in an indicator force field,Citation19 with a lattice spacing of 2 Å. In alignment II, the PLS statistical parameters were better than those generated for alignment I (q 2 = 0.748, r 2 = 0.974, and SEE = 0.127) (). Despite the fact that the statistical results for alignments I and II both provided consistent data, alignment II was selected as the best model.
With the objective of evaluating the influence of steric and electrostatic interaction energies for model generation, the value of the grid spacing was decreased to 1 Å using both force fields (standard and indicator) and the carbon sp 3 (+1) probe atom (). After reducing the cell size to 1 Å, no improvement was observed in q 2 values (predictive model), although some statistical parameters, such as r 2, F-value, and SEE, presented with better values when compared with the best model generated with the 2 Å cell size. Normally, 3D-QSAR studies with a q 2 value >0.5 are considered statistically significant, but q 2 alone is not sufficient to assess the predictive power of a QSAR model.Citation20 Thus, external validation is the only way to establish a reliable QSAR model. In this study, the best model was validated using the test set of 12 compounds, which was used to predict the activities of the test set.
CoMFA contour maps
CoMFA steric and electrostatic contour maps are useful in the context of ligand–receptor interactions. Furthermore, these contour maps can help identify areas where changes in steric or electrostatic fields can affect biological activity and indicate important regions for ligand interaction with the receptor site. Moreover, the absence of a field does not necessarily mean that a particular pharmacophore is not important for activity; but, according to the generated model, all derivatives exert the same influence at that point.
The analysis of the steric and electrostatic contour maps was made only with the model generated by alignment II (q 2 = 0.748). The steric and electrostatic contributions of the final model were 97% and 3%, respectively. This means that the model was more influenced by the steric field around tricyclic phthalimides than the electrostatic field. The CoMFA contour maps of the most (33) and least (8) active compounds are shown in .
Figure 3 Comparative molecular field analysis contour maps for steric field with the most (33; A) and least (8; B) active compounds.
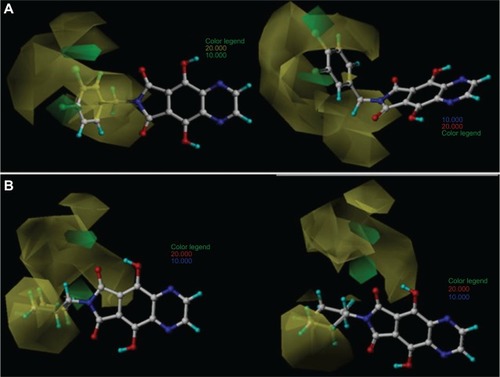
The green contour characterizes the regions where bulky substituents would increase the HIV-1 IN inhibitory activity, whereas the yellow contour indicates the regions where steric bulk would decrease the activity. The contributions of the green and yellow contours were maintained at the default values of 80% and 20%, respectively.
shows two favorable green regions for compound 33 located close to the meta and para positions of the benzyl group (R1 substituent), mainly near the two (orto and para) chlorine atoms. This indicates that bulky groups at those positions are favorable and this accounts for the high biological activity of 33. The several unfavorable yellow regions spread around the benzyl group indicate that bulky groups at those positions would significantly reduce the binding affinity. In the contour map of the most active compound, 33 (), it can be observed that the benzyl group is planar and does not touch the yellow regions, while in the map of the least active compound, 8 (), the piperidine ring (R1 substituent) is localized in the yellow prohibitive regions.
External validation of the best HQSAR and CoMFA models
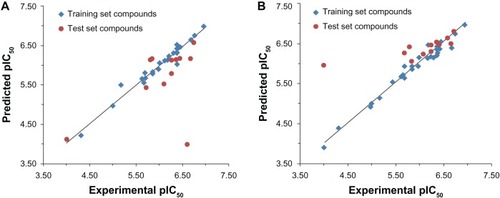
The experimental pIC50, predicted pIC50, and residual values of the tricyclic phthalimide HIV-1 IN inhibitors obtained for the best HQSAR and CoMFA models are reported in . The comparison plots between the experimental and predicted potencies of both the training and test sets using the best HQSAR and CoMFA models are shown in .
Table 6 Experimental and predicted pIC50 values of training and test set compounds
Figure 4 Plot of experimental versus predicted pIC50 values of the training and test sets of the tricyclic phthalimide HIV-1 integrase inhibitors by comparative molecular field analysis (A) and hologram quantitative structure–activity relationship (B).
In this work, we considered as outliers all compounds of the training and test sets whose differences between experimental and predicted activities exceeded 2.0 standard deviations (SD) from the mean of the residuals (HQSAR 2*SD = 0.68 and CoMFA 2*SD = 0.90).Citation21 According to this criterion, there was one outlier for each model: compound 1 for HQSAR and compound 3 for CoMFA.
The HQSAR outlier, 1, presented the highest residual value (-1.95), but it must be remembered that this compound belonged to the test set and did not take part in the model building process. Derivative 1 is analogous to 26, one of the most potent tricyclic phthalimide inhibitors, and both have the same 4-fluorobenzyl group as the R1 substituent, differing only in the first ring (). The HQSAR models overestimated the biological potency of 1 probably because it has a similar fingerprint to compound 26.
The CoMFA outlier, 3, which also belongs to the test set, presented the highest residual value (2.59). In this case, the CoMFA model underestimated the biological activity of 3 because this derivative has structural difference in the first ring.
Conclusion
The methylene spacer that links the phthalimide nitrogen to the 3,4-dichlorophenyl group in compound 33 appears to be important for directing this bulky aromatic group in the active site of the enzyme, as suggested by docking studies.Citation7 Predictable and statistically significant CoMFA and HQSAR models of tricyclic phthalimide HIV-1 IN inhibitors were obtained. The CoMFA model emphasized the importance of the steric descriptor field, as it explained nearly 97% of the variance in HIV-1 IN inhibitory activity. The inhibitory activities of the external test set of compounds were well predicted and explain the statistical robustness of the CoMFA and HQSAR models created. This could be useful in the development of newer molecules that are structurally related to these HIV-1 IN inhibitors. The CoMFA contour map analysis showed two favorable green regions located close to the meta and para positions of the benzyl group (R1 substituent), mainly near the two (orto and para) chlorine atoms for compound 33. This indicates that bulky groups at those positions are favorable for activity, which accounts for the increased activity of the inhibitors in this series. A successful HQSAR model should provide important information about which molecular fragments are directly related to the biological activity, apart from predicting the activities of the untested molecules. Together, these data would be useful for designing new compounds with potent HIV-1 IN inhibitory activity.
Acknowledgments
Financial support from Fundação de Amparo à Pesquisa do Estado do Rio de Janeiro (FAPERJ), Conselho Nacional de Desenvolvimento Científico e Tecnológico (CNPq), and Coordenação de Aperfeiçoamento de Pessoal de Nível Superior (CAPES) was received for this study.
Disclosure
Other than the funding received for this study outlined in the Acknowledgments section, the authors declare no conflicts of interest in this work.
References
- Joint United Nations Programme on HIV and AIDS (UNAIDS) UNAIDS Report on the Global AIDS Epidemic: 2010 Washington UNAIDS 2010 Available from: http://www.unaids.org/globalreport/global_report.htm Accessed July 2, 2013
- Koppensteiner H Brack-Werner R Schindler M Macrophages and their relevance in Human Immunodeficiency Virus Type I infection Retrovirology 2012 9 82 23035819
- Nguyen BY Isaacs RD Teppler H Raltegravir: the first HIV-1 integrase strand transfer inhibitor in the HIV armamentarium Ann NY Acad Sci 2011 1222 83 89 21434946
- Mullard A 2012 FDA drug approvals Nat Rev Drug Discov 2013 12 2 87 90 23370234
- Mesplède T Quashie PK Wainberg MA Resistance to HIV integrase inhibitors Curr Opin HIV AIDS 2012 7 5 401 408 22789986
- Mouscadet JF Delelis O Marcelin AG Tchertanov L Resistance to HIV-1 integrase inhibitors: A structural perspective Drug Resist Updat 2010 13 4–5 139 150 20570551
- Quashie PK Mesplède T Wainberg MA Evolution of HIV integrase resistance mutations Curr Opin Infect Dis 2013 26 1 43 49 23242340
- Pommier Y Johnson AA Marchand C Integrase inhibitors to treat HIV/AIDS Nat Rev Drug Discov 2005 4 3 236 248 15729361
- Verschueren WG Dierynck I Amssoms KI Design and optimization of tricyclic phtalimide analogues as novel inhibitors of HIV-1 integrase J Med Chem 2005 48 6 1930 1940 15771437
- Heritage TW Lowis DR Molecular hologram QSAR ACS Symposium Series 1999 719 212 225
- Cramer RD Patterson DE Bunce JD Comparative molecular field analysis (CoMFA). 1. Effect of shape on binding of steroids to carrier proteins J Am Chem Soc 1988 110 18 5959 5967 22148765
- Rodrigues CR Flaherty TM Springer C McKerrow JH Cohen FE CoMFA and HQSAR of acylhydrazide cruzain inhibitors Bioorg Med Chem Lett 2002 12 11 1537 1541 12031337
- Burt SK Hutchins CW Greer J Predicting receptor-ligand interactions Curr Opin Struct Biol 1991 1 2 213 218
- de Brito MA Rodrigues CR Cirino JJ Residue-ligand interaction energy (ReLIE) on a receptor-dependent 3D-QSAR analysis of S- and NH-DABOs as non-nucleoside reverse transcriptase inhibitors Molecules 2012 17 7 7666 7694 22732882
- Yu L Cao R Yi W Synthesis of 4-[(diethylamino)methyl]-phenol derivatives as novel cholinesterase inhibitors with selectivity towards butyrylcholinesterase Bioorg Med Chem Lett 2010 20 11 3254 3258 20452769
- de Souza SD de Souza AM de Sousa AC Hologram QSAR models of 4-[(diethylamino)methyl]-phenol inhibitors of acetyl/butyrylcholinesterase enzymes as potential anti-Alzheimer agents Molecules 2012 17 8 9529 9539 22878227
- Kawasuji T Fuji M Yoshinaga T Sato A Fujiwara T Kiyama R A platform for designing HIV integrase inhibitors. Part 2: a two-metal binding model as a potential mechanism of HIV integrase inhibitors Bioorg Med Chem 2006 14 24 8420 8429 17005407
- Agrawal A DeSoto J Fullagar JL Probing chelation motifs in HIV integrase inhibitors Proc Natl Acad Sci U S A 2012 109 7 2251 2256 22308350
- Clark M Cramer RD The probability of chance correlation using partial least-squares (PLS) Quantitative Structure-Activity Relationships 1993 12 2 137 145
- Golbraikh A Tropsha A Beware of q2! J Mol Graph Model 2002 20 4 269 276 11858635
- Pasqualoto KF Ferreira MM Molecular modeling and receptor-dependent (RD) 3D-QSAR approach to a set of antituberculosis derivatives QSAR Comb Sci 2009 28 11–12 1455 1464