
Abstract
The metabolic syndrome (MetS) is marked by abnormalities in central obesity, high blood pressure, high triglycerides, low high-density lipoprotein-cholesterol, and high fasting glucose and appears to be produced by underlying processes of inflammation, oxidative stress, and adipocyte dysfunction. MetS has traditionally been classified based on dichotomous criteria that deny that MetS-related risk likely exists as a spectrum. Continuous MetS scores provide a way to track MetS-related risk over time. We generated MetS severity scores that are sex- and race/ethnicity-specific, acknowledging that the way MetS is manifested may be different by sex and racial/ethnic subgroup. These scores are correlated with long-term risk for type 2 diabetes mellitus and cardiovascular disease. Clinical use of scores like these provide a potential opportunity to identify patients at highest risk, motivate patients toward lifestyle change, and follow treatment progress over time.
Introduction
The ongoing burden of type 2 diabetes mellitus (T2DM) and cardiovascular disease (CVD) – in terms of cost, morbidity, and mortalityCitation1,Citation2 – underscores a need for under-standing the underlying pathogenesis and for motivating patients toward prevention.Citation3,Citation4 Although the pathophysiology for both diseases is complex, T2DM and CVD share underlying processes related to systemic inflammation, oxidative stress, and adipocyte dysfunction.Citation3–Citation8 These processes result in a cluster of risk factors referred to as the metabolic syndrome (MetS).Citation9 MetS is comprised of abnormalities in central obesity, blood pressure, triglycerides, high-density lipoprotein (HDL) cholesterol, and fasting glucose, though the links between these processes continue to be elucidated.Citation10 MetS is highly heritable, underscoring both lifestyle and genetic underpinnings.Citation11 This underscores the potential for identification of individuals at risk for T2DM and CVD and also the opportunity to interrupt these processes with lifestyle modification and other treatments.Citation12
In this review, we will consider the use of MetS as a concept clinically, first in considering traditional MetS criteria and then focusing on more recent linear scoring systems to assess CVD and T2DM risk in patient populations.
Diagnosis and epidemiology of metabolic syndrome using traditional criteria
Traditional MetS criteria
MetS has traditionally been followed as a binary classification (which is to say, you have it or you do not) based on sets of criteria such as those by the National Cholesterol Education Program Adult Treatment Program III (ATP-III)Citation10 and the International Diabetes Federation,Citation13,Citation14 which each require an individual to have abnormalities in at least three of the components but have slightly different cutoff levels to designate abnormalities. The World Health Organization has a set of criteria that additionally requires evidence of insulin resistance, which requires additional laboratory testing such as an oral glucose tolerance test.Citation15 These sets of traditional MetS criteria have had demonstrated utility in their association with long-term risk of future T2DMCitation16,Citation17 and CVD,Citation18,Citation19 with odds ratios for future disease of 5.2 and 1.6, respectively, even if most studies have reported that this predictive ability does not typically appear to go beyond that of the individual components alone.Citation20,Citation21
Epidemiology of MetS
Geography
Given its relationship to obesity, CVD, and T2DM, it is not surprising that the prevalence of MetS varies by geographical region worldwide. However, although there was previously a higher prevalence of MetS in more developed compared to less developed parts of the world, there has been a gradual shift toward high rates in many areas. The overall adult prevalence of 34.7% in the USACitation22 now compares to 33.5% in urban India,Citation23 27.5% in Malaysia,Citation24 29.6% in Brazil,Citation25 and 7.3% in People’s Republic of China.Citation26
Age and sex
The prevalence of MetS increases across the life span,Citation27 with a prevalence of ATP-III MetS of 9.8% in US adolescents aged 12–19 years,Citation28 19% in adults 20–39 years, 34% in adults 40–59 years, and 47% in adults ≥60 years.Citation22 There are sex differences in MetS prevalence that vary across the age range, with a male vs female predominance in adolescence (10.9% vs 6.29%) that reverses by mid-adulthood (18% vs 20% at age 20–39 years) and widens thereafter in later adulthood (42% vs 51% by age ≤60 years).Citation22 In particular, women have a higher prevalence of ATP-III MetS after menopause.Citation29 Interestingly, there is some evidence that CVD risk associated with MetS may differ based on sex, with MetS appearing to confer greater risk among females compared to males.Citation20
Race/ethnicity
The racial/ethnic variation in MetS using traditional criteria bears detailed consideration.Citation27 In the USA, the prevalence of MetS is higher among non-Hispanic Whites (34.1%) and Hispanics (34.3%) compared to non-Hispanic Blacks (30.4%).Citation22 This tendency toward lower prevalence of MetS is particularly pronounced among African American men.Citation27 The low prevalence of traditional MetS among non-Hispanic Blacks is surprising given a higher degree of insulin resistanceCitation30,Citation31 and high rates of T2DMCitation32 and death from CVDCitation2 in this group. This raises concern that MetS may miss risk detection in this group.Citation33,Citation34
Current MetS criteria may not take into account racial/ethnic differences in the way MetS is manifested between racial ethnic groups.Citation12 The International Diabetes Federation and harmonized criteria do allow for different cutoffs of waist circumference by different racial ethnic groups, acknowledging the potential for different thresholds of risk, particularly among Asian and potentially Hispanic individuals.Citation35 But none of the criteria take into account that non-Hispanic Black individuals have lower triglycerides (TG) levels at baseline and are thus less likely to exhibit TG levels above population-based cutoffs,Citation33,Citation34 though as a group non-Hispanic Blacks still have gradual rise in TG with worsening insulin resistance.Citation36 We also found a lower prevalence of low HDL levels among African American adolescent males compared to Whites, a tendency that persisted through adult age ranges.Citation27 This lower prevalence of low HDL was not seen among African American adolescent or adult females, suggesting further sex differences in the classification of MetS.
It may not be surprising, then, that among African Americans, ATP-III MetS has a poorer association with other MetS-related risk factors, including insulin,Citation37 C-reactive protein (CRP),Citation38 and uric acid.Citation39,Citation40 Therefore, if used as a risk predictor, ATP-III MetS may not identify some African American individuals who otherwise appear to have abnormalities associated with CVD risk.
Limitations of traditional MetS criteria
Traditional MetS criteria are further limited by identifying risk only when a person exhibits abnormalities beyond the cutoffs for three of the components. This denies that MetS likely exists as a spectrum of risk, as seen in the increase in risk for individuals who have increasing numbers of abnormalities in the underlying MetS components.Citation20,Citation41 Because of this, it is likely that an individual with measurements in the MetS components just below the threshold for all five components may be at higher risk than someone who just exceeds the cutoffs in three components but has low or normal levels of the other two.
Use of traditional MetS criteria also leads to an inability to follow individuals over time for changes in their MetS status over time (with the exception of being positive or negative for MetS), which has likely contributed to noted instability of the diagnosis over time.Citation42,Citation43
Continuous MetS scores
Over the past several years, continuous measures of MetS have continued to emerge, both as a way to address some of the limitations of traditional MetS criteria and as a means of providing improved statistical power in research studies.Citation44 Techniques for generating these scoring systems have been reviewed elsewhere.Citation44 In general, these scoring systems utilize the MetS components from the ATP-III criteria, with some variation regarding the estimate of adiposity, particularly in pediatric scores. The majority of scores have utilized standardized Z-scores for each of the components, generated from the population being studied. In this approach, these Z-scores are then summed to create an overall estimate of MetS.Citation45–Citation53 Other scores have used principal component analysis,Citation47,Citation54–Citation56 whereas some scores instead use summed centile rankingsCitation57,Citation58 or confirmatory factor analysis.Citation59 Overall, these scores have been generated more commonly in pediatric cohorts compared to adult cohorts, potentially owing to a set of pediatric MetS criteria that is both officially recognized and widely used.
We formulated a set of continuous MetS severity scores that are based on data that are nationally representative for the US population.Citation60,Citation61 To do so, we utilized confirmatory factor analysis on data from the National Health and Nutrition Examination Survey to assess how the five classic MetS components contribute differentially to the latent MetS factor. This acknowledges that the individual MetS components may contribute differentially to an estimate of the overall severity of MetS.
Because of the differences in correlation between MetS and other CVD risk factors by race/ethnicityCitation37–Citation40 and because of the differences in MetS-related risk by sex,Citation20 we performed the confirmatory factor analysis on a sex- and race/ethnicity-specific basis and found differences in the factor loadings of the five MetS components between sex and racial/ethnic groups. We thus formulated equations on a sex- and race/ethnicity-specific basis. We also performed these analyses for both adolescents (aged 12–19 years) and adults (aged 20–64 years). Thus, this yielded a total of 12 age-, sex-, and race/ethnicity-specific basis () used by multiplying a given patient’s clinically measured values by subgroup-specific coefficients – which has fortunately been made more manageable via an online calculator (http://mets.health-outcomes-policy.ufl.edu/calculator/).
Table 1 Equations for sex- and race/ethnicity-specific metabolic syndrome severity Z-score
It should be noted that this approach formulated the score solely based on how the individual MetS components cluster together and not directed at outcomes prediction. This is unlike the Framingham Risk Equation,Citation62 the American Heart Association score,Citation63 the FINRISK scoreCitation64 (all for cardiovascular risk), or the AUSDRISK score,Citation65 or the American Diabetes Association risk scoreCitation66 (both for T2DM risk), which were all formulated based on baseline characteristics using outcomes data to drive the score’s calculation. As we will see, the MetS severity score, despite its roots purely as a MetS severity assessment, does correlate nonetheless with long-term cardiovascular and diabetes outcomes. The unique approach in its formulation may provide additional information regarding the pathophysiological processes behind MetS that is not captured in the outcomes-based score formulation.
Benefits of continuous MetS scores over traditional criteria
As alluded to previously, continuous MetS scores acknowledge that there is a continuum of risk related to the processes underlying abnormalities in the components of MetS. From a clinical perspective, MetS scoring systems such as these (unlike binary MetS criteria) can be used to follow for the degree of change over time in a population,Citation52,Citation67 including assessing potential influences of MetS severity over time,Citation68 comparing differences between sex and racial groups,Citation67 and evaluating for differences in the rate of change by clinical status, such as change over the menopausal transition.Citation69 For example, our recent evaluation for changes in MetS severity during the menopausal transition revealed that Black women in particular have a more rapid rise in MetS severity in the few years leading up to menopause and the perimenopausal period before having a subsequently slower rate of rise after menopause. The overall goal of that and other similar analyses is to determine specific groups or periods of time when changes in MetS-related risk may be highest. These groups or time periods could then be more intensely targeted for lifestyle modification treatment.
Clinical assessment of continuous MetS scores
Associations with other cardiovascular risk factors
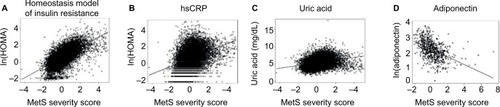
The true utility of continuous MetS scores rests in their ability to estimate risk. The first validation of linear scores of MetS is with other measures associated with cardiovascular risk. Multiple studies demonstrated that continuous MetS scores correlated positively with adverse lifestyle factorsCitation46,Citation50,Citation56,Citation70 or response to exercise training.Citation51 Other studies have used cross-sectional evaluation of continuous scores for linear relationships with other CVD risk factors, such as inflammatory factors and adiponectin.Citation53 Similarly, we found that our score was associated with surrogates of future disease,Citation8 including current levels of fasting insulin, CRP, and uric acid in both adults and children (); associations were true for each of the three racial/ethnic groups for which the score was formulated.Citation60,Citation61 We also evaluated longitudinally collected data to demonstrate long-term associations between childhood MetS scores and adult levels of insulin and adiponectin.Citation71 Finally, Magnussen et alCitation72 used a longitudinal approach of a cohort in Finland with a mean age of 13 years at baseline and 37 years at follow-up. They demonstrated that MetS as assessed in childhood using five different continuous MetS scores (including our score) was significantly linked to carotid intima media thickness during adulthood.Citation72 All these support external validity of continuous MetS scores for estimating the presence of the underlying processes associated with disease risk.
Figure 1 Correlations between MetS severity score and risk factors associated with the pathophysiology of MetS.
Abbreviations: hsCRP, high-sensitivity C-reactive protein; MetS, metabolic syndrome; HOMA, homeostatic model assessment.
Associations with future disease
The more important validation of linear scores of MetS is with long-term outcomes, including CVD and T2DM. This type of data is clearly more difficult to obtain, as it requires several years of follow-up; nevertheless, validations using this approach continue to emerge. Magnussen et alCitation72 evaluated their 24-year follow-up data from adolescence through adulthood, demonstrating that four of the five continuous MetS scores evaluated were associated with future risk for T2DM. For example, one of the scores tested was our MetS severity score, with a relative risk of future T2DM of 1.78 for every standard deviation (SD) increase in MetS severity.Citation72 Povel et alCitation59 evaluated a large Dutch cohort of adults (mean age 49 years) for future T2DM and CVD, reporting that each SD of continuous MetS score carried a hazard ratio of 3.58 for future T2DM and 1.31 for future CVD.
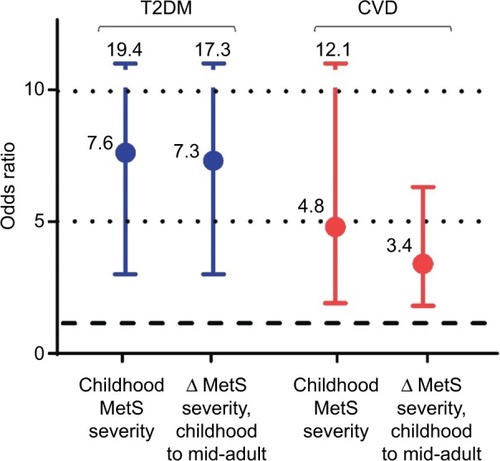
We evaluated long-term outcomes data for our score in a cohort from the Princeton region in Cincinnati, for whom MetS components were assessed as children (mean age 13 years) and adult outcomes were assessed at two time points, at mean ages of 38 and 50 years.Citation73,Citation74 We found that individuals who had developed CVD and/or T2DM by age 38 had significantly higher MetS severity scores in childhood. Each increase in 1 SD in score at childhood increased the odds of disease by age 38 years by 9.8 for future CVD and 2.7 for future T2DM. Each SD increase in score for MetS severity as adults (at mean age 38 years) increased the odds for later disease by 2.4 for CVD and 2.8 for T2DM.Citation73,Citation74 This slightly higher odds ratio for future T2DM is similar to the analysis of Povel et al,Citation59 who evaluated baseline MetS among adults and found a higher hazard ratio for future T2DM (2.7) than for CVD (1.25). Interestingly, the change in MetS severity score between childhood and adulthood carried further increases in risk for future disease, emphasizing the potential utility to follow the score over time ().Citation73,Citation74 Also, MetS severity remained significantly associated with these outcomes, including after the addition of other risk factors such as fasting insulin and adiponectin to these models,Citation71 suggesting that the score may capture additional estimates of risk beyond some current markers for the pathway of insulin sensitivity. Finally, the area under the curve (AUC) for disease prediction by age 38 and 50 years was 0.91 and 0.65 for CVD and 0.69 and 0.68 for T2DM – suggesting a reasonable degree of discrimination between those at risk.Citation73,Citation74
Figure 2 Odds ratios of future T2DM and CVD for every 1-point increase in MetS severity score.
Abbreviations: MetS, metabolic syndrome; CVD, cardiovascular disease; T2DM, type 2 diabetes mellitus.
The value of these correlations between MetS severity and future disease depends partly on the emphasis on sensitivity vs specificity. After reporting these correlations, Magnussen et alCitation72 concluded from their data that continuous MetS scores did not adequately discriminate between individuals at risk for adult outcomes. Our data suggested a higher degree of discrimination (AUC: 0.68 for T2DM) compared to theirs (AUC: 0.62),Citation75 though we were still unable to determine an obvious cutoff to mark particular increases in risk. Future research will be needed to provide clinically useful thresholds for determination of particularly elevated risk. In addition, combining MetS severity with other risk determinants (such as low-density lipoprotein cholesterol or smoking) or other risk scores (such as the Framingham Risk Equation, the American Heart Association score,Citation63 or the American Diabetes Association risk scoreCitation66) may improve accuracy of risk prediction.
Implications for practitioners
Use of continuous MetS scores provides a potential opportunity for clinicians in 1) determining baseline risk of future disease of their patients and 2) following changes in this disease risk over time. Following confirmative research to demonstrate efficacy, and potential evidence-based guideline recommendations, individuals with particularly high MetS severity could ultimately be started on therapy such as metformin to reduce hepatic glucose productionCitation76 or statins to reduce overall CVD risk, as can be done for elevated CRP levels.Citation4,Citation77 The MetS severity score could then be used for tracking response to treatment. Given the importance of lifestyle modification for improvement of MetS-related disease risk,Citation78 elevated levels may also be used to motivate patients toward physical activity or dietary changes.Citation12 Although it is true that all individuals would benefit from making these lifestyle changes, such changes clearly carry a greater short-term risk reduction among some patients more than others. The potential for motivation is illustrated well by the National Weight Control Registry, a cohort of individuals who lost at least 13.6 kg of weight and kept it off for at least 1 year. Among registry members, 83% reported a specific trigger leading to their lifestyle changes and 23% listed this as a medical reason, including their physician’s recommendation.Citation79 An elevated MetS severity score could be one of those triggers that strikes provide patients in a predisease state and offers them an opportunity to make changes to avoiding later disease. These scores patients with a single number on which to focus (integrated from multiple risk factors) that may be more easily followed than following variable changes in multiple risk factors at once.
However, as alluded to previously, clinical use of these scores will benefit from defined cutoffs that indicate particularly high-risk patients. The irony of this is that continuous MetS scores were formed alongside traditional MetS criteria in part because of the artificial nature of cutoffs in the individual MetS components and a dichotomous risk categorization. Nevertheless, it is likely that in practice, the MetS scores themselves would be more easily used as risk indicators and patient motivators if they had set cutoffs themselves. This is because such cutoffs could be used to add specificity in counseling individual patients regarding their MetS-related risks. For example, with improved cut-off data, a physician could inform her patient “in long-term studies, individuals with a MetS score such as yours had a 40% chance of having a heart attack within 10 years”. This degree of specificity could thus be used to motivate the patient toward change, and the score could be used to track response to intervention and alterations in risk thereafter.
Another potential limitation to current use of MetS scores is the complexity of calculating the scores. In the case of our score, this is feasible via online calculator (http://mets.healthoutcomes-policy.ufl.edu/calculator/) or potentially through specially prepared spreadsheet programs for score calculations. However, because of the need to enter each component measure individually, calculation of a given patient’s MetS score by the physician during a clinical encounter may require an excessive amount of time. Thus, use of a MetS-based scoring system in a clinical environment is likely to be best facilitated by support staff (calculating the score using either a website or spreadsheet). Future use will be greatly assisted by automatic calculators in electronic medical records (EMRs). Such EMR calculators will require indicators of fasting status (needed for TG and glucose measures), but will otherwise provide added functionality of pop-up alerts identifying high-risk patients and patients who have exhibited a recent increase in score, triggering an escalation in intervention. One current drawback is that the majority of MetS severity scores require waist circumference measurements (not frequently assessed in clinical encounters); in the case of our score, this limitation will be overcome by a version of the score using body mass index, currently in development.
Thus, in the balance, these scores will experience an increase in clinical use after ongoing research into high-risk thresholds, EMR calculators, and body mass index-based scores – all of which are likely to enhance utility and further these scores for risk identification and patient motivation.
Conclusion
The clear links between MetS and future disease have raised the need for effective tools to identify individuals at highest risk. Continuous MetS scores hold promise as a way to integrate the abnormalities in multiple factors and provide an estimate of the severity of the processes driving these abnormalities. With continued research in this area, these scores may open the door toward evaluating CVD and T2DM risk, motivating patients, and tracking treatment progress over time – advances that are much needed for turning the tide on worsening T2DM and CVD worldwide.
Acknowledgments
This work was supported by National Institutes of Health grant 1R01HL120960 (MJG and MDD).
Disclosure
The authors report no conflicts of interest in this work.
References
- Chen L Magliano DJ Zimmet PZ The worldwide epidemiology of type 2 diabetes mellitus – present and future perspectives Nat Rev Endocrinol 2012 8 4 228 236
- Mozaffarian D Benjamin EJ Go AS Heart disease and stroke statistics – 2016 update: a report from the American Heart Association Circulation 2016 133 4 e38 e360 26673558
- de Ferranti S Mozaffarian D The perfect storm: obesity, adipocyte dysfunction, and metabolic consequences Clin Chem 2008 54 6 945 955 18436717
- DeBoer MD Obesity, systemic inflammation, and increased risk for cardiovascular disease and diabetes among adolescents: a need for screening tools to target interventions Nutrition 2013 29 2 379 386 23022122
- Ford ES Ajani UA Mokdad AH The metabolic syndrome and concentrations of C-reactive protein among U.S. youth Diabetes Care 2005 28 4 878 881 15793189
- Forman JP Choi H Curhan GC Plasma uric acid level and risk for incident hypertension among men J Am Soc Nephrol 2007 18 1 287 292 17167112
- Gagliardi AC Miname MH Santos RD Uric acid: a marker of increased cardiovascular risk Atherosclerosis 2009 202 1 11 17 18585721
- DeBoer MD Gurka MJ Ability among adolescents for the metabolic syndrome to predict elevations in factors associated with type 2 diabetes and cardiovascular disease: data from the national health and nutrition examination survey 1999–2006 Metab Syndr Relat Disord 2010 8 4 343 353 20698802
- Reaven GM Banting lecture 1988. Role of insulin resistance in human disease Diabetes 1988 37 12 1595 1607 3056758
- Grundy SM Cleeman JI Daniels SR Diagnosis and management of the metabolic syndrome – an American Heart Association/National Heart, Lung, and Blood Institute Scientific Statement Circulation 2005 112 17 2735 2752 16157765
- Bosy-Westphal A Onur S Geisler C Common familial influences on clustering of metabolic syndrome traits with central obesity and insulin resistance: the Kiel obesity prevention study Int J Obes (Lond) 2007 31 5 784 790 17047637
- DeBoer MD Ethnicity, obesity and the metabolic syndrome: implications on assessing risk and targeting intervention Expert Rev Endocrinol Metab 2011 6 2 279 289 21643518
- Zimmet P Alberti G Kaufman F The metabolic syndrome in children and adolescents Lancet 2007 369 9579 2059 2061 17586288
- Alberti KG Zimmet P Shaw J Metabolic syndrome – a new worldwide definition. A Consensus Statement from the International Diabetes Federation Diabet Med 2006 23 5 469 480 16681555
- Alberti KG Zimmet PZ Definition, diagnosis and classification of diabetes mellitus and its complications. Part 1: diagnosis and classification of diabetes mellitus provisional report of a WHO consultation Diabet Med 1998 15 7 539 553 9686693
- Wannamethee SG Shaper AG Lennon L Morris RW Metabolic syndrome vs Framingham Risk Score for prediction of coronary heart disease, stroke, and type 2 diabetes mellitus Arch Intern Med 2005 165 22 2644 2650 16344423
- Morrison JA Friedman LA Wang P Glueck CJ Metabolic syndrome in childhood predicts adult metabolic syndrome and type 2 diabetes mellitus 25 to 30 years later J Pediatr 2008 152 2 201 206 18206689
- Mottillo S Filion KB Genest J The metabolic syndrome and cardiovascular risk a systematic review and meta-analysis J Am Coll Cardiol 2010 56 14 1113 1132 20863953
- Morrison JA Friedman LA Gray-McGuire C Metabolic syndrome in childhood predicts adult cardiovascular disease 25 years later: the Princeton Lipid Research Clinics follow-up study Pediatrics 2007 120 2 340 345 17671060
- McNeill AM Schmidt MI Rosamond WD The metabolic syndrome and 11-year risk of incident cardiovascular disease in the atherosclerosis risk in communities study Diabetes Care 2005 28 2 385 390 15677797
- Malik S Wong ND Franklin SS Impact of the metabolic syndrome on mortality from coronary heart disease, cardiovascular disease, and all causes in United States adults Circulation 2004 110 10 1245 1250 15326067
- Aguilar M Bhuket T Torres S Liu B Wong RJ Prevalence of the metabolic syndrome in the United States, 2003–2012 JAMA 2015 313 19 1973 1974 25988468
- Prasad DS Kabir Z Dash AK Das BC Prevalence and risk factors for metabolic syndrome in Asian Indians: a community study from urban Eastern India J Cardiovasc Dis Res 2012 3 3 204 211 22923938
- Rampal S Mahadeva S Guallar E Ethnic differences in the prevalence of metabolic syndrome: results from a multi-ethnic population-based survey in Malaysia PLoS One 2012 7 9 e46365 23029497
- de Carvalho Vidigal F Bressan J Babio N Salas-Salvadó J Prevalence of metabolic syndrome in Brazilian adults: a systematic review BMC Public Health 2013 13 1198 24350922
- Lao XQ Zhang YH Wong MC The prevalence of metabolic syndrome and cardiovascular risk factors in adults in southern China BMC Public Health 2012 12 64 22264227
- Walker SE Gurka MJ Oliver MN Johns DW DeBoer MD Racial/ethnic discrepancies in the metabolic syndrome begin in childhood and persist after adjustment for environmental factors Nutr Metab Cardiovasc Dis 2012 22 2 141 148 20708390
- Lee AM Gurka MJ DeBoer MD Trends in metabolic syndrome severity and lifestyle factors among adolescents Pediatrics 2016 137 3 1 9
- Janssen I Powell LH Crawford S Lasley B Sutton-Tyrrell K Menopause and the metabolic syndrome: the Study of Women’s Health Across the Nation Arch Intern Med 2008 168 14 1568 1575 18663170
- Arslanian S Suprasongsin C Differences in the in vivo insulin secretion and sensitivity of healthy black versus white adolescents J Pediatr 1996 129 3 440 443 8804335
- Arslanian S Suprasongsin C Janosky JE Insulin secretion and sensitivity in black versus white prepubertal healthy children J Clin Endocrinol Metab 1997 82 6 1923 1927 9177407
- Cowie CC Rust KF Byrd-Holt DD Prevalence of diabetes and high risk for diabetes using A1C criteria in the U.S. population in 1988–2006 Diabetes Care 2010 33 3 562 568 20067953
- Sumner AE Ethnic differences in triglyceride levels and high-density lipoprotein lead to underdiagnosis of the metabolic syndrome in black children and adults J Pediatr 2009 155 S7 e7 e11
- DeBoer MD Underdiagnosis of metabolic syndrome in non-Hispanic black adolescents: a call for ethnic-specific criteria Curr Cardiovasc Risk Rep 2010 4 4 302 310 21379366
- Alberti KG Eckel RH Grundy SM Harmonizing the metabolic syndrome: a joint interim statement of the International Diabetes Federation Task Force on Epidemiology and Prevention; National Heart, Lung, and Blood Institute; American Heart Association; World Heart Federation; International Atherosclerosis Society; and International Association for the Study of Obesity Circulation 2009 120 16 1640 1645 19805654
- Sumner AE Cowie CC Ethnic differences in the ability of triglyceride levels to identify insulin resistance Atherosclerosis 2008 196 2 696 703 17254586
- DeBoer MD Dong L Gurka MJ Racial/ethnic and sex differences in the ability of metabolic syndrome criteria to predict elevations in fasting insulin levels in adolescents J Pediatr 2011 159 6 975 981 21784441
- DeBoer MD Gurka MJ Sumner AE Diagnosis of the metabolic syndrome is associated with disproportionately high levels of high-sensitivity c-reactive protein in non-Hispanic black adolescents: an analysis of NHANES 1999–2008 Diabetes Care 2011 34 3 734 740 21285387
- DeBoer MD Dong L Gurka MJ Racial/ethnic and sex differences in the relationship between uric acid and metabolic syndrome in adolescents: an analysis of National Health and Nutrition Survey 1999–2006 Metabolism 2012 61 4 554 561 22000606
- DeBoer MD Gurka MJ Low sensitivity for the metabolic syndrome to detect uric acid elevations in females and non-Hispanic-black male adolescents: an analysis of NHANES 1999–2006 Atherosclerosis 2012 220 2 575 580 22178428
- Ford ES Li C Cook S Choi HK Serum concentrations of uric acid and the metabolic syndrome among US children and adolescents Circulation 2007 115 19 2526 2532 17470699
- Gustafson JK Yanoff LB Easter BD The stability of metabolic syndrome in children and adolescents J Clin Endocrinol Metab 2009 94 12 4828 4834 19837941
- Li C Ford ES Huang TTK Sun SS Goodman E Patterns of change in cardiometabolic risk factors associated with the metabolic syndrome among children and adolescents: the Fels Longitudinal Study J Pediatr 2009 155 3 S5.e9 16
- Eisenmann JC On the use of a continuous metabolic syndrome score in pediatric research Cardiovasc Diabetol 2008 7 17 18534019
- Andersen LB Harro M Sardinha LB Physical activity and clustered cardiovascular risk in children: a cross-sectional study (The European Youth Heart Study) Lancet 2006 368 9532 299 304 16860699
- Brage S Wedderkopp N Ekelund U Features of the metabolic syndrome are associated with objectively measured physical activity and fitness in Danish children: the European Youth Heart Study (EYHS) Diabetes Care 2004 27 9 2141 2148 15333475
- Batey LS Goff DC Tortolero SR Summary measures of the insulin resistance syndrome are adverse among Mexican-American versus non-Hispanic white children: the Corpus Christi Child Heart Study Circulation 1997 96 12 4319 4325 9416899
- Eisenmann JC Katzmarzyk PT Perusse L Tremblay A Després JP Bouchard C Aerobic fitness, body mass index, and CVD risk factors among adolescents: the Québec family study Int J Obes (Lond) 2005 29 9 1077 1083 15917844
- Eisenmann JC Laurson KR DuBose KD Smith BK Donnelly JE Construct validity of a continuous metabolic syndrome score in children Diabetol Metab Syndr 2010 2 8 20181030
- Okosun IS Lyn R Davis-Smith M Eriksen M Seale P Validity of a continuous metabolic risk score as an index for modeling metabolic syndrome in adolescents Ann Epidemiol 2010 20 11 843 851 20933191
- Johnson JL Slentz CA Houmard JA Exercise training amount and intensity effects on metabolic syndrome (from Studies of a Targeted Risk Reduction Intervention through Defined Exercise) Am J Cardiol 2007 100 12 1759 1766 18082522
- Kelly AS Steinberger J Jacobs DR Hong CP Moran A Sinaiko AR Predicting cardiovascular risk in young adulthood from the metabolic syndrome, its component risk factors, and a cluster score in childhood Int J Pediatr Obes 2011 6 2–2 e283 289 21070100
- Olza J Aguilera CM Gil-Campos M A continuous metabolic syndrome score is associated with specific biomarkers of inflammation and CVD risk in prepubertal children Ann Nutr Metab 2015 66 2–3 72 79 25612676
- Katzmarzyk PT Pérusse L Malina RM Bergeron J Després JP Bouchard C Stability of indicators of the metabolic syndrome from childhood and adolescence to young adulthood: the Québec Family Study J Clin Epidemiol 2001 54 2 190 195 11166535
- Wijndaele K Beunen G Duvigneaud N A continuous metabolic syndrome risk score: utility for epidemiological analyses Diabetes Care 2006 29 10 2329
- Healy GN Wijndaele K Dunstan DW Objectively measured sedentary time, physical activity, and metabolic risk: the Australian Diabetes, Obesity and Lifestyle Study (AusDiab) Diabetes Care 2008 31 2 369 371 18000181
- Bao W Srinivasan SR Wattigney WA Berenson GS Persistence of multiple cardiovascular risk clustering related to syndrome X from childhood to young adulthood. The Bogalusa Heart Study Arch Intern Med 1994 154 16 1842 1847 8053753
- Raitakari OT Porkka KV Räsänen L Rönnemaa T Viikari JS Clustering and six year cluster-tracking of serum total cholesterol, HDL-cholesterol and diastolic blood pressure in children and young adults. The Cardiovascular Risk in Young Finns Study J Clin Epidemiol 1994 47 10 1085 1093 7722541
- Povel CM Beulens JW van der Schouw YT Metabolic syndrome model definitions predicting type 2 diabetes and cardiovascular disease Diabetes Care 2013 36 2 362 368 22933442
- Gurka MJ Ice CL Sun SS DeBoer MD A confirmatory factor analysis of the metabolic syndrome in adolescents: an examination of sex and racial/ethnic differences Cardiovasc Diabetol 2012 11 128 23062212
- Gurka MJ Lilly CL Norman OM DeBoer MD An examination of sex and racial/ethnic differences in the metabolic syndrome among adults: a confirmatory factor analysis and a resulting continuous severity score Metabolism 2014 63 2 218 225 24290837
- D’Agostino RB Vasan RS Pencina MJ General cardiovascular risk profile for use in primary care: the Framingham Heart Study Circulation 2008 117 6 743 753 18212285
- Goff DC Lloyd-Jones DM Bennett G 2013 ACC/AHA guideline on the assessment of cardiovascular risk: a report of the American College of Cardiology/American Heart Association Task Force on Practice Guidelines Circulation 2014 129 25 Suppl 2 S49 S73 24222018
- Saaristo T Peltonen M Lindström J Cross-sectional evaluation of the Finnish Diabetes Risk Score: a tool to identify undetected type 2 diabetes, abnormal glucose tolerance and metabolic syndrome Diab Vasc Dis Res 2005 2 2 67 72 16305061
- Chen L Magliano DJ Balkau B AUSDRISK: an Australian Type 2 Diabetes Risk Assessment Tool based on demographic, lifestyle and simple anthropometric measures Med J Aust 2010 192 4 197 202 20170456
- American Diabetes Association Type 2 Diabetes Risk Test, 2015 Available at http://www.diabetes.org/are-you-at-risk/diabetes-risk-test Accessed 17 August 2016
- Vishnu A Gurka MJ DeBoer MD The severity of the metabolic syndrome increases over time within individuals, independent of baseline metabolic syndrome status and medication use: the Atherosclerosis Risk in Communities Study Atherosclerosis 2015 243 1 278 285 26409627
- Gurka MJ Vishnu A Okereke OI Musani S Sims M DeBoer MD Depressive symptoms are associated with worsened severity of the metabolic syndrome in African American women independent of lifestyle factors: a consideration of mechanistic links from the Jackson heart study Psychoneuroendocrinology 2016 68 82 90 26963374
- Gurka MJ Vishnu A Santen RJ DeBoer MD Progression of metabolic syndrome severity during the menopausal transition J Am Heart Assoc 2016 5 8 Pii e003609 27487829
- Wijndaele K Duvigneaud N Matton L Sedentary behaviour, physical activity and a continuous metabolic syndrome risk score in adults Eur J Clin Nutr 2009 63 3 421 429 17971826
- DeBoer MD Gurka MJ Morrison JA Woo JG Inter-relationships between the severity of metabolic syndrome, insulin and adiponectin and their relationship to future type 2 diabetes and cardiovascular disease Int J Obes (Lond) Epub 2016 5 24
- Magnussen CG Cheriyan S Sabin MA Continuous and dichotomous metabolic syndrome definitions in youth predict adult type 2 diabetes and carotid artery intima media thickness: the cardiovascular risk in Young Finns Study J Pediatr 2016 171 97 103 e1 3 26681473
- DeBoer MD Gurka MJ Woo JG Morrison JA Severity of metabolic syndrome as a predictor of cardiovascular disease between childhood and adulthood: the Princeton Lipid Research Cohort Study J Am Coll Cardiol 2015 66 6 755 757 26248997
- DeBoer MD Gurka MJ Woo JG Morrison JA Severity of the metabolic syndrome as a predictor of type 2 diabetes between childhood and adulthood: the Princeton Lipid Research Cohort Study Diabetologia 2015 58 12 2745 2752 26380985
- Magnussen CG Cheriyan S Sabin MA Continuous and dichotomous metabolic syndrome definitions in youth predict adult type 2 diabetes and carotid artery intima media thickness: the cardiovascular risk in Young Finns Study (Correction) J Pediatr 2016 172 231 232 27112089
- Natali A Ferrannini E Effects of metformin and thiazolidinediones on suppression of hepatic glucose production and stimulation of glucose uptake in type 2 diabetes: a systematic review Diabetologia 2006 49 3 434 441 16477438
- Ridker PM Rifai N Rose L Buring JE Cook NR Comparison of C-reactive protein and low-density lipoprotein cholesterol levels in the prediction of first cardiovascular events N Engl J Med 2002 347 20 1557 1565 12432042
- Nupponen M Pahkala K Juonala M Metabolic syndrome from adolescence to early adulthood: effect of infancy-onset dietary counseling of low saturated fat: the Special Turku Coronary Risk Factor Intervention Project (STRIP) Circulation 2015 131 7 605 613 25605660
- Wing RR Anglin K Effectiveness of a behavioral weight control program for blacks and whites with NIDDM Diabetes Care 1996 19 5 409 413 8732700