

Abstract
Background
Follistatin (Fst) promotes brown adipocyte characteristics in adipose tissues.
Methods
Abdominal fat volume (CT scan), glucose clearance (GTT test), and metabolomics analysis (mass spectrometry) of adipose tissues from Fst transgenic (Fst-Tg) and wild type (WT) control mice were analyzed. Oxygen consumption (Seahorse Analyzer) and lipidomics (gas chromatography) was analyzed in 3T3-L1 cells.
Results
Fst-Tg mice show significant decrease in abdominal fat content, increased glucose clearance, improved plasma lipid profiles and significant changes in several conventional metabolites compared to the WT mice. Furthermore, overexpression of Fst in 3T3-L1 cells resulted in up regulation of key brown/beige markers and changes in lipidomics profiles.
Conclusion
Fst modulates key factors involved in promoting metabolic syndrome and could be used for therapeutic intervention.
Acknowledgments
The authors would like to acknowledge Metabolon Inc. (Morrisville, NC, USA) (www.metabolon.com) and UC Davis Metabolomics Core Services (http://metabolomics.ucdavis.edu/core-services/metabolomics-central-service-core) for adipose tissue metabolomics profiling and cell lysate lipidomics profiling, respectively. They would also like to thank the expert technical assistance from Melissa Braga and Dr Meher Parveen. This work was supported by National Institute of Health Grants SC1AG049682 (RS) and SC1CA1658650 (SP), and in part by RO1HL071776 (STR), R01AR060636 (SJL), and S21MD000103 (RS, SP) grants. CT scanning was done at UCLA Molecular Imaging services core.
Disclosure
The authors report no conflicts of interest in this work.
Supplementary materials
Figure S1 (A) Vector map of PiggyBac-CMV-Fst-Puro. (B) Polymerase chain reaction analysis confirming Fst insertion in the PiggyBac-CMV-Fst-Puro construct.
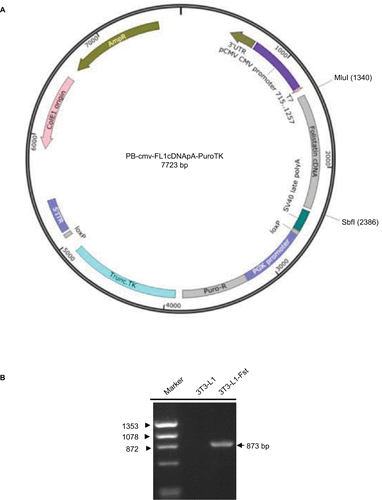
Figure S2 Analysis of Mup1 expression in liver tissues from WT and Fst-Tg mice. Immunohistochemical analysis (A) and quantitative image analysis (B) of tissues sections. Integrated optical density (immunopositive area × intensity). Quantitation was performed using 20 images from 4 different areas as described previously.1–3 Analysis of Mup1 protein (C) and gene expression (D) by Western blot and quantitative real-time polymerase chain reaction analysis using standard procedures. Data are expressed as mean ± SD. *P≤0.05; **P≤0.01.
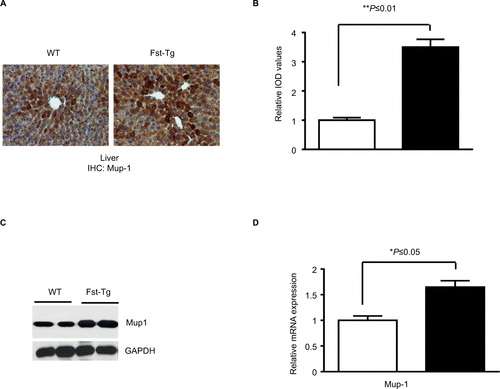
Figure S3 Real-time quantitative polymerase chain reaction analysis of C2C12 and Fst overexpressing (C2C12-Fst) myoblast cells to compare gene expression profiles of key BCAA metabolizing enzymes. Data are expressed as mean ± SD. *P≤0.05; **P≤0.01 (n=3).
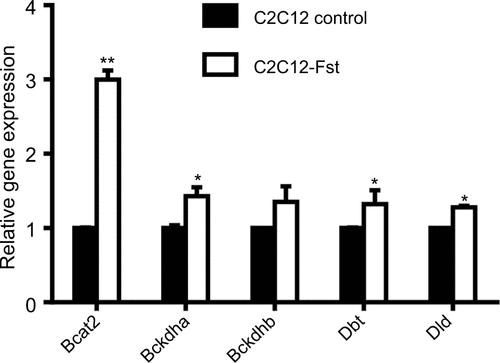
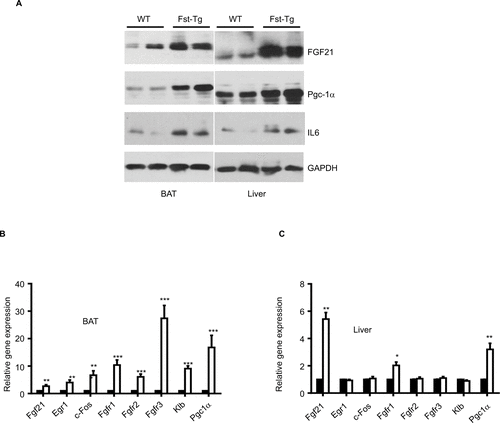
Figure S4 Analysis of FGF21-associated markers in BAT and liver tissues from 6-weeks-old male WT and Fst-Tg mice. (A) Western blot analysis of FGF21, PGC-1α, and IL-6 proteins. (B to C) Quantitative gene expression analysis of FGF21, its receptors (Fgfr1-3), and beta-klotho (Klb) in BAT and liver tissues from WT and Fst-Tg mice. Data are expressed as mean ± SD. *P≤0.05; **P≤0.01; ***P≤0.001 (n=3).
References
- Braga M Bhasin S Jasuja R Pervin S Singh R Testosterone inhibits transforming growth factor-β signaling during myogenic differentiation and proliferation of mouse satellite cells: potential role of follistatin in mediating testosterone action Mol Cell Endocrinol 2012 350 1 39 52 22138414
- Braga M Reddy ST Vergnes L Follistatin promotes adipocyte differentiation, browning, and energy metabolism J Lipid Res 2014 55 3 375 384 24443561
- Singh R Braga M Reddy ST Follistatin targets distinct pathways to promote brown adipocyte characteristics in brown and white adipose tissues Endocrinology 2017 158 5 1217 1230 28324027