
Abstract
Background
Body mass index (BMI) and percentage of body fat (PBF) are used to measure obesity; however, their performance in identifying cardiometabolic risk in Southeast Asians is unclear. Generally, Asian women have higher PBF and lower BMI than do men and other ethnic populations. This study was conducted to address whether a discord exists between these measures in predicting obesity-related cardiometabolic risk in a Thai population and to test whether associations between the measures and risk factors for cardiovascular disease have a sex-specific inclination.
Methods
A total of 234 (76 men and 158 women) outpatients were recruited. BMI obesity cutoff points were ≥25.0 and ≥27.0 kg/m2 and PBF cutoff points were ≥35.0% and ≥25.0% for women and men, respectively. Blood samples were analyzed for total cholesterol, triglycerides, low-density lipoprotein-cholesterol, high-density lipoprotein-cholesterol, lipoprotein subclasses, apolipoprotein A-I, apolipoprotein B, glucose, hemoglobin A1c, insulin, high-sensitive C-reactive protein (hsCRP), adiponectin, leptin, and 25-hydroxyvitamin D.
Results
Twenty-five percent of participants classified as normal-BMI had excessive fat, whereas 9% classified as normal-PBF had excessive BMI. Good relationships were found between BMI and PBF using sex stratification (R 2 >0.5). The prevalence of metabolic syndrome was markedly increased in overweight and/or excess body fat groups compared with lean group. Logistic regression analyses showed that BMI was the best predictor of hypertension. BMI was an independent predictor of insulin resistance, hyperglycemia, hypertriglyceridemia, and hyperleptinemia in women, whereas PBF was for men. However, PBF proved to be a good indicator for atherogenic lipoprotein particles in both sexes. Notably, neither index predicted increased hsCRP or 25-hydroxyvitamin D insufficiency.
Conclusion
Considerable sex-specific variations were observed between BMI and PBF in their associations with and predictability of numerous cardiometabolic biomarkers. No single measure provides a comprehensive risk predication as shown herein with the Thai population, and therefore both should be applied in screening activities.
Introduction
The prevalence of obesity is increasing globally, and obesity is thus becoming a major public health concern.Citation1,Citation2 The global obesity prevalence is predicted to reach 18% in men and over 21% in women by 2025.Citation2 Obesity results from a lack of balance between calorie intake and energy expenditure, which increases adipose tissue and activates endocrine entities.Citation3 Adipose tissue secretes adipokines, which influence many metabolic functions (including appetite, satiety, energy expenditure, activity, insulin sensitivity and secretion, glucose and lipid metabolism, fat distribution, neuroendocrine regulation, and immune system function). Consequently, obesity plays a major role in causing cardiometabolic complications including hypertension, type II diabetes mellitus, dyslipidemia, and certain cancers.Citation4
Although visceral fat mass and, in particular, liver fat content have been shown to be valuable in predicting cardiometabolic risk, conducting such measurements is limited by costs, availability of instruments, and the requirement of highly trained technicians.Citation5 By contrast, the body mass index (BMI) is easy to use because it is calculated using body weight in kilograms divided by the square of an individual’s height in meters (kg/m2). As such, it is the most commonly used measure of weight status in epidemiology, clinical care, and clinical nutrition. BMI represents weight adjusted for height and aims to represent fat mass, fat-free mass, and body fluid. Scientific evidence indicates that a high BMI is associated with being overweight and obese, and is a predictor for all-cause mortality.Citation6,Citation7 However, BMI does not address fat distribution or discriminate between lean mass and fat mass, and these need to be defined using different methods because they represent body adiposity.Citation8 In this respect, the percentage of body fat (PBF) is an effective measure of adiposity because it has been shown to be associated with metabolic dysregulation, regardless of body weight.Citation9 Large-scale studies have shown that BMI correlates highly with PBF and such correlation is stable with height.Citation10,Citation11 For example, a study conducted on a US adult population demonstrated a high relationship between BMI and PBF, enabling the prediction of PBF based on BMI classification.Citation11 In global clinical practice, both BMI and PBF are widely accepted as accurate measures of obesity.Citation12
On the basis of general trends in the relationship between BMI and morbidity and mortality rates, the World Health Organization uses BMI cutoff points for classifying overweight and obesity in the global adult population that are greater than, or equal to, 25 and 30 kg/m2, respectively.Citation13 These cutoff points have been applied in research and clinical practice, regardless of age, sex, or race/ethnicity.Citation14 However, considering a population-specific BMI cutoff in Asian populations is necessary because Asians have different contributions of bone mass, muscle mass, and fluid to body weight than European populations, resulting in a reduced association between BMI, PBF, and health risk.Citation15 In addition, Asian populations have higher or lower PBF at a specific BMI than white or European populations, and this is dependent on cultural subgroups, social and economic conditions, and nutritional factors.Citation15,Citation16 For example, a recent study conducted with Asian–Americans showed that BMI did not accurately reflect underlying adiposity and thus showed poor sensitivity in detecting PBF, especially in women.Citation17 Women have a higher PBF than men at all ages and in all ethnic groups. A relatively high PBF may put Asian–American women at risk of future obesity-related diseases. In Thai populations, Pongchaiyakul et al determined the optimal cutoff values of BMI for defining obesity in men and women.Citation18 However, the PBF cutoff points do not agree with those of BMI with respect to given sex-specific obesity cutoff points. For example, the optimum BMI obesity cutoff point for women (≥25.0 kg/m2) is actually lower than that for men (≥27.0 kg/m2), whereas the corresponding PBF cutoff point is higher for women (≥35%) than for men (≥25%). Therefore, BMI and PBF values are not directly comparable.
Obesity causes chronic inflammatory diseases and mainly contributes to the development of insulin resistance, several components of metabolic syndrome (MetS), and systematic low-grade inflammation. As mentioned, BMI and PBF results associated with obesity-related risk factors are controversial with respect to differing racial/ethnicity populations, and less is known about the performance of these obesity measures in Southeast Asian countries, most of which are classified as “developing countries”.Citation14,Citation19 Therefore, the aim of this study was to compare the performance of BMI and PBF in identifying major risk factors and new emerging risk factors for cardiovascular disease (CVD) in an adult Thai population. We also conducted the study to test whether associations between the measures and cardiometabolic risk factors have a sex-specific inclination. Information obtained in this study could be applied across Southeast Asian populations with similar ethnic and cultural subgroups, degrees of urbanization, and social and economic determinants of health and nutrition statuses.
Materials and methods
Study participants
This cross-sectional study enrolled a total of 234 outpatients who were aged at least 20 years and were receiving wellness check-ups in the general clinic at Ramathibodi Hospital, a hospital associated with the Faculty of Medicine of Mahidol University in Bangkok, Thailand. Patient exclusion criteria included a prior history of CVD or taking lipid-lowering drugs, or having had cancer, end-stage chronic kidney disease, or another serious medical condition. Data were obtained using a questionnaire and physical examination. All participants provided written informed consent, and the study protocol was reviewed and approved by the Committee on Human Rights Related to Research Involving Human Subjects, Faculty of Medicine, Ramathibodi Hospital, Mahidol University (MURA2017/348). All methods were carried out in accordance with the Declaration of Helsinki.
Body composition analysis was conducted using a multifrequency bioelectrical impedance analyzer (Biospace™ InBody 720 body composition analyzer; GE Healthcare, Chicago, IL, USA). Criteria for defining obesity in the adult Thai population were a BMI level of ≥25.0 kg/m2 for women and ≥27.0 kg/m2 for men, and a PBF level of ≥35% for women and ≥25% for men.Citation18 Participants with BMI measurements below or above mentioned cutoff points were defined as being of a normal weight or overweight, respectively. Participants with PBF measurements below or above mentioned cutoff points were defined as lean or fat, respectively. MetS was defined using National Cholesterol Education Program-Third Adult Treatment Panel (NCEP ATP III) criteria modified for Asian populations.Citation20
Biochemical measurements
Blood samples were collected during a fasting state. All samples were analyzed for total cholesterol, triglycerides, low density lipoprotein-cholesterol (LDL-C), high density lipoprotein-cholesterol (HDL-C), glucose, apolipoprotein (apo) A-I (apoA-I), apoB, lipoprotein subclass, high-sensitive C-reactive protein (hsCRP), insulin, adiponectin, leptin, 25-hydroxyvitamin D, and hemoglobin A1c (HbA1c). Lipid profiles and glucose were measured using enzymatic methods (Siemens Medical Solution Diagnostics, Tarrytown, NY, USA). ApoA-I, apoB, and hsCRP were measured using a Siemens BN ProSpec, and adiponectin and leptin levels were quantified using the ELISA system (Mediagnost Gesellschaft für Forschung und Herstel-lung von Diagnostika GmbH, Kusterdigen, Germany). HbA1c was determined using the Cobas Integra immunoturbidimetric method (Roche Diagnostics Ltd., Rotkreuz, Switzerland), and insulin and 25-hydroxyvitamin D levels were determined using the Immulite H2975 (Siemens Medical Solution Diagnostics) and LIAISON® Analyzer (DiaSorin, Stillwater, MN, USA), respectively. Insulin resistance was estimated using the Homeostasis Model Assessment of Insulin Resistance (HOMA-IR), the index for which was calculated according to the following formula: HOMA-IR = fasting insulin (μIU/mL) × fasting glucose (mmol/L)/22.5.
Lipoprotein subclass was analyzed using polyacrylamide tube gel electrophoresis (Lipoprint™; Quantimetrix, Redondo Beach, CA, USA), which electrophoretically separates plasma lipoproteins into the following bands: very low density (VLDL); intermediate low density (IDL): midband-C (MIDC), midband-B (MIDB) and midband-A (MIDA); large-buoyant LDL (LDL1 and LDL2); small-dense LDL (LDL3–LDL7); and HDL. Relative areas for each lipoprotein band were determined by densitometry and multiplied by total cholesterol concentration to yield the amount of cholesterol for each band. Mean LDL particle sizes were computed. The atherogenic lipoprotein pattern was defined by a small-dense LDL of >0.16 mmol/L or a mean LDL particle size of <26.5 nm.
Statistical analyses
Data are expressed as mean values (standard error of mean), and categorical variables are presented as numbers and percentages. Data were compared using the χ2 test, Student’s t-test, Mann–Whitney U test, or ANOVA, as appropriate. The correlation between BMI and PBF was analyzed using Pearson’s correlation test. All participants were stratified into four groups based on BMI and PBF cutoff points: normal weight and lean (Group A), BMI <25.0 kg/m2 for women and <27.0 kg/m2 for men, and PBF <35% for women and <25% for men; overweight and lean (Group B), BMI ≥25.0 kg/m2 for women and ≥27.0 kg/m2 for men, and PBF <35% for women and <25% for men; normal weight and fat (Group C), BMI <25.0 kg/m2 for women and <27.0 kg/m2 for men, and PBF ≥35% for women and ≥25% for men; and overweight and fat (Group D), BMI ≥25.0 kg/m2 for women and ≥27.0 kg/m2 for men, and PBF ≥35% for women and ≥25% for men. To conduct a risk analysis among patient groups, the odds ratios (ORs) and 95% confidence intervals (CIs) of cardiometabolic risk factors (classified as dichotomous variables) in Groups B, C, and D were compared with those in Group A (used as a reference) and analyzed using the multinomial logistic regression model adjusted for sex, age group (divided into four groups: <40, 40–<50, 50–<60, ≥60 years), and smoking status. A backward, stepwise multivariable logistic regression model adjusted for age, height, and smoking status was used to determine the association of each cardiometabolic risk (set as a dependent variable) with BMI and PBF (set as independent variables). Sex stratification was used in the analysis. Outcomes were considered statistically significant when P-values were <0.05, and all analyses were performed using SPSS version 18 (SPSS Inc., Chicago, IL, USA).
Results
Characteristics and biomarkers of study population
presents a summary of the demographic characteristics and biochemical test results for all participants (76 men and 158 women) who had a mean age of 51.8 years (min–max: 21–79 years) and were classified as obese or nonobese using BMI or PBF cutoff points. More participants exceeded the PBF cutoff for fat (40.6%) than for BMI-based overweight (27.8%). Participants classified as either overweight or fat had a significantly higher body fat mass, waist–hip fat ratio, and visceral fat area than those classified as normal weight or lean. A wide range of PBF (7.3%–50.7%) was observed among normal-weight participants. Similarly, a wide range of BMI (16.9–29.5 kg/m2) was observed among lean participants. The results obtained for metabolic biomarkers were similar for the normal-weight and overweight groups and the lean and fat groups, with the exception of LDL1 and apoB, which showed significant differences between the lean and fat groups. The following were noted in participants who were considered overweight or fat compared with the normal-weight or lean group: higher levels of glucose homeostasis markers (insulin, HOMA-IR, fasting glucose, and HbA1c), triglycerides, VLDL, small-dense LDL, apoB, leptin, and hsCRP, but lower levels of HDL-C, ApoA-I, and adiponectin concentrations and mean LDL particle sizes. However, the results revealed no significant differences in mean concentrations of total cholesterol, LDL-C, IDL-C (MIDC to MIDA), non-HDL-C, and 25-hydroxyvitamin D between the normal-weight and overweight or lean and fat groups.
Table 1 Characteristics of participants defined as nonobese and obese using obesity measures
Correlation between BMI and PBF
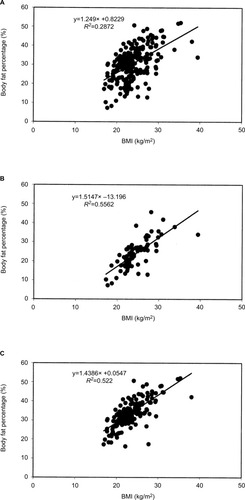
The correlation between BMI and PBF for all participants is shown in . Linear regression statistics revealed a moderate relationship between BMI (x) and PBF (y): y = 1.25× + 0.82, R 2 = 0.287. A superior relationship was found with respect to sex stratification, where linear regression statistics were y = 1.51× − 13.20, R 2 = 0.556 for men () and y = 1.44× + 0.05, R 2 = 0.522 for women ().
Figure 1 Correlation plots of body mass index (BMI) versus percentage of body fat (PBF) in (A) all participants; (B) men; and (C) women.
Characteristics and biomarkers of groups based on different obesity measures
Participants were categorized into four groups based on whether they exceeded BMI or PBF cutoff points. The proportions of men did not differ among all groups (). Of participants classified as normal weight, 25% had higher than cutoff values for PBF, whereas 9% of those classified as lean had a BMI that was higher than the cutoff value. For body composition, significant differences were observed between parameter values for all four groups, particularly with respect to the waist-to-hip fat ratios and visceral fat areas, which were clearly elevated in the participants with normal weight and fat and overweight and fat. A marked difference was found between the groups with respect to risk for individual components of MetS. Abdominal obesity, hypertension, hypertriglyceridemia, and hyperglycemia were more highly prevalent in the subjects with overweight and fat, but those with overweight and lean had the highest prevalence of low HDL-C. The results indicated a marked increase in the prevalence of MetS (more than 50%) in the groups of overweight and/or fat compared with normal weight and lean group.
Table 2 Characteristics of participants by group, as classified by BMI and PBF
Statistically significant differences were observed among the groups for most of the monitored variables, including glucose homeostatic biomarkers (insulin, HOMA-IR, glucose, and HbA1c), lipid biomarkers (VLDL, small-dense LDL, LDL particle size, triglycerides, HDL-C, and apoA-I), hsCRP, leptin, and adiponectin, as shown in . However, no significant differences in the levels of apoB and 25-hydroxyvitamin D were observed between the groups.
Table 3 Comparison of metabolic biomarkers between groups defined using different obesity measures
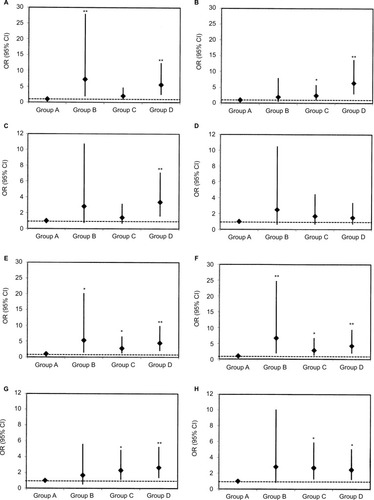
To compare the risk of cardiometabolic risk factors in the groups of overweight and/or fat with that of normal weight and lean, a multinomial logistic regression model was applied (). The ORs (95% CIs) for hypertension () were significant in Group B, overweight and lean (7.28 [1.86–28.56]), and Group D, overweight and fat, (5.61 [2.51–12.54]) but they were not significant in Group C, normal weight and fat (2.05 [0.88–4.80]). Insulin resistance () was statistically significant in normal weight and fat and overweight and fat groups: ORs (95% CIs) were 2.43 (1.01–5.84) and 6.39 (2.97–13.77), respectively. However, impaired fasting glucose was only statistically significant in overweight and fat group (3.36 [1.59–7.11]) (). By contrast, there were no significant differences in the increased risk of HbA1c () between all groups. For the lipid metabolic profile, the participants with overweight and/or fat showed a significantly high risk of hypertriglyceridemia (), with the corresponding ORs (95% CI) being 5.33 (1.40–20.29), 2.80 (1.19–6.60), and 4.49 (2.03–9.92), respectively. Similarly, these participants showed a significant risk of low HDL-C (); however, large ORs were observed in overweight and lean group (6.71 [1.81–24.86]) and overweight and fat group (4.23 [1.90–9.44]). For the atherogenic lipoprotein pattern, the participants with overweight showed statistically significant ORs for increasing small-dense LDL () and decreasing mean LDL particle size ().
Figure 2 Multinomial logistic regression analysis for (A) hypertension, (B) insulin resistance, (C) impaired fasting glucose, (D) increased HbA1c, (E) hypertriglyceridemia, (F) hypo HDL cholesterolemia, (G) atherogenic lipoproteins, and (H) atherogenic lipoprotein pattern for the following groups compared with the reference normal-weight and lean group (Group A): overweight and lean (Group B), BMI ≥25.0 kg/m2 for women and ≥27.0 kg/m2 for men, and PBF <35% for women and <25% for men; normal weight and fat (Group C), body mass index (BMI) <25.0 kg/m2 for women and <27.0 kg/m2 for men, and percentage of body fat (PBF) ≥35% for women and ≥25% for men; and overweight and fat (Group D), BMI ≥25.0 kg/m2 for women and ≥27.0 kg/m2 for men, and PBF ≥35% for women and ≥25% for men.
Association between BMI and PBF and cardiometabolic risk factors stratified by sex
A backward, stepwise removal process was applied to remove cardiometabolic risk factors exhibiting no significant (P > 0.05) association with BMI or PBF, and the remaining variables adjusted for age, height, and smoking status for analysis are shown in . BMI was associated with hypertension for both sexes. HOMA-IR and fasting glucose were associated with PBF for men, but were associated with BMI for women. HbA1c, hsCRP, and 25-hydroxyvitamin D were not associated with any measure for either sex. Differences were observed with respect to an association between the measures and lipid metabolic biomarkers. Similar to fasting glucose and HOMA-IR, triglycerides were associated with PBF for men but with BMI for women. HDL-C was related to BMI for both sexes, but atherogenic lipoprotein patterns (including small-dense LDL and mean LDL particle size) were related to PBF for both sexes. For adipokines, leptin was associated with PBF for men and BMI for women, whereas adiponectin had no association in any way for men, but agreed with BMI for women.
Table 4 Logistic regression analysis of obesity measures associated with CVD risk factors
Discussion
BMI and PBF are two different clinical measures of obesity. However, whether the two measures are equally applicable in certain populations is unclear. For example, Asian populations tend to have a higher PBF and related complications compared with other ethnic populations with the same BMI.Citation16 Moreover, many results have indicated sex-related differences in regulation of adipose tissue; women have a greater amount of PBF than men with an equivalent BMI.Citation17,Citation21 The question is whether the use of only one measure or the other is sufficient. Our results reveal that neither measure used alone is sufficient.
For the Thai population, our results show a good relationship between BMI and PBF when sex stratification was accounted for. According to our data, the proportions of men were similar in all groups when using either BMI or PBF for classification (). This implies that sex-specific cutoff points regarding BMI and PBF are appropriate for defining excess body weight and body fat for the adult Thai population. According to such criteria, 27.8% of the participants were identified to be obese using the sex-specific BMI cutoff, but 40.6% were determined to be fat using the PBF cutoff. Our results are similar to those of the recently published study of Gába and Přidalová, who demonstrated that although 21% of Caucasian women studied had a BMI of ≥30 kg/m2, 40% had a high excess fat mass.Citation22 Notably, among our normal-weight participants, 25% were found to have PBF that was higher than the cutoff value. Indeed, in Group C and D, there was a marked increase in the waist-to-hip fat ratio and the visceral fat area compared with Group A and B. Such results indicate the poor diagnostic performance of BMI in measuring increased body fat (adiposity) in this population.
In the present study, we observed that BMI and PBF differed considerably in their predictive abilities for numerous cardiometabolic risk markers (). Furthermore, we observed large differences in the abilities of the BMI and PBF measures to identify specific risk factors, as shown by the ORs (). A good discriminator for individual participants being at risk of hypertension was being overweight (with or without fat). Moreover, BMI, and not PBF, was strongly associated with hypertension, independent of age, height, or sex. A study of Chinese adults by Hou et al found that BMI adequately reflected body volume and mass, and this was associated with blood viscosity and blood volume and was closely related to blood pressure.Citation23 However, in our Thai population, the magnitude of the association between BMI and hypertension was much higher in men (an OR that was twice as large in men than in women).
According to results of glucose and lipid metabolic profiles, individual participants who were overweight and fat clearly demonstrated a high risk of all metabolic regulations, except for increased HbA1c. Additionally, our data indicate that participants with a contradictory BMI and PBF (normal weight and fat or overweight and lean) may be misidentified as being at risk of glucose and lipid metabolic dysregulations. Furthermore, participants identified as being of a normal weight but fat also demonstrated a risk of insulin resistance. This result supports the report by Romero-Corral et al that individuals with a high body fat content but a normal weight were more predisposed to type II diabetes mellitus than those who were overweight but had a normal fat mass.Citation24 Notably, however, our results indicate that participants who were either normal weight and fat or overweight and/or fat did not appear to be at risk of increasing levels of HbA1c. This finding is in agreement with that of Mainous et al, who reported that BMI and waist circumference showed no association with HbA1c.Citation25 HbA1c reflects an increase in average glucose levels. However, participants in Group D were overweight and fat (), but they showed no marked glucose increase compared with Group A (107.1 vs 94.5 mg/dL, only a 14% increase), which may not be sufficient to significantly increase hemoglobin glycosylation. Insulin resistance differed between the participants with overweight and fat and normal weight and lean (2.087 vs 0.850, a 145% increase). An increase in insulin secretion (7.37 vs 3.52 μIU/mL, a 108% increase) may have restrained the glucose concentration. Another population-based study showed that the agreement between HbA1c and oral glucose tolerance test criteria in classifying participants’ glycemia decreased with an increase in the participants’ BMI, particularly when screening for prediabetes (HbA1c ranged from 5.7% to 6.4%).Citation26
We noted a large sex-specific variation between BMI and PBF with respect to their association with the serum metabolite profile. Multiple studies have shown that individuals with a large body fat content are predisposed not only to type II diabetes mellitus but also to CVD.Citation4–Citation7 We observed that HOMA-IR, fasting glucose, and triglycerides were similarly associated with PBF in men but not in women. By contrast, BMI was shown to be a good predictor of these risk factors in women. Women tend to have more body fat than men. Furthermore, because of distinct differences in fatty acid mobilization and oxidation and storage, women tend to store more fat in the gluteal–femoral region, whereas men store more fat in the visceral depot.Citation27 Therefore, the use of BMI as an indicator of CVD and type II diabetes mellitus for women is preferable over the use of PBF in evaluating changes in body adiposity over time, because changes in body weight are more likely to represent an increase in the volume of adipose tissue.
The lipid metabolic profiles showed differences between BMI and PBF in their ability to predict each of the lipid risk factors. Although numerous studies have reported a direct correlation between increasing adiposity and dyslipidemia, our results reveal no significant differences in total cholesterol, LDL-C, IDL-C, or non-HDL-C between the normal-weight and overweight or lean and fat groups.Citation28,Citation29 However, notably, PBF in both sexes was a predictor for only increased small-dense LDL particle size and decreased LDL particle size, which play an important role in the development of atherosclerosis. These data are consistent with the data of Rainwater et al, who showed that changes in metabolic conditions (such as obesity) predominantly affect LDL particle size more than LDL absolute levels.Citation30 Notably, many studies have demonstrated that small-dense LDL particles were strongly associated with raised triglycerides and decreased HDL-C concentrations, whereas we found differences between the obesity measures in their ability to predict these lipids abnormalities.Citation31,Citation32 BMI was strongly associated with low HDL-C in both sexes, whereas PBF was strongly associated with small-dense LDL particles. In addition, we observed a trend where participants who were overweight exhibited a greater probability of having low HDL-C compared with those who were considered fat (). According to Pietrobelli et al, the composition of HDL may be altered through muscle lipoprotein lipase-mediated transfer of cholesterol esters from HDL to triglycerides-rich lipoprotein remnants, which leads to increased HDL catabolism.Citation33 Furthermore, a recent cohort study in women with a high prevalence of MetS showed that trunk fat-free soft tissue mass may have detrimental effects on HDL levels.Citation34 Data from the current study also demonstrate that participants classified as being obese according to BMI but having normal fat mass according to PBF tended to have a high muscle mass, and they showed the lowest HDL-C and apoA-I levels (). Therefore, not only adipose tissue but also nonadipose components, particularly muscle mass, may play an important role in HDL metabolism.
Notably, the predictive abilities of both BMI and PBF were quite similar with respect to HOMA-IR and to glucose and triglyceride concentrations; BMI was a better predictor for women and PBF for men. Remarkably, these patterns were also observed for leptin levels. This indicates that muscle and adipose tissues influence the regulation of several important physiological functions and that there is a close link between adipokine and glucose and lipid metabolisms.
Hypertension, insulin resistance, hyperglycemia, dyslipidemia, increase inflammatory markers, and 25-hydroxyvitamin D deficiency have been studied with respect to an associated CVD risk.Citation35,Citation36 However, our results reveal no association between BMI or PBF and hsCRP or 25-hydroxyvitamin D. Although low 25-hydroxyvitamin D levels have been extensively reported in obesity, we notably found that 25-hydroxyvitamin D levels were similar between normal and obese participants, independent of the obesity measure used.Citation37 Inconsistencies in the reporting of associations between serum 25-hydroxyvitamin D and obesity may be due to the high levels of vitamin D inadequacy in the Thai population, which were up to 44.3% and 91.9%, as defined by 25-hydroxyvitamin D levels less than 50 and 75 nmol/L, respectively.Citation38
Our study has some limitations. First, only a few participants were defined as having an excess BMI with a normal PBF, which may limit our conclusions. Therefore, further studies involving larger and different Southeast Asian populations are required to confirm the findings presented herein. Second, age, sex, height, and smoking status are known to be risk factors associated with developing CVD risk factors; although these factors were accounted for and adjusted in our analysis, other factors were not accounted for, despite being known to be risk factors in developing CVD (such as dietary intake, level of education, physical activity, and family history). Third, we measured PBF in this study by using bio-electrical impedance analysis, which tends to underestimate body fat in subjects.Citation39 However, this method of analysis is used in large-scale epidemiological investigations because it is least expensive and is the most simple and reproducible method used to conduct PBF evaluations and other body composition assessments.Citation40
Conclusion
This study was conducted on a Thai population, and the results reveal that Thai women have a higher PBF than men. In particular, the two measures of obesity (BMI and PBF) exhibited considerable sex-specific variations in terms of their associations with cardiometabolic risk profiles. With respect to glucose homeostasis and to triglyceride and leptin concentrations, BMI was a better predictor for women and PBF for men. In addition, we clearly demonstrated that participants with a contradictory BMI and PBF could be misidentified as being at risk of glucose and lipid metabolic dysregulations. The differences between the two measures in terms of their prediction of cardiometabolic risk indicate that using exclusively one or the other measure provides an inferior risk prediction than using both measures, as shown herein with the Thai population. Therefore, because both BMI and PBF are easy and inexpensive to use, both should be applied in screening activities.
Availability of data and material
The datasets used and/or analyzed during the current study will not be shared. For access to this data, please contact Pornpen Srisawasdi, PhD, the supervisor of the study, at [email protected] or [email protected]
Author contributions
All the authors participated in the interpretation and the review of the manuscript. PS, SV, and MR designed the study. PS, SV, NK, and KK conducted the data retrieval and analyzed the data. PS, SV, and MHK wrote the manuscript. PS, SV, MR, and MHK gave constructive suggestions during the preparation of the manuscript. All the authors read and approved the final manuscript. All the authors also participated in revision of the manuscript.
Acknowledgments
The authors gratefully acknowledge all participants who contributed to this study. The authors would like to thank Boontarika Intachak, Jirapa Kerdmongkol and all staff in Division of Clinical Chemistry, Department of Pathology, Faculty of Medicine, Ramathibodi Hospital, Mahidol University, Thailand for data collection and management. This study was supported by a Research Grant from the Faculty of Medicine, Ramathibodi Hospital, Mahidol University, Thailand (grant number 56076).
Disclosure
The authors report no conflicts of interest in this work.
References
- World Health Organization Obesity and overweight. Fact sheet 311, Updated October 2017 Available from: http://www.who.int/mediacentre/factsheets/fs311/en Accessed May 10, 2018
- NCD Risk Factor Collaboration (NCD-RisC) Trends in adult body-mass index in 200 countries from 1975 to 2014: a pooled analysis of 1698 population-based measurement studies with 19·2 million participants Lancet 2016 387 10026 1377 1396 27115820
- Park HK Ahima RS Physiology of leptin: energy homeostasis, neuroendocrine function and metabolism Metabolism 2015 64 1 24 34 25199978
- Cornier MA Després JP Davis N American Heart Association Obesity Committee of the Council on Nutrition Physical Activity and Metabolism Council on Arteriosclerosis Thrombosis and Vascular Biology Council on Cardiovascular Disease in the Young Council on Cardiovascular Radiology and Intervention Council on Cardiovascular Nursing, Council on Epidemiology and Prevention Council on the Kidney in Cardiovascular Disease, and Stroke Council Assessing adiposity: a scientific statement from the American Heart Association Circulation 2011 124 18 1996 2019 21947291
- Stefan N Fritsche A Schick F Häring HU Phenotypes of prediabetes and stratification of cardiometabolic risk Lancet Diabetes Endocrinol 2016 4 9 789 798 27185609
- Flegal KM Kit BK Orpana H Graubard BI Association of all-cause mortality with overweight and obesity using standard body mass index categories: a systematic review and meta-analysis JAMA 2013 309 1 71 82 23280227
- Winter JE MacInnis RJ Wattanapenpaiboon N Nowson CA BMI and all-cause mortality in older adults: a meta-analysis Am J Clin Nutr 2014 99 4 875 890 24452240
- Jackson AS Stanforth PR Gagnon J The effect of sex, age and race on estimating percentage body fat from body mass index: the Heritage Family Study Int J Obes Relat Metab Disord 2002 26 6 789 796 12037649
- Lichtash CT Cui J Guo X Body adiposity index versus body mass index and other anthropometric traits as correlates of cardiometabolic risk factors PLoS One 2013 8 6 e65954 23776578
- Heo M Faith MS Pietrobelli A Heymsfield SB Percentage of body fat cutoffs by sex, age, and race-ethnicity in the US adult population from NHANES 1999–2004 Am J Clin Nutr 2012 95 3 594 602 22301924
- Wong WW Strizich G Heo M Relationship between body fat and BMI in a US hispanic population-based cohort study: results from HCHS/SOL Obesity (Silver Spring) 2016 24 7 1561 1571 27184359
- Deurenberg P Yap M van Staveren WA Body mass index and percent body fat: a meta analysis among different ethnic groups Int J Obes Relat Metab Disord 1998 22 12 1164 1171 9877251
- World Health Organization Physical status: the use and interpretation of anthropometry. Report of a WHO Expert Committee WHO Technical Report Series 854 Available from: http://apps.who.int/iris/bitstream/10665/37003/1/WHO_TRS_854.pdf Accessed May 10, 2018
- Okorodudu DO Jumean MF Montori VM Diagnostic performance of body mass index to identify obesity as defined by body adiposity: a systematic review and meta-analysis Int J Obes (Lond) 2010 34 5 791 799 20125098
- WHO Expert Consultation Appropriate body-mass index for Asian populations and its implications for policy and intervention strategies Lancet 2004 363 9403 157 163 14726171
- Wang J Thornton JC Russell M Burastero S Heymsfield S Pierson RNJr Asians have lower body mass index (BMI) but higher percent body fat than do whites: comparisons of anthropometric measurements Am J Clin Nutr 1994 60 1 23 28 8017333
- Carpenter CL Yan E Chen S Body fat and body-mass index among a multiethnic sample of college-age men and women J Obes 2013 2013 790654 23691288
- Pongchaiyakul C Nguyen TV Kosulwat V Defining obesity by body mass index in the Thai population: an epidemiologic study Asia Pac J Clin Nutr 2006 15 3 293 299 16837420
- Romero-Corral A Montori VM Somers VK Association of bodyweight with total mortality and with cardiovascular events in coronary artery disease: a systematic review of cohort studies Lancet 2006 368 9536 666 678 16920472
- Alberti KG Eckel RH Grundy SM International Diabetes Federation Task Force on Epidemiology and Prevention National Heart, Lung, and Blood Institute American Heart Association World Heart Federation International Atherosclerosis Society International Association for the Study of Obesity Harmonizing the metabolic syndrome: a joint interim statement of the International Diabetes Federation Task Force on Epidemiology and Prevention; National Heart, Lung, and Blood Institute; American Heart Association; World Heart Federation; International Atherosclerosis Society; and International Association for the Study of Obesity Circulation 2009 120 16 1640 1645 19805654
- Palmer BF Clegg DJ The sexual dimorphism of obesity Mol Cell Endocrinol 2015 402 113 119 25578600
- Gába A Přidalová M Diagnostic performance of body mass index to identify adiposity in women Eur J Clin Nutr 2016 70 8 898 903 26669574
- Hou X Lu J Weng J China National Diabetes and Metabolic Disorders Study Group Impact of waist circumference and body mass index on risk of cardiometabolic disorder and cardiovascular disease in Chinese adults: a national diabetes and metabolic disorders survey PLoS One 2013 8 3 e57319 23520466
- Romero-Corral A Somers VK Sierra-Johnson J Normal weight obesity: a risk factor for cardiometabolic dysregulation and cardiovascular mortality Eur Heart J 2010 31 6 737 746 19933515
- Mainous AG3rd Tanner RJ Coates TD Baker R Prediabetes, elevated iron and all-cause mortality: a cohort study BMJ Open 2014 4 12 e006491
- Li J Ma H Na L Increased hemoglobin A1c threshold for pre-diabetes remarkably improving the agreement between A1c and oral glucose tolerance test criteria in obese population J Clin Endocrinol Metab 2015 100 5 1997 2005 25751104
- Blaak E Gender differences in fat metabolism Curr Opin Clin Nutr Metab Care 2001 4 6 499 502 11706283
- Shamai L Lurix E Shen M Association of body mass index and lipid profiles: evaluation of a broad spectrum of body mass index patients including the morbidly obese Obes Surg 2011 21 1 42 47 20563664
- Klop B Elte JW Cabezas MC Dyslipidemia in obesity: mechanisms and potential targets Nutrients 2013 5 4 1218 1240 23584084
- Rainwater DL Mitchell BD Comuzzie AG Haffner SM Relationship of low-density lipoprotein particle size and measures of adiposity Int J Obes Relat Metab Disord 1999 23 2 180 189 10078854
- Tsimihodimos V Gazi I Kostara C Tselepis AD Elisaf M Plasma lipoproteins and triacylglycerol are predictors of small, dense LDL particles Lipids 2007 42 5 403 409 17426995
- Kathiresan S Otvos JD Sullivan LM Increased small low-density lipoprotein particle number: a prominent feature of the metabolic syndrome in the Framingham Heart Study Circulation 2006 113 1 20 29 16380547
- Pietrobelli A Lee RC Capristo E Deckelbaum RJ Heymsfield SB An independent, inverse association of high-density-lipoprotein-cholesterol concentration with nonadipose body mass Am J Clin Nutr 1999 69 4 614 620 10197562
- Jean-Luc Gradidge P Norris SA Jaff NG Crowther NJ Metabolic and body composition risk factors associated with metabolic syndrome in a cohort of women with a high prevalence of cardiometabolic disease PLoS One 2016 11 9 e0162247 27589387
- Ridker PM Clinical application of C-reactive protein for cardiovascular disease detection and prevention Circulation 2003 107 3 363 369 12551853
- Judd S Tangpricha V Vitamin D Deficiency and Risk for Cardiovascular Disease Circulation 2008 117 4 503 511 18180395
- Pereira-Santos M Costa PR Assis AM Santos CA Santos DB Obesity and vitamin D deficiency: a systematic review and meta-analysis Obes Rev 2015 16 4 341 349 25688659
- Nimitphong H Chanprasertyothin S Jongjaroenprasert W Ongphiphadhanakul B The association between vitamin D status and circulating adiponectin independent of adiposity in subjects with abnormal glucose tolerance Endocrine 2009 36 2 205 210 19597711
- Sun G French CR Martin GR Comparison of multifrequency bioelectrical impedance analysis with dual-energy X-ray absorptiometry for assessment of percentage body fat in a large, healthy population Am J Clin Nutr 2005 81 1 74 78 15640463
- Ling CH de Craen AJ Slagboom PE Accuracy of direct segmental multi-frequency bioimpedance analysis in the assessment of total body and segmental body composition in middle-aged adult population Clin Nutr 2011 30 5 610 615 21555168