Abstract
Background
Adipose tissue functions as an endocrine organ by releasing adipokines which have important roles in the regulation of inflammation and insulin sensitivity. Although there is evidence of improvement in circulating levels of adipokines with weight loss, few studies relate such changes to specific diets. We investigated the effects of weight loss achieved by two different diets on circulating adipokine levels in obese individuals.
Methods
A total of 120 obese patients (body mass index ≥ 35 kg/m2) underwent a three-month screening period on a low-fat, reduced-calorie diet. Patients failing to achieve a 5% weight loss using this approach were randomly allocated to either a low carbohydrate/high protein diet (n = 17) or to a commercial very low calorie diet (LighterLife®, n = 14) for a period of nine months.
Results
At nine months, a significant weight loss was only maintained for Lighter-Life® (−32.3 ± 22.7 kg, P < 0.0001) but not on the low carbohydrate/high protein diet. Changes in adiponectin (15.8 ± 17.1 ng/mL versus −0.8 ± 6.2 ng/mL, P = 0.003) and leptin (−17.6 ± 24.3 ng/mL versus −3.0 ± 9.2 ng/mL, P = 0.049) at nine months were significantly greater for LighterLife® than for the low carbohydrate/high protein diet, which may reflect greater weight loss and decrease in fat mass. Changes in tumor necrosis factor-alpha, interleukin-6, and plasminogen activator inhibitor type 1 did not differ significantly between the dietary interventions at nine months.
Conclusion
A significant weight loss of 23.8% from baseline weight was observed using a very low calorie diet and resulted in significant improvements in circulating levels of leptin, plasminogen activator inhibitor type 1, and adiponectin, which are likely to be due to weight loss and not macronutrient intake.
Keywords:
Introduction
It is now evident that adipose tissue not only stores excess triacylglycerols, but functions as an endocrine organ by releasing adipokines, which have important roles in the regulation of appetite, glucose and lipid metabolism, inflammation, and insulin resistance.Citation1,Citation2 Such adipokines include adiponectin, leptin, resistin, tumor necrosis factor (TNF)-α, plasminogen activator inhibitor-1 (PAI-1), and interleukin (IL)-6. TNF-α, PAI-1, and IL-6 are all proinflammatory cytokines, although IL-6 can further exert an anti-inflammatory action.Citation1 It has also been observed that leptin, resistin, and TNF-α impair insulin sensitivity and trigger atherogenesis.Citation1 These adipokines usually increase with adiposity and can have a detrimental role on an individual’s health. However, adiponectin, unlike other adipokines produced by adipose tissue, possesses antiatherogenic properties and is found to decrease with increased adiposity.Citation1,Citation2
Several studies provide evidence of improvement in adipokine profiles with weight loss.Citation3–Citation6 However, it remains unclear as to whether changes in the circulating adipokines investigated to date contribute significantly to the beneficial effects on health associated with weight loss.Citation7 The extent of weight loss required to elicit such changes in adipokine levels remains unclear. In addition, the method by which the weight loss is achieved may also influence the adipokine response. Varady et alCitation8 suggest that a minimum weight loss of 5% is required to have an effect on levels of key adipokines (adiponectin, leptin, and resistin), but this differs from other studies which report the need for a 10% weight loss for modification in levels of some adipokines (eg, adiponectin) and that this varies with the degree of obesity.Citation9
Further studies are needed to clarify the relationship between changes in adipokine levels and the health benefits of weight loss, and whether specific dietary manipulations have differential effects on such changes. We hypothesized that the extent of weight loss rather than the macronutrient intake will determine the degree of change in adipokine levels.
We aimed to investigate the effect of weight loss on adipokine levels in individuals receiving a low carbohydrate/high protein (LCHP) diet compared with a very low calorie diet (LighterLife® [LL]) diet.
Methods
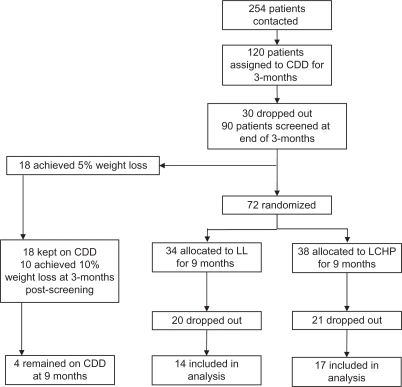
The present analysis is an ancillary study to that previously presented by Rolland et alCitation10 where the methods were described. Dropouts were not included in this analysis because the goal was to evaluate the effect of diet on adipokine levels and not an intention-to-treat clinical trial. In brief, patients referred to a specialist obesity clinic were entered into a randomized controlled clinical trial of differing dietary interventions in the management of obesity. Men and women older than 18 years of age and a body mass index (BMI) ≥ 35 kg/m2 were included. Patients with a history of hepatic or renal disease, cancer, current pregnancy/lactation, on antidepressant or antiobesity medication, or eating disorders were excluded. All patients who fulfilled these criteria were invited to take part in this research. The study included a three-month screening period where patients were assigned to a 600 calorie-deficient diet (CDD) aiming to achieve a 5% weight loss. This was done to select patients who would not respond to a low-fat, reduced-energy approach and randomly assign them to a LCHP or a LL diet in the form of a continuous method approach. Those who lost >5% of their body weight were maintained on this approach for an additional three months. If weight loss was >10% at this time, the CDD was continued for an additional six months. Completer data for this group were limited (n = 4) and therefore were not included in this paper.
Those patients who failed to achieve the weight loss targets were randomly allocated to either a LCHP or LL diet, and continued on the assigned diet for an additional nine months (). Patients on CDD who achieved a 5% weight loss at screening but did not achieve the 10% weight loss three months following screening were randomized to the LL or the LCHP diet but their data were omitted from this analysis. All patients provided written informed consent. The study was approved by the North of Scotland Research Ethics Service.
Figure 1 Flow chart for patient recruitment and attrition rate.
Dietary intervention
Using the Schofield and the Harris Benedict equations, 600 kcal were removed from the patients’ estimated daily energy intake. The amount of energy allowed was broken down into portions from the different food groups.Citation10 Portion sizes were explained to the patients and written information was also provided. Patients were reviewed at weeks 2, 4, 8, and 12 when they were weighed, their weight loss progress was discussed, and they were provided with dietary advice.
Randomization and diet allocation
Patients randomized to the low LCHP diet were restricted to ≤40 g of carbohydrate per day. The energy intake was 800–1500 kcal where an 800 kcal diet was composed of 20% carbohydrate, 40% protein, and 40% fat. Patients were given a booklet with information about which foods to eat and which to avoid. Examples of recipes were also provided. The diet was supplemented with multivitamins and minerals (Forceval®, Alliance Pharmaceuticals, Chippenham, UK).
The LL diet used in this study is administered in the form of soups, shakes, and bars to replace conventional food and provides a daily average of 550 kcal (36% carbohydrate, 36% protein, 28% fat, and at least 100% of the recommended daily allowance for all micronutrients). Patients on LL were advised to remain adequately hydrated while on the diet. LL has two distinctive stages, ie, weight loss and food reintroduction. During each stage, patients attend weekly single-sex group meetings of 7–12 people for behavior change therapy based on cognitive behavior therapy and transactional analysis methodology delivered by a trained LL advisor. Patients were required to remain on the weight loss phase for a minimum of three months, after which they were given a choice to continue for up to another six months or were assigned to the food reintroduction phase. On average, patients who completed the study remained on the diet for 6.9 (range 4–9) months. For the food reintroduction phase, solid foods were reintroduced over a 12-week period where patients were slowly weaned off food packs while still receiving advice and support. All patients came monthly to the trial center to be weighed for the first three months and then every alternate month after screening, resulting in six visits in nine months. Additional support was provided via telephone and email.
Data collection
Fat mass and fat free mass was estimated using bioelectrical impedance (Tanita BC-418 MA, [Tanita Corporation, Arlington Heights, IL]). Body composition and waist circumference were measured prescreening, at screening, and at months 3 and 9 after screening. Blood samples were obtained after an overnight fast prescreening, at screening, and at months 3 and 9 after screening to measure fasting plasma glucose, insulin, and adipokines, including leptin, resistin, adiponectin, PAI-1 (active), IL-6, and TNF-α. Serum samples for adipokines and insulin were measured in duplicate with commercially available immunoassay kits from Millipore using the Lincoplex system (St Charles, MO). The protocol for measurement of insulin and all the adipokines was carried out as described by the manufacturer. The sensitivities are described in . Intra-assay variations were 1.4%–7.9% of the coefficient of variation. High-density lipoprotein cholesterol (HDL), triacylglycerol, and fasting glucose were analyzed in the Department of Clinical Biochemistry at NHS Grampian. Insulin resistance using fasting glucose and insulin values was calculated using the homeostasis model of assessment of insulin resistance (HOMA-IR) where HOMA-IR = [insulin] [glucose]/22.5.
Table 1 Assay sensitivities for the measured adipokines
Statistical analysis
All variables were assessed for normality using the Kolmogorov-Smirnov test. Any skewed data were log-transformed and subsequently assessed using parametric tests. For within group analysis, a paired t-test was used. For between-group analysis of changes, independent t-tests were used. The Pearson correlation was used to assess the relationship between changes in adipokines and changes in other continuous measurements. A Chi-squared test was used to assess differences for dichotomous variables. Statistical tests were carried out using the SPSS 15.0 for Windows software program (SPSS Inc, Chicago, IL). Because this is an ancillary analysis following on from a previously published study,Citation10 the power for this analysis was carried out based on weight loss. A P value of <0.05 (two-tailed) was considered statistically significant. Based on the mean change (31.0 kg) and standard deviation (16.4 kg) for weight loss observed at nine months,Citation10 14 patients in each group resulted in a >99% power for weight change.
Results
Data are presented as means ± standard deviation, and changes are expressed as the mean difference changes from baseline ± standard deviation. Baseline characteristics are listed in . A total of 31 (14 in LL, 17 in LCHP) patients completed the study. There were significantly more men in the LL than the LCHP group (n = 5 and n = 1, respectively).
Table 2 Baseline characteristics of the two dietary interventions
Weight, BMI, and fat free mass were significantly greater in the LL group than in the LCHP group (). When investigating the whole group, significant associations were observed between adiponectin, HDL, and PAI-1. PAI-1 also had significant associations with insulin and HOMA-IR. Leptin was significantly associated with percentage body fat and TNF-α, while IL-6 was inversely associated with HDL (). There were no significant gender differences for the adipokines with the exception of leptin, for which the levels were significantly greater in women than in men (46.7 ± 15.5 ng/mL versus 28.2 ± 14.6 ng/mL, P = 0.014). However, this was no longer significant after adjusting for percentage body fat (P = 0.089).
Table 3 Baseline correlations for all study participants
Three-month data
At three months, percentage weight loss for the LCHP group was −2.9% ± 4.2% and for LL was −18.4% ± 5.4% (P < 0.0001). Weight, waist circumference, percentage body fat, fat mass, leptin, PAI-1, fasting glucose, HOMA-IR, and triacylglycerols had improved significantly in the LL group (). However, HDL and fat free mass decreased significantly from baseline in the LL group (). A significant improvement from baseline to three months was observed for weight, percentage body fat, fat mass, insulin, and HOMA-IR in the LCHP group ().
Table 4 Changes in variables between baseline and three and nine months (completers only)
Nine-month data
At nine months, the percentage weight change for the LCHP group was −1.4% ± 1.0% and for LL was −23.8% ± 4.0% (P < 0.0001). In the LL group, weight loss, waist circumference, percentage body fat, fat mass, fat free mass, leptin, PAI-1, fasting glucose, and triacylglycerols were still significantly improved compared with baseline (). In addition, significant improvements in circulating levels of adiponectin and HDL were observed, but HOMA-IR was no longer significant (). Changes in adiponectin were inversely associated with changes in weight, BMI, fat mass, percentage body fat, waist circumference, IL-6, and TNF-α. Changes in leptin were associated with changes in weight, BMI, fat mass, waist circumference, fat free mass, and percentage body fat. Changes in leptin were inversely associated with HDL. Changes in TNF-α were associated with changes in IL-6, and inversely associated with changes in adiponectin. Changes in PAI-1 were associated with changes in fat mass (). There were no significant changes from baseline at nine months for the LCHP group (). However, changes in leptin were inversely associated with changes in HDL (r = – 0.573, P = 0.032). Overall, changes at nine months for weight, waist circumference, fat mass, adiponectin, leptin, fasting glucose, and HDL were significantly greater for the LL group than for the LCHP group ().
Table 5 Correlations for changes from baseline to nine months for the LighterLife® group
Discussion
In the present study, there was a significant weight loss at three months for patients on both LL and LCHP. However, significant weight loss at nine months was only maintained in the LL group. Changes in adiponectin and leptin were significantly greater in the LL group than in the LCHP group which may be due to greater weight loss and decrease in fat mass. However, changes in TNF-α, IL-6, PAI-1, and resistin did not differ significantly between the dietary groups at nine months.
At baseline, we observed a trend for adiponectin to be inversely correlated with weight and BMI, but this did not reach statistical significance, possibly due to the small sample size. Surprisingly, there was no significant inverse correlation between adiponectin and waist circumference, which was unexpected because other studies have demonstrated that waist circumference is a good correlate for adiponectemia.Citation12,Citation13 Although the sample size was small, this may not be the reason for the lack of correlation between adiponectin, BMI, and waist circumference. Mean BMI for the participants in the study was greater than 40 kg/m2. There is evidence to suggest that the incidence of metabolic syndrome decreases beyond a BMI of 37.5 kg/m2.Citation14
Interestingly, our findings support the evidence presented by Plaisance et al,Citation15 who reported that baseline adiponectin levels were strongly correlated with mean HDL cholesterol. Association of moderately decreased risk of CVD with increased adiponectin is thought to be mediated in part by the effects of adiponectin on HDL, through parallel increases in both. However, how adiponectin affects HDL remains unknown.Citation16 In the LL group, changes in adiponectin were significant at nine months but not at three months. Weight loss increased significantly from three to nine months in this group, which would suggest that a weight loss greater than 18.4% is required for statistically significant improvements in circulating adiponectin levels. Changes in adiponectin were inversely associated with fat mass, waist circumference, IL-6, and TNF-α at nine months, suggesting an improvement in inflammatory status with weight loss and the associated increase in adiponectin.
In the present study, leptin was significantly associated with percentage body fat at baseline, which is consistent with previous findings.Citation17 There was no significant correlation found between leptin and waist circumference in the present study at baseline. This suggests that there may be a greater release of leptin from peripheral subcutaneous adipose tissue compared with visceral adipose tissue. Studies have shown that there are variations in leptin gene expression in adipose tissue depending on the site where it is deposited, where expression is greater in subcutaneous compared with visceral adipose tissue.Citation18,Citation19 Alternatively, the lack of association between leptin and waist circumference may have been due to issues in the measurement of waist circumference in grade III obese patients, a difficulty which is well recognized. Establishing the correct location and reading the tape in situ can be problematic. In addition, different protocols yield different results.Citation20
Leptin was significantly decreased at three and nine months in the LL group. The changes in leptin were significantly associated with fat mass, percentage body fat, and waist circumference. This is consistent with a number of studies in which leptin is shown to decrease in response to weight loss.Citation21–Citation24 There was also an association between leptin change and waist circumference change at nine months, reflecting an overall loss of fat mass. In addition, despite the minimal weight loss for the LCHP group, changes in leptin were inversely associated with HDL at nine months. This may suggest that even a small reduction in weight results in a beneficial trend of improvement in leptin levels which is likely to improve cardiovascular risk.
Levels of PAI-1 at baseline were associated with waist circumference, HOMA-IR, and insulin, suggesting that PAI-1 is involved in insulin resistance as previously reported.Citation25 Weight loss has been found to reduce the levels of PAI-1,Citation26–Citation28 indicating the influence of adipose tissue on the levels of this protein. Our study data are in support of this evidence, where changes in PAI-1 were associated with changes in fat mass for the LL group at nine months.
There was no evidence from the present study to support a strong link between resistin levels and weight. Of all the adipokines examined in this study, resistin appears to be the most controversial because the evidence appears to be equivocal and inconclusive.Citation29–Citation31 Further human studies are required to confirm whether there is a relationship between resistin and obesity, including insulin resistance and type 2 diabetes mellitus.
Similarly, despite the fact that IL-6 has been found to be increased in obesityCitation32,Citation33 and reduced in response to weight loss,Citation34 no significant differences at baseline or in response to diet were observed here. Subcutaneous adipose tissue is thought to release approximately 30% of systemic IL-6, and visceral adipose tissue is thought to release even more. However, the lack of change may be explained by the fact that only about 10% of total IL-6 is produced by fat cells.Citation35
In addition, mean levels of TNF-α did not correlate significantly with weight, waist circumference, or percentage body fat at baseline. These results were unexpected, because it is widely reported that TNF-α is linked with obesity.Citation36 Also, TNF-α did not show any significant decrease in response to weight loss or diet. However, in a study by Arvidsson et al,Citation37 circulating levels of TNF-α did not show a significant difference after a mean weight loss of 7.5% at 10 weeks. These authors concluded that adipose tissue has only a minor effect on the regulation of circulating TNF-α levels. Thus, TNF-α seems to be produced and acts locally in human fat tissue,Citation38 and there is no in situ release from adipose tissue into the blood.Citation35 A number of studies have observed no changes in IL-6 or TNF-α after significant reductions in weight (5–9 kg) with dietary and exercise interventions.Citation39,Citation40
However, it was interesting to observe that changes in IL-6 and TNF-α were significantly correlated at nine months in the LL group. This could be explained by the relationship between IL-6 and TNF-α whereby IL-6 exerts proinflammatory activity itself and increases TNF-α.Citation1 This would suggest that, despite weight loss not resulting in significant improvements in circulating levels of IL-6 and TNF-α, there appears to be an underlying clinically significant response whereby reduction in weight results in a decrease in inflammation.
There is evidence that weight loss achieved using a very low calorie diet results in changes in adipokine levels similar to those observed in response to bariatric surgery. Mitterberger et alCitation41 compared a group of patients for whom weight loss was achieved by dietary caloric restriction only with a group of patients in whom caloric restriction was induced by bariatric surgery (three gastric bypasses and eight gastric bands). They reported that despite the fact that only a 26% ± 7% weight loss was achieved in the dietary caloric restriction as compared with 43% ± 10% in the bariatric surgery group, changes in adipokines were not significantly different between the two groups. This may suggest an important role for the use of a weight loss approach, such as the very low calorie diet instead of bariatric surgery, which is highly invasive, expensive, and can lead to long-term vitamin and mineral deficiencies.Citation42
Although it remains unclear as to whether the adipokines investigated to date are responsible for the beneficial effects on health associated with weight loss, it is clear from this study and several others that there are important associations between weight loss, certain adipokines (such as adiponectin), leptin levels, and cardiovascular disease risk. In addition, the extent of weight loss required to elicit the benefits as well as the effects of the method by which weight loss is obtained remains unknown. However, it can be argued that there does seem to be a minimal weight loss required which was not achieved here in the LCHP group and a maximal weight loss beyond which further improvements in circulating adipokine levels are no longer observed, as demonstrated in the study by Mitterberg et al.Citation41 Further research would include determining if there is a ceiling effect for adipokine change in response to weight loss. This would involve directly comparing adipokine changes in response to weight loss achieved using a very low calorie diet as compared with weight loss achieved using surgical approaches.
There were several limitations to the present study. There were significantly more men on LL than on LCHP, but this may not have been too limiting because there were no significant gender effects on adipokine when all patients were combined at baseline, except for leptin, but this discrepancy may have resulted in the significant differences between the two groups at baseline for weight, waist circumference, and fat free mass. In addition, although the sample size provided a > 99% power for weight loss, the sample sizes may have been too small to observe associations and changes in adipokines, which would have been expected based on the literature.
Moreover, use of the multiplexed assay has been criticized in the scientific literature.Citation43 The multiplexed bead immunoassay allows the simultaneous detection of adipokines in small blood samples which may be particularly useful when samples are difficult to obtain. The use of this approach has been validated and found to be useful for leptin, adiponectin, and insulin in the evaluation of changes in obesity markers following weight reduction.Citation43 The relationship between the multiplexed bead immunoassay when compared with the radioimmunoassay or enzyme-linked immunoassay for other adipokines such as resistin, IL-6, and TNF-α, were reported to be quite weak. These differences could be explained by differences in antibody pairs and sample diluents, as well as the low effects of low concentrations of these adipokines. In addition, assay sensitivity remains an issue when compared with ultrasensitive enzyme-linked immunoassay methods.Citation43 However, the ability of multiplexed assays to detect adipokines of a broader dynamic range than enzyme-linked immunoassays, as well as its greater cost-effectiveness, time efficiency, requirement of smaller sample volumes, and the removal of interassay variability suggest that this approach is still to be considered a powerful tool, albeit with the above limitations.
Conclusion
It would appear that the significant weight loss of 23.8% observed on LL resulted in significant improvements in circulating levels of leptin, PAI-1, and adiponectin. Changes in these adipokines possibly resulted in improvements in fasting glucose, triacylglycerols, and HDL. This is most likely due to the overall weight loss achieved rather than macronutrient intake. Further research examining the adipokine response to weight loss using a very low calorie diet in comparison with surgical interventions would be beneficial to determine if the adipokine response to weight loss has a ceiling effect.
Disclosure
Professor Iain Broom is the Medical Director for LighterLife UK Ltd, which provided the funding for this study.
References
- Ronti T Lupattelli G Mannarino E The endocrine function of adipose tissue: an update Clin Endocrinol 2006 64 4 355 365
- Klein J Perwitz N Kraus D Fasshauer M Adipose tissue as source and target for novel therapies Trends Endocrinol Metab 2006 17 1 26 32 16309918
- Yang WS Lee WJ Funahashi T Weight reduction increases plasma levels of an adipose-derived anti-inflammatory protein, adiponectin J Clin Endocrinol Metab 2001 86 8 3815 3819 11502817
- Wadden TA Considine RV Foster GD Anderson DA Sarwer DB Caro JS Short- and long-term changes in serum leptin dieting obese women: effects of caloric restriction and weight loss J Clin Endocrinol Metab 1998 83 1 214 218 9435444
- Dandona P Weinstock R Thusu K Abdel-Rahman E Aljada A Wadden T Tumor necrosis factor-alpha in sera of obese patients: fall with weight loss J Clin Endocrinol Metab 1998 83 8 2907 2910 9709967
- Seshadri P Samaha FF Stern L Ahima RS Daily D Iqbal N Adipocytokine changes caused by low-carbohydrate compared to conventional diets in obesity Metab Syndr Relat Disord 2005 3 1 66 74 18370712
- Klimcakova E Kovacikova M Stich V Langin D Adipokines and dietary interventions in human obesity Obes Rev 2010 11 6 446 456 20059706
- Varady KA Tussing L Bhutani S Braunschweig CL Degree of weight loss required to improve adipokine concentrations and decrease fat cell size in severely obese women Metabolism 2009 58 8 1096 1101 19477470
- Madsen EL Rissanen A Bruun JM Weight loss larger than 10% is needed for general improvement of levels of circulating adiponectin and markers of inflammation in obese subjects: a 3-year weight loss study Eur J Endocrinol 2008 158 2 179 187 18230824
- Rolland C Hession M Murray S Wise A Broom I Randomized clinical trial of standard dietary treatment versus low-carbohydrate/high-protein diet or the LighterLife programme in the management of obesity J Diabetes 2009 1 207 217 20923540
- Thomas B Manual of dietetic practice 4th ed Oxford, UK Blackwell Sciences Ltd 2007
- Geloneze B Pereira JA Pareja JC Overcoming metabolic syndrome in severe obesity: adiponectin as a marker of insulin sensitivity and HDL-cholesterol improvements after gastric bypass Arq Bras Endocrinol Metabol 2009 53 2 293 300 Portuguese 19466223
- Cnop M Havel PJ Utzschneider KM Relationship of adiponectin to body fat distribution, insulin sensitivity and plasma lipoproteins: evidence for independent roles of age and sex Diabetologia 2003 46 4 459 469 12687327
- McQuigg M Brown JE Broom The Counterweight programme: prevalence of CVD risk factors by body mass index and the impact of 10% weight change Obes Res Clin Pract 2008 2 15 27
- Plaisance EP Grandjean PW Judd RL Jones KW Taylor JK The influence of sex, body composition, and nonesterified fatty acids on serum adipokine concentrations Metabolism 2009 58 11 1557 1563 19592049
- Schulze MB Shai I Rimm EB Li T Rifai N Hu FB Adiponectin and future coronary heart disease events among men with type 2 diabetes Diabetes 2005 54 2 534 539 15677512
- Muscelli E Mari A Casolaro A Separate impact of obesity and glucose tolerance on the incretin effect in normal subjects and type 2 diabetic patients Diabetes 2008 57 5 1340 1348 18162504
- Montague CT Farooqi IS Whitehead JP Congenital leptin deficiency is associated with severe early-onset obesity in humans Nature 1997 387 6636 903 908 9202122
- Van Harmelen V Reynisdottir S Eriksson P Leptin secretion from subcutaneous and visceral adipose tissue in women Diabetes 1998 47 6 913 917 9604868
- Wang J Thornton JC Bari S Comparisons of waist circumferences measured at 4 sites Am J Clin Nutr 2003 77 2 379 384 12540397
- Hotta K Funahashi T Arita Y Plasma concentrations of a novel, adipose-specific protein, adiponectin, in type 2 diabetic patients Arterioscler Thromb Vasc Biol 2000 20 6 1595 1599 10845877
- Okazaki T Himeno E Nanri H Ogata H Ikeda M Effects of mild aerobic exercise and a mild hypocaloric diet on plasma leptin in sedentary women Clin Exp Pharmacol Physiol 1999 26 5–6 415 420 10386231
- Xenachis C Samojlik E Raghuwanshi MP Kirschner MA Leptin, insulin and TNF-alpha in weight loss J Endocrinol Invest 2001 24 11 865 870 11817710
- Bastard JP Jardel C Bruckert E Elevated levels of interleukin 6 are reduced in serum and subcutaneous adipose tissue of obese women after weight loss J Clin Endocrinol Metab 2000 85 9 3338 3342 10999830
- Juhan-Vague I Alessi MC Vague P Thrombogenic and fibrinolytic factors and cardiovascular risk in non-insulin-dependent diabetes mellitus Ann Med 1996 28 4 371 380 8862693
- Sundell IB Nilsson TK Hallmans G Hellsten G Dahlen GH Interrelationships between plasma levels of plasminogen activator inhibitor, tissue plasminogen activator, lipoprotein (a), and established cardiovascular risk factors in a north Swedish population Atherosclerosis 1989 80 1 9 16 2532510
- Folsom AR Qamhieh HT Wing RR Impact of weight loss on plasminogen activator inhibitor (PAI-1), factor VII, and other hemostatic factors in moderately overweight adults Arterioscler Thromb Vasc Biol 1993 13 2 162 169
- Marckmann P Toubro S Astrup A Sustained improvement in blood lipids, coagulation, and fibrinolysis after major weight loss in obese subjects Eur J Clin Nutr 1998 52 5 329 333 9630382
- Nagaev I Smith U Insulin resistance and type 2 diabetes are not related to resistin expression in human fat cells or skeletal muscle Biochem Biophys Res Commun 2001 285 2 561 564 11444881
- Fain JN Cheema PS Bahouth SW Lloyd Hiler M Resistin release by human adipose tissue explants in primary culture Biochem Biophys Res Commun 2003 300 3 674 678 12507502
- Lee JH Chan JL Yiannakouris N Circulating resistin levels are not associated with obesity or insulin resistance in humans and are not regulated by fasting or leptin administration: cross-sectional and interventional studies in normal, insulin-resistant, and diabetic subjects J Clin Endocrinol Metab 2003 88 10 4848 4856 14557464
- Fried SK Bunkin DA Greenberg AS Omental and subcutaneous adipose tissues of obese subjects release interleukin-6: depot difference and regulation by glucocorticoid J Clin Endocrinol Metab 1998 83 3 847 850 9506738
- Bastard JP Maachi M Van Nhieu JT Adipose tissue IL-6 content correlates with resistance to insulin activation of glucose uptake both in vivo and in vitro J Clin Endocrinol Metab 2002 87 5 2084 2089 11994345
- Bruun JM Helge JW Richelsen B Stallknecht B Diet and exercise reduce low-grade inflammation and macrophage infiltration in adipose tissue but not in skeletal muscle in severely obese subjects Am J Physiol Endocrinol Metab 2006 290 5 E961 E967 16352667
- Mohamed-Ali V Goodrick S Rawesh A Subcutaneous adipose tissue releases interleukin-6, but not tumor necrosis factor-alpha, in vivo J Clin Endocrinol Metab 1997 82 12 4196 4200 9398739
- Zinman B Hanley AJ Harris SB Kwan J Fantus IG Circulating tumor necrosis factor-alpha concentrations in a native Canadian population with high rates of type 2 diabetes mellitus J Clin Endocrinol Metab 1999 84 1 272 278 9920095
- Arvidsson E Viguerie N Andersson I Verdich C Langin D Arner P Effects of different hypocaloric diets on protein secretion from adipose tissue of obese women Diabetes 2004 53 8 1966 1971 15277374
- Lofgren P van Harmelen V Reynisdottir S Secretion of tumor necrosis factor-alpha shows a strong relationship to insulin-stimulated glucose transport in human adipose tissue Diabetes 2000 49 5 688 692 10905474
- Dvorakova-Lorenzova A Suchanek P Havel PJ The decrease in C-reactive protein concentration after diet and physical activity induced weight reduction is associated with changes in plasma lipids, but not interleukin-6 or adiponectin Metabolism 2006 55 3 359 365 16483880
- Xydakis AM Case CC Jones PH Adiponectin, inflammation, and the expression of the metabolic syndrome in obese individuals: the impact of rapid weight loss through caloric restriction J Clin Endocrinol Metab 2004 89 6 2697 2703 15181044
- Mitterberger MC Mattesich M Klaver E Adipokine profile and insulin sensitivity in formerly obese women subjected to bariatric surgery or diet-induced long-term caloric restriction J Gerontol A Biol Sci Med Sci 2010 65 9 915 923 20576650
- Bal BS Finelli FC Koch TR Origins of and recognition of micro-nutrient deficiencies after gastric bypass surgery Curr Diab Rep 2011 11 2 136 141 21181311
- Martos-Moreno GA Burgos-Ramos E Canelles S Argente J Barrios V Evaluation of a multiplex assay for adipokine concentrations in obese children Clin Chem Lab Med 2010 48 10 1439 1446 20575747