
Abstract
Purpose
Limited data are available regarding the role of triglycerides, cholesterol and lipoproteins ratios as risk factors for nonalcoholic fatty liver disease (NAFLD) progression. In the present study, the investigators aimed to investigate the value of cardiovascular risk ratios of triglycerides, cholesterol, and lipoproteins as predictors of nonalcoholic steatohepatitis (NASH) and the correlation of such ratios with disease severity.
Patients and Methods
This study included 131 overweight and obese patients with NAFLD who were divided into NASH, borderline NASH, and non-NASH fatty liver (NNFL) subgroups according to NAFLD activity score (NAS) in liver biopsy, and 60 healthy participants as a control group. Lipid profile and lipid ratios including triglycerides/HDL (TGs/HDL), low-density lipoprotein/high-density lipoprotein (LDL/HDL) and total cholesterol/HDL (TC/HDL) ratios were measured.
Results
Significantly higher triglycerides/HDL ratio was found in NASH and borderline NASH, while higher cholesterol/HDL ratio was found in borderline NASH in comparison to controls. There were positive correlations between TGs/HDL and steatosis, ballooning, inflammation, BMI, and NAS; between LDL/HDL and inflammation; and between cholesterol/HDL and BMI, steatosis, and NAS. The highest AUC was that of TG/HDL (0.744), at a cut-off point of 3, with 71.8% sensitivity and 76.8% specificity.
Conclusion
Triglycerides, cholesterol and lipoprotein ratios showed higher levels in NASH and correlated with NAFLD severity, and above these cut-off ratios, we can rule in the NASH cases which confer also the cardiovascular morbidities. Structured lipid ratios could serve as markers to screen NASH progression from simple steatosis cases and clarify the link of NASH with the cardiovascular risk prediction in overweight and obese patients.
Introduction
Nonalcoholic fatty liver disease (NAFLD) is defined as one of the most prevalent chronic liver diseases having a considerable impact on the liver varying from hepatic inflammation to progressive fibrosis and eventually cirrhosis.Citation1 Thus, NAFLD may manifest as a benign condition called nonalcoholic fatty liver (NAFL) or simple steatosis, or as a nonalcoholic steatohepatitis (NASH) in which hepatic steatosis is associated with hepatic inflammation.Citation2
Several risk factors for NAFLD progression include histological evidence of hepatic inflammation which is the most important risk factor, age greater than 45 or 50 years,Citation3 diabetes mellitus,Citation4 elevated serum aminotransferases,Citation5 presence of ballooning degeneration plus Mallory hyaline, presence of fibrosis on biopsy,Citation6 body mass index ≥28 kg/m2,Citation7 and higher visceral adiposity index.Citation8
About 20 to 80% of people with NASH have dyslipidemia such as high blood triglyceride (TGs), high blood cholesterol, and/or low high-density lipoprotein (HDL) levels.Citation9 Several lipoprotein ratios have been defined to optimize the predictive capacity of the lipid profile in ischemic cardiovascular disease. Total cholesterol/high-density lipoprotein cholesterol (TC/HDL-C) known as the atherogenic index with greater predictive value than isolated parameters used independently. Triglycerides/HDL, Total cholesterol/HDL, and LDL/HDL ratios can provide information on risk factors that are difficult to quantify by routine analyses and could be a better mirror of the metabolic and clinical interactions between lipid fractions.Citation10
Liver biopsy is the gold standard method for the diagnosis of NASH. However, liver biopsy is an invasive procedure that is associated with some pain or discomfortCitation11 with rare, but potentially life-threatening complications like bleedingCitation12 and is prone to sampling errors.Citation13 In addition, given the numbers of patients with NAFLD, the use of liver biopsy in all cases would not be a practical choice based on clinical and financial basis.
There are multiple non-invasive serum markers which have been developed to predict disease progression from Non-NASH fatty liver “NNFL” to NASH. This study aimed to evaluate triglycerides/high-density lipoprotein-cholesterol (TGs/HDL-C), low-density lipoprotein/high-density lipoprotein-cholesterol (LDL/HDL-C), total cholesterol/HDL-cholesterol (TC/HDL-C) ratios as predictors of NASH and how far such markers could be correlated with disease severity.
Materials and Methods
Study Design
This is a case–control study from Cairo and Aim Shams Universities, Egypt. It was conducted on 191 individuals between May 2014 and Dec 2016.
Informed written consent was obtained from all participants in the study before enrolment. The study was conducted according to the local research governance requirements. The study protocol was accepted by the Research Ethical Committee of the Faculty of Medicine-Cairo University (N-17-2014).
Participants
191 participants were divided into 131 patients with NAFLD and 60 healthy subjects. The NAFLD patients were recruited from Gastroenterology, Hepatology, and Internal Medicine outpatient clinics of the Kasr El Ainy and Ain Shams University Hospitals. The healthy non-obese controls were recruited from healthy donors of living-related liver transplantation, for whom liver biopsy was routinely conducted.
All Adult patients with clinical, radiological, or histological evidence of NAFLD were included while, patients with alcoholic, viral, autoimmune, neoplastic, decompensated, or hereditary liver diseases, and those with familial hypercholesterolemia, thyroid disease chronic kidney disease, diabetes and hypertension, or concurrently with local or systemic infection and those on drugs such as steroids, retinoids, antiretrovirals, tamoxifen, and oral contraceptives were ruled out from the study.
Methods
All patients and healthy participants were subjected to complete medical history and clinical examination, including abdominal examination, waist circumference, and body mass index (BMI) measurement.
Biochemical Examination
The laboratory work was conducted at the Clinical Pathology Departments, Internal Medicine Hospitals, Cairo and Ain Shams Universities. Complete blood count (CBC) was performed using the Coulter counter (T660) (Beckman Coulter, Inc., Brea, CA, USA). Aspartate aminotransferase (AST), alanine aminotransferase (ALT), bilirubin, albumin, fasting blood sugar (FBS), 2 hrs postprandial blood sugar (2hPP), creatinine, and blood urea nitrogen (BUN) were estimated using Synchron CX9 auto-analyzer (Beckman Instruments Inc.; Scientific Instruments Division, Fullerton, Brea City, CA, USA). Prothrombin time (PT) and international normalized ratio (INR) were measured on Diagnostica Stago (Asnieres, France).
Lipid profile including total cholesterol (T-chol), triglycerides (TGs), high-density lipoprotein (HDL), and low-density lipoprotein (LDL), was analyzed using Beckman Coulter AU480 System (Beckman Coulter, Inc., Brea, CA, USA). Samples for lipids were taken after 12 hrs of fasting. Calculation of TGs/HDL, LDL/HDL, and TC/HDL ratios was done.
Radiological Examination and Liver Biopsy
Abdominal ultrasound was conducted using a Toshiba Aplio XV scanner (Toshiba, Japan) equipped with a broadband 3.5–5 MHz curved array probe to assess the presence of liver steatosis and fibrosis.
Ultrasound-guided liver biopsies were conducted under conscious sedation using a 16-gauge semiautomatic tru-cut biopsy needle (GTA, UK) after a written consent. The length of the histological specimens was not less than 2.5 cm. The samples were fixed in 10% neutral-buffered formalin, embedded in paraffin blocks, and then cut into 5-μm-thick sections and stained with hematoxylin and eosin. They were examined under a light microscope for histopathologic confirmation of the diagnosis of NAFLD, grading of severity, and exclusion of other diseases. For differentiating NNFL from NASH, we calculated the NAFLD activity score (NAS).Citation14 The NAS is the sum of the biopsy’s scores for steatosis (S0 to S3), lobular inflammation (0 to 3) and hepatocellular ballooning (0 to 2). A NAS <3 corresponds to NNFL, 3 to 4 corresponds to borderline NASH, and a score ≥5 corresponds to NASH.Citation14
Grouping and Subgrouping
The studied patients were divided into three subgroups:
NASH group included 46 patients with histological evidence of NASH and NAS= 5–8.
Borderline NASH group which included 49 patients with NAS= 3–4.
NNFL group which included 36 patients with histological evidence of simple steatosis and NAS= 0–2.
Statistical Methods
Data were coded and entered using the International Business Machines (IBM) statistical package for Social Sciences (SPSS version 24; Chicago, IL, USA). Data were summarized using mean and standard deviation (SD) for quantitative variables and frequencies (number of cases) and relative frequencies (percentages) for categorical variables. Comparisons between groups were done using unpaired t-test when comparing 2 groups, and analysis of variance (ANOVA) with multiple comparisons post hoc test when comparing more than 2 groups.Citation15 For comparing categorical data, Chi-square (χ2) test was performed. Exact test was used instead when the expected frequency is less than 5.Citation16 Correlation between quantitative variables was done using Pearson correlation coefficient.Citation17 P-values less than 0.05 were considered as statistically significant. Receiver operating characteristic (ROC) curve analysis was carried out to test the diagnostic performance of a test or the accuracy of a test to discriminate diseased cases from normal cases. In the ROC curve, the true-positive rate (sensitivity) is plotted in function of the false-positive rate (100-specificity) for different cutoff points of a parameter. Each point on the ROC curve represents a sensitivity/specificity pair corresponding to a decision threshold. The area under the ROC curve (AUC) is a measure of how accurate a parameter can distinguish between two diagnostic groups (diseased/normal).
Results
The clinical and laboratory parameters of NAFLD patients and controls are shown in . NAFLD patients showed a statistically significant higher BMI, waist circumference, systolic and diastolic blood pressure, total leucocytic count, serum levels of AST and ALT, serum creatinine, fasting blood glucose, serum triglycerides, total cholesterol, LDL-C, TGs/HDL, LDL/HDL, total cholesterol/HDL ratios, and significant lower HDL levels. Their mean age was 40.6±9.8.
Table 1 Clinical and Laboratory Data of the NAFLD Patients and Controls
In the current study, most of NAFLD patients (128, 97.7%) had no fibrosis in liver biopsy, while 3 patients (2.3%) had stage F1.
There is a female preponderance towards NASH. NNFL or Simple Steatosis subgroup included 36 patients (27.5% of NAFLD group), 13 females and 23 males, with a mean age of 33.17 ± 10.50 years. Borderline NASH subgroup included 49 patients (37.4% of NAFLD group), 46 females and 3 males, with mean age 42.55 ± 8.47 years. NASH subgroup included 46 patients (35.1% of NAFLD group), 43 females and 3 males, with a mean age 44.33 ± 7.28 years.
The mean of NAS was 5.33±0.6, 3.61±0.49, 1.33±0.4 in NASH, Borderline NASH, and NNFL groups, respectively ().
Table 2 Clinical and Laboratory Data in Subgroups of NAFLD Patients
Significant higher age, BMI, waist circumference, triglycerides, ALT, TG/HDL, were found in the NASH group when compared to the NNFL group, and in the Borderline NASH group in comparison to NNFL group. Significant higher total cholesterol, fasting blood sugar, and total cholesterol/HDL ratio were found in Borderline NASH when compared to the NNFL group. Significant higher AST was found in NASH group when compared to NNFL group; however, LDL/HDL-C was comparable in NASH and NNAFL (post hoc test)
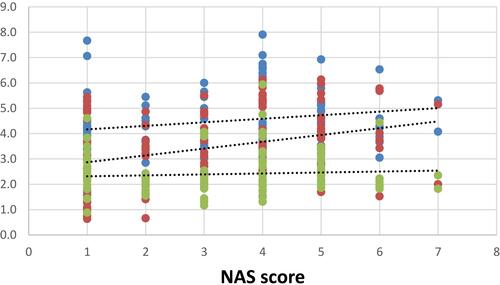
There were significant positive correlations between TGs/HDL and each of age, BMI, waist circumference and NAS (r=0.27, 0.383, 0.337 & 0.312 with p=0.002, ˂ 0.001, ˂ 0.001& ˂ 0.001, respectively), as well as it was noticed that theses aforementioned variables were weakly correlated to T.cholesterol/HDL (r=0.264,0.193, 0.248 & 0.207 with p=0.002, 0.028, 0.004& 0.018, respectively) as shown in –.
Figure 1 Correlations of lipid profile and ratios with age.
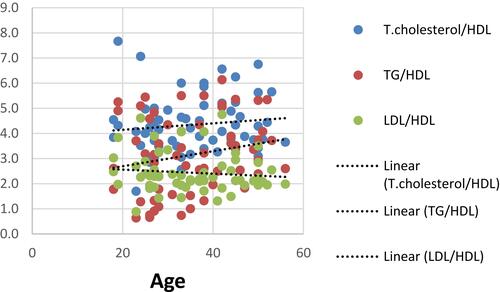
Figure 2 Correlations of lipid profile and ratios with BMI.
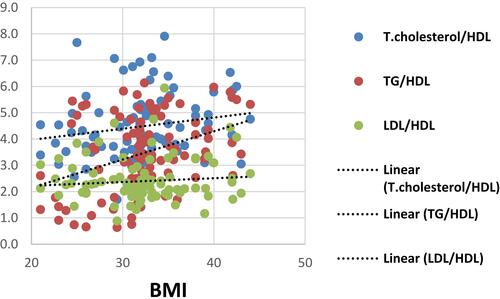
Figure 3 Correlations of lipid profile and ratios with waist circumference.
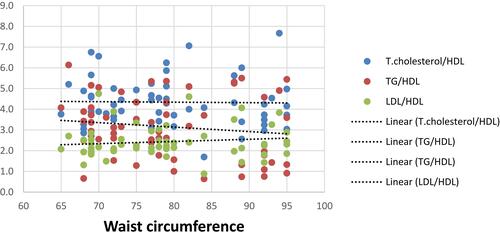
Figure 4 Correlations of lipid profile and ratios with NAS score.
HA1C was significantly proportionate to TG/HDL, LDL/HDL and Cholesterol/HDL (r=0.508,0.456,& 0.414 with p=0.004, 0.01& 0.021, respectively).
On the other hand, there were no correlations between serum TC, TGs, LDL, TC/HDL, TGS/HDL, LDL/HDL ratios and liver enzymes or alkaline phosphatase.
ROC curve analysis was performed to evaluate the discriminate validity of these ratios as predictors of NASH disease. We analyzed the performance of these ratios at the well-determined cardiovascular risk cutoff values. The highest AUC was that of TG/HDL (0.744), at a cut-off point of 3, with 71.8% sensitivity and 76.8% specificity ().
Table 3 Cross-Tabulation to Determine a Cut-off Point of the TG/HDL, and TC/HDL in the Prediction of NAFLD Based on Cardiovascular Risk*
So above these cut-off ratios, we can rule in the NASH cases which confers cardiovascular morbidities.
As well as we used the med calc program to find out the optimal metric characteristics of these ratios applied to our cohort and revealed that TG/HDL and TC/HDL showed fair specificity but significant sensitivity in the prediction of NAFLD. Below these cut-off values, we can rule out the suspected cases of NAFLD. The highest AUC was that of TG/HDL, at a criterion of 2.3 with 91.7% sensitivity and 64.2% specificity ().
Table 4 Cross-Tabulation to Determine a Cut-off Point of the TG/HDL, and TC/HDL in the Prediction of NAFLD Based on Our Study Data*
Discussion
The current study revealed that not only dyslipidemia is a prominent feature in fatty liver disease patients, but and structured lipid ratios could serve as markers to screen NASH progression from simple steatosis cases and clarify the link of NASH as a severe form of NAFLD linked with the cardiovascular risk prediction in overweight and obese patients.
Limited data are available regarding the role of cholesterol and lipoprotein ratios as risk factors for NAFLD. Nevertheless, about two-thirds of plasma cholesterol is found in LDL and, accordingly, total and LDL cholesterol are closely related. Like the total cholesterol/HDL-C, LDL/HDL-C may have more predictive value if triglyceridemia is considered.Citation18
NAFLD is strongly associated with metabolic syndrome, and it may be a prelude to its future development. In light of the potential associated major adverse cardiovascular risks with fatty liver disease, the importance of early diagnosis and treatment may be protective.Citation10 The goal of the current study is to elucidate the predictive role of lipid profile ratios in diagnosing NAFLD concerning cardiovascular impact.
Significant higher TC, TG, LDL, TGs/HDL, TC/HDL, LDL/HDL, and lower HDL were found in the NAFLD group in comparison to normal controls. Also, significant higher TG, TGs/HDL, were found in NASH and borderline NASH groups in comparison to the NNFL group; and significant higher TC, TC/HDL were found in borderline NASH in comparison to NNFL in the present study. This agrees with the results of a large recent Chinese study done by Wu et al, in which adults with high TC/HDL-C or TG/HDL-C ratios, or both, had a greater risk for NAFLD, especially advanced NAFLD.Citation19 Previous studies demonstrated an association between NASH and high levels of triglycerides, cholesterol and free fatty acids compared to subjects without NASH.Citation20 Reduced concentration of HDL cholesterol could be correlated with numerous risk factors, including the components of the metabolic syndrome.Citation10
In the current study, there were positive correlations between TGs/HDL ratio and hepatic steatosis, inflammation, ballooning and NAS, and between serum TGs and hepatic inflammation, ballooning and NAS. In the initial “two-hit” model of the pathogenesis of NASH, excess TG accumulation resulting in hepatic steatosis was considered the primary harmful step for NASH development.Citation21
In our study, there were significant positive correlations between TC/HDL ratio and steatosis and NAS, and between serum TC and steatosis, ballooning and NAS. There is evidence of increased hepatic cholesterol synthesis and a dysregulation of the cholesterol metabolism in NASH patients compared to lean and obese controls.Citation22 Progressive increase of hepatic free cholesterol was observed in patients with NASH compared to patients without hepatic inflammation.Citation23 Numerous cholesterol-containing droplets and cholesterol crystals were demonstrated inside Kupffer cells in human NASH livers, which were not observed in patients with simple steatosis.Citation24 Thus, in addition to TGs, cholesterol is a significant risk factor for NASH.
In the present study, there was a significant positive correlation between LDL and LDL/HDL and hepatic inflammation. For cholesterol to be transported through the circulation, it is packaged into lipoproteins. Under normal circumstances, low-density lipoprotein (LDL) cholesterol is internalized into macrophages by LDL receptor-mediated endocytosis. However, under fat-rich conditions and thus high plasma LDL cholesterol levels, LDL cholesterol is taken up via the scavenger receptor-mediated pathway in an unlimited manner. In contrast to the LDL receptor, scavenger-receptor-mediated uptake is not downregulated in the presence of high LDL cholesterol concentrations. As such, the uncontrolled scavenger receptor-mediated uptake of LDL cholesterol into the liver is responsible for the generation of lipid-laden (foamy) Kupffer cells and cholesterol crystals, which both are crucial events for the development of NASH.Citation25 The formation of cholesterol crystals is the consequence of the long-term intracellular accumulation of free cholesterol, which in turn may trigger inflammation.Citation26 Additionally, LDL cholesterol is highly susceptible to oxidative damage and is transformed into a harmful oxidized LDL (oxLDL) lipid, which was found to be elevated in the plasma of NASH patients.Citation27 Cholesterol accumulation inside hepatocytes may sensitize these cells to transforming growth factor-beta (TGF-β) induced activation in a vicious cycle, resulting in enhanced cholesterol accumulation, NASH development, and subsequent liver damage.Citation28
There were positive correlations between TGs/HDL and age, BMI, waist circumference, diastolic blood pressure, fasting and 2 hrs postprandial blood sugar, and HA1C in NAFLD patients. This agrees with a previous study on pediatric and adolescent population by Pacifico et alCitation29 in which there was a progressive increase in BMI, waist circumference, blood pressure, glucose values with increasing TG/HDL-C values.Citation29
In the current study, significant higher systolic and diastolic blood pressure measures were found in NAFLD patients when compared to controls. This agrees with Li et al, who found a significant association between NAFLD and the risk of hypertension especially in males.Citation30
A higher number and percentage of female patients were found in NASH and Borderline NASH subgroups in the present study comparing to healthy participants and NNFL patients. Although early studies emphasized that NAFLD was more common in women,Citation2 previous studies had shown that NAFLD has a more even distribution between men and women.Citation31 Based on the third National Health and Nutrition Examination Survey (NHANES) data, most of the studies reported that NAFLD is significantly more prevalent in men than in women.Citation32 However, after dichotomizing individuals into lean and overweight-obese groups, Younossi et al,Citation33 reported that the lean NAFLD cohort was more commonly female. Using data from the characterized NASH Clinical Research Network (CRN), patients with biopsy-proven NASH were more likely to be female than male in a roughly 2:1 ratio; possibly reflecting a higher disease burden in women.Citation34 Those previous findings highlight uncertainties regarding the influence of gender on NAFLD. Higher waist-to-hip circumference (WHR) ratio in men which correlates with visceral adiposity and is associated with both peripheral and hepatic insulin resistance (IR), together with the protective role of females’ sex hormone, are suggested factors that may influence the gender differences in the prevalence of NAFLD.
There were significantly higher weight, waist circumference, BMI, FBS, liver enzymes in the NAFLD group, NASH and borderline NASH subgroups when compared with healthy participants and NNFL patients in the present study. In a large meta-analysis study done by Younossi et al, metabolic comorbidities associated with NAFLD included obesity, type 2 diabetes, hyperlipidemia, hypertension, and metabolic syndrome.Citation35
Attempting to evaluate the performance of these simple structured ratios, in the present study, we used first the well-determined cardiovascular risk ratios that showed better specificity to detect the true negative cases among healthy subjects, so subjects with values above cardiovascular ratios are strongly linked to NAFLD. While the calculated cut-off values according to our studied population, TG/HDL, TC/HDL and LDL/HDL were found to be at lower values than CVD risk ratios (3.7, 2.7 and 1.8, respectively) with fair specificity but significant sensitivity in prediction of NAFLD. Below these values, we can rule out the suspected cases of NAFLD. The highest AUC was that of TG/HDL, at a criterion of 2.3 with 91.7% sensitivity and 64.2% specificity.
TG/HDL was found to be superior parameter which can distinguish between two diagnostic groups (NAFLD and NNAF) on different plotted cut-off values according to cardiovascular risk ratios and the selected points by Medcalc system, so that it can be considered a better predictor for NAFLD and Cardiovascular complications, this finding goes in line with recently found by Chen et al.Citation36
Given the role of NAFLD as an independent cardiovascular risk factor, so early detection and management might precede the occurrence of CVD morbidities,Citation37 thus our newly depicted cut-off ratios could be used to screen every suspected case of NASH for earlier diagnosis compared to those of cardiovascular risk.
The shortcoming of this study lies in the small-sized sample that needs further study for more confirmative results about these ratios and the cross-sectional nature of the study; however, our findings may provide a basis to implement policy using simple markers to detect NAFLD cases.
Conclusion
Not only higher serum cholesterol, lipids, and lipoprotein ratios were demonstrated in NASH and Borderline NASH patients in comparison to NNFL patients; moreover, lipid ratios particularly TG/HDL were highly linked to NASH progression from simple steatosis cases and Cardiovascular risk side by side, which might be expected to better guide early identification of individuals at risk.
Acknowledgments
The authors thank Dr. Abeer M. ElSayed, consultant at the pathology department, National Cancer Institute, Cairo University, Cairo, Egypt, for her help in the histopathological examination of liver biopsies obtained from the participants. The authors also thank Dr. Mohamed Eshra, lecturer of physiology, Faculty of Medicine, Cairo University, Cairo, Egypt, for his help in the statistical analysis of the results. We thank all the participants in our study for their valuable contribution as well.
Disclosure
The authors report no funding and no conflicts of interest in this work.
References
- Caldwell SH, Crespo DM. The spectrum expanded: cryptogenic cirrhosis and the natural history of non-alcoholic fatty liver disease. J Hepatol. 2004;40(4):578–584. doi:10.1016/j.jhep.2004.02.013
- Sheth SG, Gordon FD, Chopra S. Nonalcoholic steatohepatitis. Ann Intern Med. 1997;126(2):137–145. doi:10.7326/0003-4819-126-2-199701150-00008
- Argo CK, Northup PG, Al-Osaimi AM, Caldwell SH. Systematic review of risk factors for fibrosis progression in non-alcoholic steatohepatitis. J Hepatol. 2009;51(2):371–379. doi:10.1016/j.jhep.2009.03.019
- Hossain N, Afendy A, Stepanova M, et al. Independent predictors of fibrosis in patients with nonalcoholic fatty liver disease. Clin Gastroenterol Hepatol. 2009;7(11):1224–9, 1229.e1-2. doi:10.1016/j.cgh.2009.06.007
- Francque SMA, Verrijken A, Mertens I, et al. Noninvasive assessment of nonalcoholic fatty liver disease in obese or overweight patients. Clin Gastroenterol Hepatol. 2012;10(10):1162–1168. doi:10.1016/j.cgh.2012.06.019
- Matteoni CA, Younossi ZM, Gramlich T, Boparai N, Liu YC, McCullough AJ. Nonalcoholic fatty liver disease: a spectrum of clinical and pathological severity. Gastroenterology. 1999;116(6):1413–1419. doi:10.1016/S0016-5085(99)70506-8
- Ratziu V, Giral P, Charlotte F, et al. Liver fibrosis in overweight patients. Gastroenterology. 2000;118(6):1117–1123. doi:10.1016/S0016-5085(00)70364-7
- Petta S, Amato MC, Di Marco V, et al. Visceral adiposity index is associated with significant fibrosis in patients with non-alcoholic fatty liver disease. Aliment Pharmacol Ther. 2012;35(2):238–247. doi:10.1111/apt.2011.35.issue-2
- Leonardo A, Ballestri S, Marchesini G, Angulo P, Loria P. Nonalcoholic fatty liver disease: a precursor of the metabolic syndrome. Dig Liver Dis. 2015;47(3):181–190. doi:10.1016/j.dld.2014.09.020
- Pastori D, Baratta F, Novo M, et al. Remnant lipoprotein cholesterol and cardiovascular and cerebrovascular events in patients with non-alcoholic fatty liver disease. J Clin Med. 2018;7(11):378. doi:10.3390/jcm7110378
- Chalasani N, Younossi Z, Lavine JE, et al. The diagnosis and management of non-alcoholic fatty liver disease: practice Guideline by the American Association for the Study of Liver Diseases, American College of Gastroenterology, and the American Gastroenterological Association. Hepatology. 2012;55:2005–2023. doi:10.1002/hep.25762
- Figen CC, Nevil A, Hasan N. Complications and efficiency of liver biopsies using the Tru-Cut biopsy gun. J Infect Dev Ctries. 2010;4:91–95. doi:10.3855/jidc.572
- Merat S, Sotoudehmanesh R, Nouraie M, et al. Sampling error in histopathology findings of nonalcoholic fatty liver disease: a post mortem liver histology study. Arch Iran Med. 2012;15:418–421.
- Kleiner D, Brunt EM, Natta MV, et al. Design and validation of a histological scoring system for nonalcoholic fatty liver disease. Hepatology. 2005;41(6):1313–1321. doi:10.1002/(ISSN)1527-3350
- Chan YH. Biostatistics102: quantitative data – parametric & non-parametric tests. Singapore Med J. 2003a;44(8):391–396.
- Chan YH. Biostatistics 103: qualitative data –tests of independence. Singapore Med J. 2003b;44(10):498–503.
- Chan YH. Biostatistics 104: correlational analysis. Singapore Med J. 2003c;44(12):614–619.
- Ascaso J, Gonzalez Santos P, Hernandez Mijares A, et al. Management of dyslipidemia in the metabolic syndrome: recommendations of the Spanish HDL-Forum. Am J Cardiovasc Drugs. 2007;7(1):39–58. doi:10.2165/00129784-200707010-00004
- Wu KT, Kuo PL, Su SB, et al. Nonalcoholic fatty liver disease severity is associated with the ratios of total cholesterol and triglycerides to high-density lipoprotein cholesterol. J Clin Lipidol. 2016;10(2):420–425. doi:10.1016/j.jacl.2015.12.026
- Puri P, Wiest MM, Cheung O, et al. The plasma lipidomic signature of nonalcoholic steatohepatitis. Hepatology. 2009;50(6):1827–1838. doi:10.1002/hep.23229
- Day CP, James OF. Steatohepatitis: a tale of two “hits”? Gastroenterol. 1998;114(4):842–845. doi:10.1016/S0016-5085(98)70599-2
- Asrih M, Jornayvaz FR. Inflammation as a potential link between nonalcoholic fatty liver disease and insulin resistance. J Endocrinol. 2013;218(3):R25–36. doi:10.1530/JOE-13-0201
- Min HK, Kapoor A, Fuchs M, et al. Increased hepatic synthesis and dysregulation of cholesterol metabolism is associated with the severity of the nonalcoholic fatty liver disease. Cell Metab. 2012;15(5):665–674. doi:10.1016/j.cmet.2012.04.004
- Puri P, Baillie RA, Wiest MM, et al. A lipidomic analysis of nonalcoholic fatty liver disease. Hepatology. 2007;46(4):1081–1090. doi:10.1002/(ISSN)1527-3350
- Ioannou GN, Haigh WG, Thorning D, Savard C. Hepatic cholesterol crystals and crown-like structures distinguish NASH from simple steatosis. J Lipid Res. 2013;54(5):1326–1334. doi:10.1194/jlr.M034876
- Walenbergh MA, Koek GH, Bieghs V, Shiri-Sverdlov R. Non-alcoholic steatohepatitis: the role of oxidized low-density lipoproteins. J Hepatol. 2013;58(4):801–810. doi:10.1016/j.jhep.2012.11.014
- Hendrikx T, Walenbergh SM, Hofker MH, Shiri-Sverdlov R. Lysosomal cholesterol accumulation: driver on the road to inflammation during atherosclerosis and non-alcoholic steatohepatitis. Obesity Rev. 2014;15(5):424–433. doi:10.1111/obr.12159
- Tomita K, Teratani T, Suzuki T, et al. Free cholesterol accumulation in hepatic stellate cells: mechanism of liver fibrosis aggravation in nonalcoholic steatohepatitis in mice. Hepatology. 2014;59(1):154–169. doi:10.1002/hep.26604
- Pacifico L, Bonci E, Andreoli G, et al. Association of serum triglyceride-to-HDL cholesterol ratio with carotid artery intima-media thickness, insulin resistance and nonalcoholic fatty liver disease in children and adolescents. Nutr Metab Cardiovasc Dis. 2014;24(7):737–743. doi:10.1016/j.numecd.2014.01.010
- Li XD, Qiu BH, Su FC, Sun SX. Gender impacts on the correlations between nonalcoholic fatty liver disease and hypertension in a Chinese population aged 45-60 y. Clin Exp Hypertens. 2016;38(7):639–643. doi:10.1080/10641963.2016.1182181
- Carulli L, Lonardo A, Lombardini S, Marchesini G, Loria P. Gender, fatty liver and GGT. Hepatology. 2006;44(1):278–279. doi:10.1002/(ISSN)1527-3350
- Pan J, Fallon MB. Gender and racial differences in nonalcoholic fatty liver disease. World J Hepatol. 2014;6(5):274–283. doi:10.4254/wjh.v6.i5.274
- Younossi ZM, Stepanova M, Negro F, et al. Nonalcoholic fatty liver disease in lean individuals in the United States. Medicine. 2012;91:319–327. doi:10.1097/MD.0b013e3182779d49
- Neuschwander-Tetri BA, Clark JM, Bass NM, et al; NASH Clinical Research Network. Clinical, laboratory and histological associations in adults with nonalcoholic fatty liver disease. Hepatology. 2010;52:913–924. doi:10.1002/hep.23784
- Younossi ZM, Koenig AB, Abdelatif D, Fazel Y, Henry L, Wymer M. Global epidemiology of nonalcoholic fatty liver disease-Meta-analytic assessment of prevalence, incidence, and outcomes. Hepatology. 2016;64(1):73–84. doi:10.1002/hep.v64.1
- Chen Z, Qin H, Qiu S, Chen G, Chen Y. Correlation of triglyceride to high-density lipoprotein cholesterol ratio with nonalcoholic fatty liver disease among the non-obese Chinese population with normal blood lipid levels: a retrospective cohort research. Lipids Health Dis. 2019;18:162. doi:10.1186/s12944-019-1104-6
- Sven MF, Denise VG, Wilhelmus JK. Non-alcoholic fatty liver disease and cardiovascular risk: pathophysiological mechanisms and implications. J Hepatol. 2016;65:425–443. doi:10.1016/j.jhep.2016.04.005