
Abstract
Purpose
The associations of adiponectin with type 2 diabetes mellitus (T2DM), glucose homeostasis (including β-cell function index (HOMA-β), insulin resistance (HOMA-IR), fasting insulin (FI) and fasting glucose (FG)) have reported in epidemiological studies. However, the previous observational studies are prone to biases, such as reverse causation and residual confounding factors. Herein, a Mendelian Randomization (MR) study was conducted to determine whether causal effects exist among them.
Materials and and Methods
Two-sample MR analyses and multiple sensitivity analyses were performed using the summary data from the ADIPOGen consortium, MAGIC Consortium, and a meta-analysis of GWAS with a considerable sample of T2DM (62,892 cases and 596,424 controls of European ancestry). We got eight valid genetic variants to predict the causal effect among adiponectin and T2DM and glucose homeostasis after excluding the probable invalid or pleiotropic variants.
Results
Adiponectin was not associated with T2DM (odds ratio (OR) = 1.004; 95% confidence interval (CI): 0.740, 1.363) when using MR Egger after removing the invalid SNPs, and the results were consistent when using the other four methods. Similar results existed among adiponectin and HOMA-β, HOMA-IR, FI, FG.
Conclusion
Our MR study revealed that adiponectin had no causal effect on T2DM and glucose homeostasis and that the associations among them in observational studies may be due to confounding factors.
Introduction
Type 2 diabetes mellitus (T2DM), affecting no less than 400 million people all over the world,Citation1 is a classic example of the polygenic disease. The prevalence and morbidity of T2DM are rapidly increasing worldwide.Citation2,Citation3 The prevalence of diabetes and prediabetes was estimated to be 11.6% and 50.1%, respectively, in China, in 2013.Citation4 The people with diabetes mellitus are evaluated to increase to 42.3 million by 2030.Citation5,Citation6 T2DM is also one of the critical risk factors of nonalcoholic fatty liver disease, which is considered the most common chronic liver disease globally.Citation7 The risk of T2DM consists of two parts, genetic factors and unhealthy living,Citation8 and the heritability estimates are moderate to high (0.47–0.77).Citation9 The inheritance of adiponectin is ethnically specific, whose variants at CDH13, ADIPOQ, PDE3A, RFC4, EIF4A2, and so on exhibited significant association (P < 5 E-8) in the European ethnicity.Citation10,Citation11 In contrast, the variants at CDH13, KNG1-ADIPOQCitation12–Citation14 (P < 5E-8), and WDR11-FGFR2 (P = 3E−14) exhibited significant association in Asians.Citation15 Besides, there also provided suggestive evidence for a locus on chromosome 12 near OR8S1-LALBA (P = 1.2E-7) in Asians.Citation15 Adiponectin, which is an anti-inflammatory adipocytokine secreted by adipocytes, has anti-atherogenic and anti-inflammatory properties and was implicated in comprehensive biological pathways associated with insulin resistance (HOMA-IR).Citation16–Citation18 Inflammation has been considered the potential cause of T2DM.Citation19,Citation20 The destruction of the β-cell function index (HOMA-β) leads to an absolute lack of insulin, and impaired HOMA-β and HOMA-IR are vital determinants of T2DM.Citation21 Cross-sectional epidemiological studies have shown that low serum adiponectin is connected to HOMA-β,Citation22 HOMA-IR, T2DM, and obesity.Citation23,Citation24 In longitudinal studies, hypoadiponectinemia was able to forecast the development of HOMA-IR, T2DM, low-density lipoprotein cholesterol, and triglyceride.Citation24–Citation27 Increasing adiponectin is connected with a lower risk of T2DM,Citation24,Citation28 and inversely relates to changes in HOMA-β.Citation22 However, whether this correlation is causal or reverse causal or caused by confounding factors remains unknown.
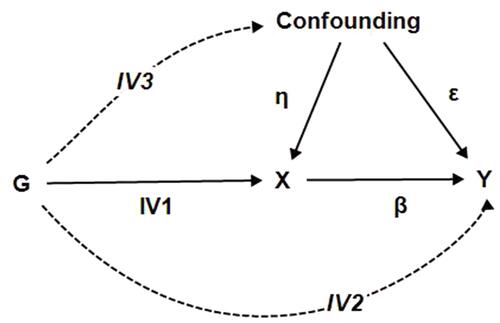
Mendelian randomization (MR) utilizes genetic variants as instrumental variables (IVs) and explore the causal effect between exposure and outcome, but has to meet that the IVs associated with the exposure (IV1, P<5E-8) and the IVs do not affect the outcome through other paths other than the exposure of interest (IV2) and are not associated with confounders (IV3) (). Any SNPs that go against these assumptions should be served as invalid IVs and removed.Citation29,Citation30 MR can overcome the weakness of classical epidemiological studies and provide available evidence to support or reject causal hypotheses using the existing summary data of genome-wide association studies (GWAS).Citation30 MR is not vulnerable to confounding factors because the genotype of an individual is determined at gamete formation and cannot be altered later on. Therefore, reverse causation is impossible.Citation26 MR analyses have been conducted to explore the causal relationship between adiponectin and HOMA-IR, but the conclusion is controversial.Citation23,Citation28,Citation31 Studies have shown that no causal relationship exists among adiponectin and fasting glucose (FG), fasting insulin (FI).Citation31 Nonetheless, the result was disappointing because either the sample size was too small or multiracial issues were involved.Citation23 Here, we will evaluate the effects of adiponectin on T2DM and glucose homeostasis utilizing the summary data of European ancestry.
Figure 1 A directed acyclic graph representing the MR framework.
Notes: IV1: The G associates with the X (P<5E-8); IV2: The G should not straightforwardly associate with Y; IV3: The G should not associate with any confounding factors.
Abbreviations: MR, Mendelian randomization; G, multiple single nucleotide polymorphisms; X, exposure; Y, outcome; η, the correlation coefficient of confounding factors and exposure; ε, the correlation coefficient of confounding factors and outcome; β, the causal effect estimate of the exposure and outcome.
Materials and Methods
Study Design
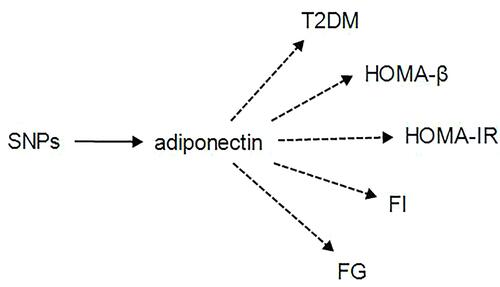
We researched the relationship between adiponectin and T2DM and four related glucose homeostasis traits (HOMA-β, HOMA-IR, FI, FG) using MR. The hypotheses and study design were shown in .
Figure 2 The unidirectional flow chart showing the relationship between adiponectin and outcomes.
Notes: To explore whether adiponectin regulated by the SNPs is the cause of T2DM and glucose homeostasis. The solid arrow represents the causal effect, and the dotted arrow may have a causal relationship.
Abbreviations: SNPs, single-nucleotide polymorphisms; T2DM, type 2 diabetes mellitus; HOMA-B, β-cell function index; HOMA-IR, insulin resistance; FI, fasting insulin; FG, fasting glucose.
Selection of IVs and Datasets
Adiponectin and Glucose Homeostasis
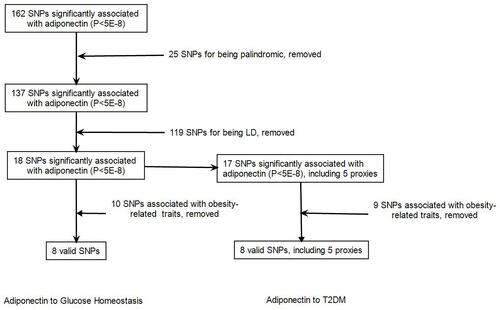
We identified 162 candidate variants (Table S1, https://www.mcgill.ca/genepi/adipogen-consortium) that had genome-wide significant (P<5E-8) associations with adiponectin in the ADIPOGen consortium, which conducted the meta-analysis of GWASs of adiponectin levels (European ancestry, n = 39883).Citation10,Citation11,Citation16 When the F statistic is 10, it is equivalent to the p-value of 0.001, and 30 corresponds to 5E-8.Citation32 So our IVs are thus compelling. We removed 25 SNPs for being palindromic and 119 SNPs for being palindromic linkage disequilibrium (LD). The calculation of LD utilized the European population data of 1000 Genomes Project (CEU (Utah Residents from North and West Europe), FIN (Finnish in Finland), GBR (British in England and Scotland), IBS (Iberian population in Spain) and TSI (Toscani in Italia)) at the standard of R2≥0.1 online (https://asia.ensembl.org/Homo_sapiens/Tools/). The calculation of LD was conducted in the same chromosome, and the one that had the minimal P-value was reserved when two or more SNP is LD.
The MR study requires that IVs with known pleiotropy should be eliminated.Citation33 In the context of adiponectin and T2DM or glucose homeostasis relationship, obesity-related traits is most likely a significant confounder.Citation34–Citation38 Then, the pleiotropy of 18 remaining candidate IVs (Table S2) was analyzed online (PhenoScanner V2: http://www.phenoscanner.medschl.cam.ac.uk/; GWAS Catalog: https://www.ebi.ac.uk/gwas/). We excluded 10 SNPs associated with obesity-related traits (Table S3) from the 18 SNPs associated with adiponectin. Lastly, eight valid SNPs were acquired (). And the summary data of glucose homeostasis were obtained from a meta-analysis of 21 GWASs (46 186European non-diabetic patients) (https://www.magicinvestigators.org/downloads/).Citation21 Summary data used in this study were freely accessible online and did not require ethical approval.
Figure 3 The flow chart of instrumental variables selection.
Notes: The 162 candidate variants that had genome-wide significant (P<5E-8) associations with adiponectin (P<5E-8) were from the ADIPOGen consortium.
Abbreviations: SNPs, single-nucleotide polymorphisms; LD, linkage disequilibrium.
Adiponectin and T2DM
Summary data of T2DM cannot match the six SNPs (rs12051272, rs1870843, rs16861209, rs266743, rs7615090, and rs998584) so that they needed proxies. Firstly, the proxy should exist between the summary data of exposure and outcome. Secondly, the proxy and the SNP that need proxy are in LD and has a larger Pearson’s correlation.Citation32 The proxies found were rs8047711, rs8046196, rs266719, rs2062632, and rs187868, respectively, except that rs998584 cannot find out proxy (Table S4). The process of valid IVs selection was shown in . The summary data of T2DM were from the meta-analysis of GWASs by combining 3 GWAS data sets: Diabetes Genetics Replication and Meta-analysis (DIAGRAM), Genetic Epidemiology Research on Aging (GERA), and the UK Biobank (UKBB) (62892 T2DM cases and 596 424 controls of European ancestry) (http://cnsgenomics.com/data.html).Citation39 Following the formula used previously,Citation18,Citation40 we estimated the phenotypic variance explained by a given SNP (R2). Eight IVs approximatively had R2 of 3% for T2DM and 4% for glucose homeostasis.Citation32
Statistical Analysis
Statistical Analyses for MR
There were five MR methods used in two-sample MR analyses: (1) Inverse variance weighting (IVW) is to execute an IVW meta-analysis to acquire the MR estimate, and the weight is the inverse of the variance of SNP-outcome effect.Citation10 When all genetic variants are valid IV, IVW is an effective method of analysis. However, even only one genetic variant is invalid, it will be biased. IVW estimates will remain biased even if there are an infinite number of IVs because all IVs would contribute to overall IVW estimate;Citation29 (2) MR Egger regression (MR-Egger) relaxes the IV2 assumption of “no horizontal pleiotropy” and returns unbiased causal estimate. The IV2 is violated by all SNPs but meets that the hypothesis of the horizontal pleiotropic effects is uncorrelated with the SNP-exposure effects (ie, INSIDE assumption).Citation29,Citation30,Citation41 If the pleiotropy of all IVs is associated with the same confounding, the InSIDE assumption will be violated;Citation29 (3) Weighted median (WM), whose effect estimate would gain by weighting the contribution of each SNP using the inverse variance of its association with outcome.Citation30 WM would acquire an unbiased causal estimate when half of the SNPs are valid IVs (ie, meeting the needs of three assumptions). The type I error rate of WM is lower than that of the IVW method. WM is also complementary to MR-Egger;Citation29 (4) Penalized weighted median (PWM), which is similar to WM. The accuracy of PWM is slightly worse than that of IVW but is marginally better in some cases. The method is consistent and more accurate than the MR-Egger method, with a standard error reduction of approximately 30%-50%;Citation29 (5) Mode-based estimate (MBE) based on the similarity of IVs’ causal effects, MBE clusters the SNPs into different groups and returns the causal effect estimation based on the cluster with the largest number of SNPs. If the SNPs within the maximum cluster are valid, the MBE returns an unbiased causal effect.Citation41 We managed the MR analyses utilizing R (version 3.5.3) with the R package “TwosampleMR”. Two-tail P<0.05 was considered statistically significant.
Heterogeneity and Sensitivity Tests
The heterogeneity test acts as an indicator of potential horizontal pleiotropy utilizing the Cochran’s Q test,Citation30,Citation42 and it was considered statistically significant (indicating no horizontal pleiotropy) with a P-value of > 0.1. The MR Egger intercept can be worked as the estimate of directional pleiotropy,Citation43 and the P-value <0.05 indicates SNPs with directional pleiotropy. Furthermore, a “leave-one-out” analysis was used to assess whether the causal estimate was driven by a single SNP that may have great pleiotropy by re-estimating the effect by sequentially dropping one SNP at a time.Citation30 Singe SNP analysis was used to value the contribution of the causal effect of each SNP. We also conducted data harmonization to prevent probable bias.Citation32
Power Calculation
We also evaluated the power for our MR analyses utilizing the statistics of the observational study using an online calculator tool mRnd (http://cnsgenomics.com/shiny/mRnd/) (Table S5).Citation44
Results
MR Results
Before removed the potential pleiotropic IVs, the four methods (IVW, WM, PWM, and MBE) showed a causal effect of adiponectin on FI ((odds ratio (OR) = 1.098, 95% confidence interval (95% CI): 1.038–1.162, P = 0.001; OR = 1.062, 95% CI: 1.001–1.128, P = 0.037; OR = 1.062, 95% CI: 1.002–1.125, P = 0.039; OR = 1.060, 95% CI: 1.001–1.123, P = 0.062; respectively) (). Meanwhile, There showed a causal effect of adiponectin on HOMA-β and HOMA-IR by the IVW method (OR = 1.048, 95% CI: 1.008–1.091, P = 0.020; OR = 1.089, 95% CI: 1.030–1.152, P = 0.003; respectively) and no causal effect existed among adiponectin and T2DM and FG (). After remove the ten pleiotropic IVs, there showed no causal effect among adiponectin and T2DM, HOMA-β, HOMA-IR, FG, whereas the results of IVW method showed a causal effect of adiponectin on FI (0R = 1.057; 95% CI: 1.004, 1.112; P = 0.034) ().
Table 1 The Results of MR Analysis of Adiponectin and T2DM, HOMA-B, HOMA-IR, FI, FG Before and After Removed the Pleiotropic SNPs
Heterogeneity and Sensitivity Tests
Before removed the ten pleiotropic SNPs, Cochran’s Q test (IVW method) and MR Egger intercept revealed showed certain heterogeneity and directional pleiotropy existed among adiponectin and T2DM, HOMA-IR, FI, and no heterogeneity and directional pleiotropy existed among adiponectin and HOMA-β, FG (). After removed the ten pleiotropic SNPs, Cochran’s Q test showed there were no heterogeneity (PMR-Egger = 0.858, PIVW = 0.919; PMR-Egger > 0.999, PIVW> 0.999; PMR-Egger = 0.998, PIVW = 0.999; P MR-Egger = 0.945, PIVW = 0.943; respectively) and directional pleiotropy (intercept < −0.001, P=0.930; intercept = −0.001, P = 0.803; intercept = −0.001, P = 0.799; intercept = −0.0005, P = 0.875, respectively) existed among adiponectin and HOMA-β, HOMA-IR, FI, FG, but showed the heterogeneity existed between adiponectin and T2DM (PMR-Egger = 0.041; PIVW = 0.065) (). For T2DM, not all SNP analyses were meaningless, (eg, rs182052, ), while “leave-one-out” analysis was symmetrical (); accordingly, excluding any SNP would not induce significant changes, namely, no obvious outliers existed. Singe SNP analyses were meaningless, that’s, no outliers (–), and “leave-one-out” analysis was symmetrical for HOMA-β, HOMA-IR, and FG (–, respectively), which were consistent with their sensitivity evaluation. For FI, four outliers were determined (rs17366568, rs1870843, rs7955516, 7615090; ), and the “leave-one-out” analysis showed the IVW causal association estimate was driven by a single SNP ().
Table 2 The Results of Cochran’s Heterogeneity Test and MR Egger Intercept of Adiponectin and T2DM, HOMA-B, HOMA-IR, FI, FG Before and After Removed the Pleiotropic SNPs
Figure 4 The forest plot of single SNP analysis and leave-one-out analysis depicting the relationship between adiponectin and T2DM with eight valid SNPs.
Notes: (A) The black point showed the causal effect estimate (beta coefficient) of adiponectin and T2DM utilizing a certain SNP, and the black line indicated the 95% CI of the estimate. The red point showed the causal effect estimate of adiponectin and T2DM with the eight valid SNPs using the Egger or IVW method, and the red lines indicated the 95% CI of the estimate. (B) Leave-one-out analysis depicted adiponectin-to-T2DM MR results (IVW method) by sequentially re-evaluating the causal estimate after discarding one IV at a time, which helped determine whether the overall effect was driven by one specific genetic variant. The black point was the causal effect estimate of adiponectin and T2DM after discarding a certain IV, and the black line indicated the 95% CI of estimate. The red point was the causal effect estimate of adiponectin and T2DM with the eight valid SNPs using the IVW methods, and the red line indicated the 95% CI of the estimate.
Abbreviations: SNPs, single-nucleotide polymorphisms; T2DM, type 2 diabetes mellitus; MR, Mendelian randomization; Egger, MR Egger regression; IVW, Inverse variance weighting; IV, instrumental variable; CI, confidence interval.
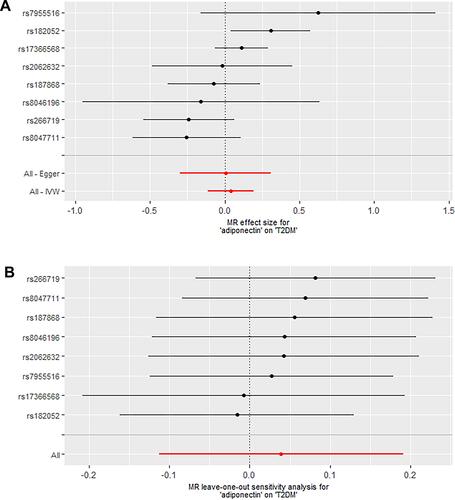
Figure 5 The forest plot of single SNP analysis depicting the relationship among adiponectin and HOMA-β, HOMA-IR, FG with eight valid SNPs.
Notes: (A) The black point showed the causal effect estimate (beta coefficient) of adiponectin and HOMA-β utilizing a certain SNP, and the black line indicated the 95% CI of the estimate. The red point showed the causal effect estimate of adiponectin and HOMA-β with the eight valid SNPs using the Egger or IVW method, and the red lines indicated the 95% CI of the estimate. (B) The black point showed the causal effect estimate (beta coefficient) of adiponectin and HOMA-IR utilizing a certain SNP, and the black line indicated the 95% CI of the estimate. The red point showed the causal effect estimate of adiponectin and HOMA-IR with the eight valid SNPs using the Egger or IVW method, and the red lines indicated the 95% CI of the estimate. (C) The black point showed the causal effect estimate (beta coefficient) of adiponectin and FG utilizing a certain SNP, and the black line indicated the 95% CI of the estimate. The red point showed the causal effect estimate of adiponectin and FG with the eight valid SNPs using the Egger or IVW method and the red lines indicated the 95% CI of the estimate.
Abbreviations: SNPs, single-nucleotide polymorphisms; Egger, MR Egger regression; IVW, Inverse variance weighting; HOMA-B, β-cell function index; HOMA-IR, insulin resistance; FG, fasting glucose; CI, confidence interval.
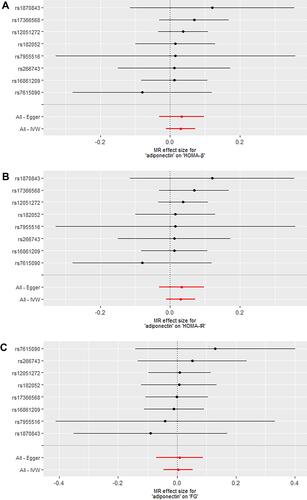
Figure 6 The forest plot of leave-one-out analysis depicting the relationship among adiponectin and HOMA-β, HOMA-IR, FG with eight valid SNPs.
Notes: Leave-one-out analysis depicted adiponectin-to-outcome MR results (IVW method) by sequentially re-evaluating the causal estimate after discarding one IV at a time, which helped determine whether the overall effect was driven by one specific genetic variant. (A) The black point was the causal effect estimate of adiponectin and HOMA-β after discarding a certain IV, and the black line indicated the 95% CI of the estimate. The red point was the causal effect estimate of adiponectin and HOMA-β with the eight valid SNPs using the IVW methods, and the red line indicated the 95% CI of the estimate. (B) The black point was the causal effect estimate of adiponectin and HOMA-IR after discarding a certain IV, and the black line indicated the 95% CI of estimate. The red point was the causal effect estimate of adiponectin and HOMA-IR with the eight valid SNPs using IVW methods, and the red line indicated the 95% CI of the estimate. (C) The black point was the causal effect estimate of adiponectin and FG after discarding a certain IV, and the black line indicated the 95% CI of estimate. The red point was the causal effect estimate of adiponectin and FG with the eight valid SNPs using IVW methods, and the red line indicated the 95% CI of the estimate.
Abbreviations: SNPs, single-nucleotide polymorphisms; Egger, MR Egger regression; IVW, Inverse variance weighting; HOMA-B, β-cell function index; HOMA-IR, insulin resistance; FG, fasting glucose; CI, confidence interval.
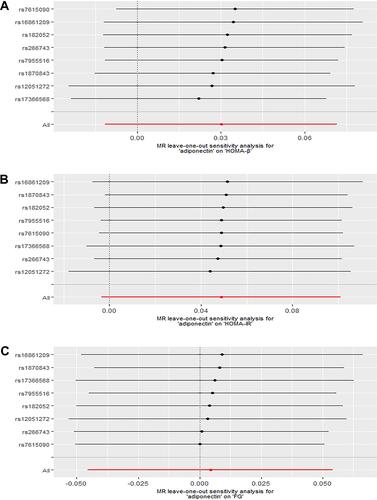
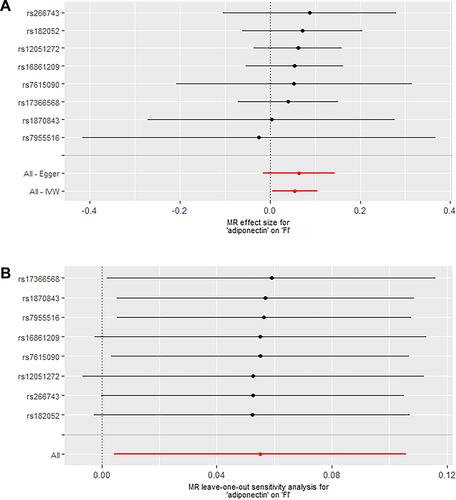
Figure 7 The forest plot of single SNP analysis and leave-one-out analysis depicting the relationship between adiponectin and FI with eight valid SNPs.
Notes: (A) The black point showed the causal effect estimate (beta coefficient) of adiponectin and FI utilizing a certain SNP, and the black line indicated the 95% CI of the estimate. The red point showed the causal effect estimate of adiponectin and FI with the eight valid SNPs using the Egger or IVW method, and the red lines indicated the 95% CI of the estimate. (B) Leave-one-out analysis depicted adiponectin-to-FI MR results (IVW method) by sequentially re-evaluating the causal estimate after discarding one IV at a time, which helped determine whether the overall effect was driven by one specific genetic variant. The black point was the causal effect estimate of adiponectin and FI after discarding a certain IV, and the black line indicated the 95% CI of the estimate. The red point was the causal effect estimate of adiponectin and FI with the eight valid SNPs using the IVW methods, and the red line indicated the 95% CI of the estimate.
Abbreviations: SNPs, single-nucleotide polymorphisms; Egger, MR Egger regression; IVW, Inverse variance weighting; FI, fasting insulin; CI, confidence interval.
Discussion
The relationship between adiponectin and HOMA-IR is controversial. People with extreme HOMA-IR have excessively high plasma adiponectin levels. Indeed, the inhibitory effect of hyperinsulinemia on plasma adiponectin occurred in females.Citation45–Citation48 Insulin infusion reduced plasma adiponectin in healthy volunteersCitation49 but elevated in patients with type 1 diabetes mellitus.Citation50 However, the hyperinsulinemia caused by HOMA-IR resulted in low plasma adiponectin levels rather than reverse using European summary data.Citation51 Hence, an MR study regarding HOMA-IR as the exposure and adiponectin as an outcome should be performed next.
In the present research, the association among adiponectin and HOMA-β, HOMA-IR, FI was causal before the elimination of pleiotropic SNPs; meanwhile, the Cochran’s Q test and MR Egger regression revealed showed absolute heterogeneity and directional pleiotropy existed them. The results of five MR methods showed no causal effect, heterogeneity, and directional pleiotropy existed among adiponectin and HOMA-β, HOMA-IR, FI after the elimination of pleiotropic SNPs, suggesting that causal effect before was likely mediated by pleiotropy. No causal effect, heterogeneity, and directional pleiotropy existed between adiponectin and FG before and after removing the pleiotropic SNPs, and leave-one-out analysis was symmetrical (), which indicated obesity maybe is not the confounding factor. No causal effect existed between adiponectin and T2DM before and after removing the pleiotropic SNPs, but the heterogeneity still existed after removed the ten pleiotropic SNPs, which is more likely at the price of excessive proxies.
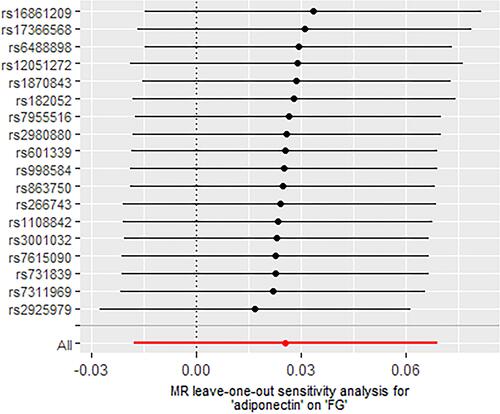
Figure 8 The forest plot of leave-one-out analysis depicting the relationship between adiponectin and FG without removing the pleiotropic IVs.
Notes: Leave-one-out analysis depicted adiponectin-to-FG MR results (IVW method) by sequentially re-evaluating the causal estimate after discarding one IV at a time, which helped determine whether the overall effect was driven by one specific genetic variant. The black point was the causal effect estimate of adiponectin and FG after discarding one IV, and the black line indicated the 95% CI of the estimate. The red point was the causal effect estimate of adiponectin and FG with the 18 valid SNPs using the IVW methods, and the red lines indicated the 95% CI of the estimate.
Abbreviations: SNPs, single-nucleotide polymorphisms; Egger, MR Egger regression; IVW, Inverse variance weighting; FG, fasting glucose; CI, confidence interval.
Our research did not provide evidence that decreasing circulating adiponectin levels, which were regulated by genetic factors, increased the risk of T2DM or glucose homeostasis. No causal effects were determined among adiponectin and T2DM, HOMA-β, HOMA-IR, FI with the power of 100%, 100%, 100%, 84%, respectively (Table S5), which was consistent with the recent study.Citation52 Any pharmaceutical and lifestyle interventions designed to alter adiponectin levels would not improve glucose homeostasis or prevent T2DM.Citation51 The inconsistency of the estimates from different methods indicated that the genome-wide significant variants were not all valid IVs, and the causal conclusion based on these variants would be unreliable.Citation53 Nevertheless, our results were consistent, and our IVs were valid. The findings suggested that circulating adiponectin concentration was more likely to be an epiphenomenon in the context of T2DM and glucose homeostasis than a key determinant, which was also consistent with the previous study.Citation54
Our study exhibits several strengths. Firstly, we had larger samples than similar studies before. Secondly, we considered ethnicity into account, ie, the summary data of adiponectin, T2DM, and glucose homeostasis all came from the same ethnicity (European). The calculation of LD was also conducted on a special website using the European descent of 1000 Genomes Project. Furthermore, to the best of our knowledge, no existing MR analyses have investigated the causal relationship between adiponectin and HOMA-β, FG, FI. Our research is the first to investigate the causal relationship between them by the MR approach and a variety of sensitivity analyses. Lastly, the numbers of IVs were comprehensive, including liberal and conservative SNPs. Conservative SNPs were less likely to go against the MR assumption that the instrument should not affect the outcome other than the exposure of interest.
However, our research has its shortcomings. First, adiponectin exists as high-, medium-, and low-molecular-weight isoforms in this research, namely total circulating adiponectin, which may have distinct functions. Second, we cannot account for complex feedback loops and rule out the possibility that the causal-free estimates among adiponectin and T2DM, glucose homeostasis were caused by age or sex. Although we did our best to manage the pleiotropic or confounding factors, the residual pleiotropic or confounding factors may remain.Citation27 Moreover, only eight SNPs of the 162 SNPs significantly associated with adiponectin were used as IVs, although limiting the numbers of IVs used in the MR study contributes to relieving the biases from weak instruments. Further, the MR analysis of adiponectin and T2DM was conducted with excessive proxies, which may produce unreliable results.Citation55 Lastly, most IVs used in the MR research do not significantly associate with adiponectin in Asians, which is probable a lack of the related research, so performing further study on adiponectin in Asians is needed. And the subjects referred to in our study are European ancestry only, which helps minimize the likelihood of ethnicity bias, so performing MR analyses in other populations is expected in the future.
Conclusion
In all, our MR study revealed that adiponectin had no causal effect on T2DM and glucose homeostasis and the associations among them in observational studies may be due to confounding factors.
Acknowledgments
We express our gratitude to the ADIPOGen and MAGIC consortia and Dr.Angli Xue for providing the summary data. We are incredibly thankful to our teacher, who taught us about the Mendelian randomization, and our senior schoolmates with whom we learned considerably about mendelian randomization.
Disclosure
The authors report no conflicts of interest in this work.
Additional information
Funding
References
- Miguel-Escalada I, Bonàs-Guarch S, Cebola I, et al. Human pancreatic islet three-dimensional chromatin architecture provides insights into the genetics of type 2 diabetes. Nat Genet. 2019;51(7):1137–1148. doi:10.1038/s41588-019-0457-0
- Long T, Wang J, Han X, et al. Association between resting heart rate and incident diabetes risk: a Mendelian randomization study. Acta Diabetol. 2019;56:1037–1044. doi:10.1007/s00592-019-01344-3
- Zhou B, Lu Y, Hajifathalian K, et al. Worldwide trends in diabetes since 1980: a pooled analysis of 751 population-based studies with 4.4 million participants. Lancet (London, England). 2016;387(10027):1513–1530. doi:10.1016/S0140-6736(16)00618-8
- Xu Y, Wang L, He J, et al. Prevalence and control of diabetes in Chinese adults. JAMA. 2013;310(9):948–959. doi:10.1001/jama.2013.168118
- Li J, Ni J, Wu Y, et al. Sex differences in the prevalence, awareness, treatment, and control of diabetes mellitus among adults aged 45 years and older in rural areas of Northern China: a cross-sectional, population-based study. Front Endocrinol (Lausanne). 2019;10:147. doi:10.3389/fendo.2019.00147
- Juma PA, Mohamed SF, Matanje Mwagomba BL, et al. Non-communicable disease prevention policy process in five African countries authors. BMC Public Health. 2018;18(Suppl 1):961. doi:10.1186/s12889-018-5825-7
- Younossi ZM, Golabi P, de Avila L, et al. The global epidemiology of NAFLD and NASH in Patients with type 2 diabetes: a systematic review and meta-analysis. J Hepatol. 2019;71:793–801. doi:10.1016/j.jhep.2019.06.021
- Zheng Y, Ley SH, Hu FB. Global aetiology and epidemiology of type 2 diabetes mellitus and its complications. Nat Rev Endocrinol. 2018;14(2):88–98. doi:10.1038/nrendo.2017.151
- Willemsen G, Ward KJ, Bell CG, et al. The concordance and heritability of type 2 diabetes in 34,166 twin pairs from international twin registers: the discordant twin (DISCOTWIN) consortium. Twin Res Hum Genet. 2015;18(6):762–771. doi:10.1017/thg.2015.83
- Dastani Z, Hivert MF, Timpson N, et al. Novel loci for adiponectin levels and their influence on type 2 diabetes and metabolic traits: a multi-ethnic meta-analysis of 45,891 individuals. PLoS Genet. 2012;8(3):e1002607.
- Yeung SLA, Schooling CM. Adiponectin and coronary artery disease risk: a bi-directional Mendelian randomization study. Int J Cardiol. 2018;268:222–226. doi:10.1016/j.ijcard.2018.03.132
- Jee SH, Sull JW, Lee J-E, et al. Adiponectin concentrations: a genome-wide association study. Am J Hum Genet. 2010;87(4):545–552. doi:10.1016/j.ajhg.2010.09.004
- Wu Y, Li Y, Lange EM, et al. Genome-wide association study for adiponectin levels in Filipino women identifies CDH13 and a novel uncommon haplotype at KNG1-ADIPOQ. Hum Mol Genet. 2010;19(24):4955–4964. doi:10.1093/hmg/ddq423
- Chung C-M, Lin T-H, Chen J-W, et al. A genome-wide association study reveals a quantitative trait locus of adiponectin on CDH13 that predicts cardiometabolic outcomes. Diabetes. 2011;60(9):2417–2423. doi:10.2337/db10-1321
- Wu Y, Gao H, Li H, et al. A meta-analysis of genome-wide association studies for adiponectin levels in East Asians identifies a novel locus near WDR11-FGFR2. Hum Mol Genet. 2014;23(4):1108–1119. doi:10.1093/hmg/ddt488
- Dastani Z, Johnson T, Kronenberg F, et al. The shared allelic architecture of adiponectin levels and coronary artery disease. Atherosclerosis. 2013;229(1):145–148. doi:10.1016/j.atherosclerosis.2013.03.034
- Yamauchi T, Nio Y, Maki T, et al. Targeted disruption of AdipoR1 and AdipoR2 causes abrogation of adiponectin binding and metabolic actions. Nat Med. 2007;13(3):332–339. doi:10.1038/nm1557
- Borges MC, Oliveira IO, Freitas DF, et al. Obesity-induced hypoadiponectinaemia: the opposite influences of central and peripheral fat compartments. Int J Epidemiol. 2017;46(6):2044–2055. doi:10.1093/ije/dyx022
- Zhuang H, Han J, Cheng L, Liu SL. A positive causal influence of IL-18 levels on the risk of T2DM: a mendelian randomization study. Front Genet. 2019;10:295. doi:10.3389/fgene.2019.00295
- Swerdlow DI. Mendelian randomization and type 2 diabetes. Cardiovasc Drugs Ther. 2016;30(1):51–57. doi:10.1007/s10557-016-6638-5
- Dupuis J, Langenberg C, Prokopenko I, et al. New genetic loci implicated in fasting glucose homeostasis and their impact on type 2 diabetes risk. Nat Genet. 2010;42(2):105–116. doi:10.1038/ng.520
- Weber KS, Strassburger K, Pacini G, et al. Circulating adiponectin concentration is inversely associated with glucose tolerance and insulin secretion in people with newly diagnosed diabetes. Diabet Med. 2017;34(2):239–244. doi:10.1111/dme.13278
- Mente A, Meyre D, Lanktree MB, et al. Causal relationship between adiponectin and metabolic traits: a Mendelian randomization study in a multiethnic population. PLoS One. 2013;8(6):e66808. doi:10.1371/journal.pone.0066808
- Kashiwagi R, Yamada Y, Ito Y, et al. Increase in adiponectin level prevents the development of type 2 diabetes in Japanese men with low adiponectin levels. J Endocr Soc. 2018;2(7):753–764. doi:10.1210/js.2018-00033
- White J, Swerdlow DI, Preiss D, et al. Association of lipid fractions with risks for coronary artery disease and diabetes. JAMA Cardiol. 2016;1(6):692–699. doi:10.1001/jamacardio.2016.1884
- Sattar N, Preiss D, Murray HM, et al. Statins and risk of incident diabetes: a collaborative meta-analysis of randomised statin trials. Lancet (London, England). 2010;375(9716):735–742. doi:10.1016/S0140-6736(09)61965-6
- Fall T, Xie W, Poon W, et al. Using genetic variants to assess the relationship between circulating lipids and type 2 diabetes. Diabetes. 2015;64(7):2676–2684. doi:10.2337/db14-1710
- Warren LL, Li L, Nelson MR, et al. Deep resequencing unveils genetic architecture of ADIPOQ and identifies a novel low-frequency variant strongly associated with adiponectin variation. Diabetes. 2012;61(5):1297–1301. doi:10.2337/db11-0985
- Bowden J, Davey Smith G, Haycock PC, Burgess S. Consistent estimation in mendelian randomization with some invalid instruments using a weighted median estimator. Genet Epidemiol. 2016;40(4):304–314. doi:10.1002/gepi.21965
- Hemani G, Zheng J, Elsworth B, et al. The MR-Base platform supports systematic causal inference across the human phenome. eLife. 2018;7. doi:10.7554/eLife.34408
- Ortega Moreno L, Copetti M, Fontana A, et al. Evidence of a causal relationship between high serum adiponectin levels and increased cardiovascular mortality rate in patients with type 2 diabetes. Cardiovasc Diabetol. 2016;15:17. doi:10.1186/s12933-016-0339-z
- Hartwig FP, Davies NM, Hemani G, Davey Smith G. Two-sample Mendelian randomization: avoiding the downsides of a powerful, widely applicable but potentially fallible technique. Int J Epidemiol. 2016;45(6):1717–1726. doi:10.1093/ije/dyx028
- Ahmad OS, Morris JA, Mujammami M, et al. A Mendelian randomization study of the effect of type-2 diabetes on coronary heart disease. Nat Commun. 2015;6:7060. doi:10.1038/ncomms8060
- Venkatrao M, Nagarathna R, Patil SS, et al. A composite of BMI and waist circumference may be a better obesity metric in Indians with high risk for type 2 diabetes: an analysis of NMB-2017, a nationwide cross-sectional study. Diabetes Res Clin Pract. 2020;161:108037. doi:10.1016/j.diabres.2020.108037
- Bais S, Patel NJ. Role of adiponectin and its target receptors to control deposition of fat in obesity related disorders. J Obes Med. 2019;16.
- Lee S, Lacy ME, Jankowich M, Correa A, Wu W-C. Association between obesity phenotypes of insulin resistance and risk of type 2 diabetes in African Americans: the Jackson Heart Study. J Clin Transl Endocrinol. 2019;19:100210. doi:10.1016/j.jcte.2019.100210
- Elizalde-Barrera CI, Rubio-Guerra AF, Lozano-Nuevo JJ, Olvera-Gomez JL. Triglycerides and waist to height ratio are more accurate than visceral adiposity and body adiposity index to predict impaired fasting glucose. Diabetes Res Clin Pract. 2019;153:49–54. doi:10.1016/j.diabres.2019.05.019
- Davidsson L, Alkhabbaz E, Vijayan V, et al. Intermediate hyperglycaemia, insulin resistance and metabolic syndrome among obese Arab children (12-17 years old) in Kuwait. Prim Care Diabetes. 2020. doi:10.1016/j.pcd.2020.02.001
- Xue A, Wu Y, Zhu Z, et al. Genome-wide association analyses identify 143 risk variants and putative regulatory mechanisms for type 2 diabetes. Nat Commun. 2018;9(1):2941. doi:10.1038/s41467-018-04951-w
- Shim H, Chasman DI, Smith JD, et al. A multivariate genome-wide association analysis of 10 LDL subfractions, and their response to statin treatment, in 1868 Caucasians. PLoS One. 2015;10(4):e0120758. doi:10.1371/journal.pone.0120758
- Hartwig FP, Davey Smith G, Bowden J. Robust inference in summary data Mendelian randomization via the zero modal pleiotropy assumption. Int J Epidemiol. 2017;46(6):1985–1998. doi:10.1093/ije/dyx102
- Bowden J, Del Greco MF, Minelli C, et al. A framework for the investigation of pleiotropy in two-sample summary data Mendelian randomization. Stat Med. 2017;36(11):1783–1802. doi:10.1002/sim.7221
- Bowden J, Davey Smith G, Burgess S. Mendelian randomization with invalid instruments: effect estimation and bias detection through Egger regression. Int J Epidemiol. 2015;44(2):512–525. doi:10.1093/ije/dyv080
- Brion MJ, Shakhbazov K, Visscher PM. Calculating statistical power in Mendelian randomization studies. Int J Epidemiol. 2013;42(5):1497–1501. doi:10.1093/ije/dyt179
- Liu G, Ding M, Chiuve SE, et al. Plasma levels of fatty acid-binding protein 4, retinol-binding protein 4, high-molecular-weight adiponectin, and cardiovascular mortality among men with type 2 diabetes: a 22-year prospective study. Arterioscler Thromb Vasc Biol. 2016;36(11):2259–2267. doi:10.1161/ATVBAHA.116.308320
- Antuna-Puente B, Boutet E, Vigouroux C, et al. Higher adiponectin levels in patients with Berardinelli-Seip congenital lipodystrophy due to seipin as compared with 1-acylglycerol-3-phosphate-o-acyltransferase-2 deficiency. J Clin Endocrinol Metab. 2010;95(3):1463–1468. doi:10.1210/jc.2009-1824
- Consitt LA, Saxena G, Schaefer M. Sex-dependent reductions in high molecular weight adiponectin during acute hyperinsulinemia are prevented with endurance training in older females. Clin Endocrinol (Oxf). 2018;88(5):673–682. doi:10.1111/cen.13563
- Lee JY, Yang JW, Han BG, Choi SO, Kim JS. Adiponectin for the treatment of diabetic nephropathy. Korean J Intern Med. 2019;34(3):480–491. doi:10.3904/kjim.2019.109
- Basu R, Pajvani UB, Rizza RA, Scherer PE. Selective downregulation of the high molecular weight form of adiponectin in hyperinsulinemia and in type 2 diabetes: differential regulation from nondiabetic subjects. Diabetes. 2007;56(8):2174–2177. doi:10.2337/db07-0185
- Pereira RI, Snell-Bergeon JK, Erickson C, et al. Adiponectin dysregulation and insulin resistance in type 1 diabetes. J Clin Endocrinol Metab. 2012;97(4):E642–E647. doi:10.1210/jc.2011-2542
- Yaghootkar H, Lamina C, Scott RA et al,. Mendelian randomization studies do not support a causal role for reduced circulating adiponectin levels in insulin resistance and type 2 diabetes. Diabetes. 2013;62(10):3589–3598.
- Yaghootkar H, Lamina C, Scott RA, et al. Mendelian randomization studies do not support a causal role for reduced circulating adiponectin levels in insulin resistance and type 2 diabetes. Diabetes. 2013;62(10):3589–3598. doi:10.2337/db13-0128
- Burgess S, Bowden J, Fall T, Ingelsson E, Thompson SG. Sensitivity analyses for robust causal inference from mendelian randomization analyses with multiple genetic variants. Epidemiology. 2017;28(1):30–42. doi:10.1097/EDE.0000000000000559
- Borges MC, Barros AJD, Ferreira DLS, et al. Metabolic profiling of adiponectin levels in adults: mendelian randomization analysis. Circ Cardiovasc Genet. 2017;10:6. doi:10.1161/CIRCGENETICS.117.001837
- Luo Q, Wen Z, Li Y, et al. Assessment causality in associations between serum uric acid and risk of schizophrenia: a two-sample bidirectional mendelian randomization study. Clin Epidemiol. 2020;12:223–233.