
Abstract
Purpose
Carcinoembryonic antigen (CEA) and carbohydrate antigen 19-9 (CA19-9) are tumor-associated antigens. An increased serum level of CEA and CA19-9 separately has been reported in diabetes. In this study, we examined the composite effect of elevated serum levels of both CEA and CA19-9 on subjects with type 2 diabetes and prediabetes.
Patients and Methods
A total of 3568 adults who attended a health examination were enrolled into this cross-sectional study. Subjects were grouped into four groups according to the median serum CEA and CA19-9 levels.
Results
Subjects with high CEA and high CA19-9 levels had the highest proportions of diabetes (43.9%) and prediabetes (33.04%). There was a statistically significant trend in the proportion of diabetes across the four groups (P < 0.001). Multivariable logistic regression analysis revealed higher risks of type 2 diabetes in subjects with high CEA and low CA19-9 levels (odds ratio [OR] = 2.10, 95% confidence interval [CI]: 1.39–3.18, P < 0.001) and in those with high CA19-9 and low CEA levels (OR = 2.18, 95% CI: 1.42–3.34, P < 0.001) than in those with low CEA and low CA19-9 levels; among these four groups, the highest risk of type 2 diabetes was observed in subjects with high CEA and high CA19-9 levels (OR = 2.65, 95% CI: 1.81–3.88, P < 0.001). The risk of prediabetes was significantly higher only in subjects with high CEA and high CA19-9 levels compared to those with low CEA and low CA19-9 levels (OR = 1.32, 95% CI: 1.08–1.61, P = 0.006).
Conclusion
CEA and CA19-9 had a synergistic ability to increase the risk of type 2 diabetes and prediabetes.
Keywords:
Introduction
Diabetes mellitus is one of the major causes of reduced life expectancy worldwide.Citation1 The global prevalence of diabetes among adults was estimated to be 8.8% in 2017, and this number is expected to increase to 9.9% by 2045.Citation2 Type 2 diabetes, which accounts for over 90% of all patients with diabetes, may remain undiagnosed for years, leading to unchecked progress of complications because of gradual, asymptomatic onset.Citation3,Citation4 Almost half of all adults with diabetes are not diagnosed globally, and the proportion of undiagnosed diabetes is as high as 30–50% even in high-income countries.Citation3,Citation5 Screening for prediabetes and type 2 diabetes using an informal assessment of risk factors or validated tools in asymptomatic adults is recommended according to the available guidelines.Citation6,Citation7
Tumor markers are used clinically for cancer screening and monitoring. Generally, carbohydrate antigen 19–9 (CA19-9) and carcinoembryonic antigen (CEA) have been recommended to monitor gastrointestinal cancers.Citation8 Furthermore, elevation of these two tumor markers was also observed in a number of benign conditions, including aging,Citation9 hypothyroidism,Citation10 inflammation,Citation11 chronic kidney disease (CKD),Citation12 pancreatitis,Citation13 pulmonary diseases,Citation14 cigarette smoking,Citation15 and hepatobiliary system diseases.Citation16 CEA and CA19-9 have similar features in clinical and biological studies, including both being expressed in gastrointestinal tumors.Citation17,Citation18 According to in vitro studies, CEA and CA19-9 both function as intracellular adhesion molecules.Citation19,Citation20 In the clinic, the combination of CEA and CA19-9 has a higher diagnostic efficiency than either marker alone in esophageal and gastric cancer,Citation21 and is useful for predicting survival after potentially curative surgery in patients with colorectal cancer.Citation22
Numerous studies have reported that circulating CA19-9 is elevated during hyperglycemia in patients with diabetes.Citation23–Citation32 CA19-9 levels were revealed to be associated with hemoglobin A1c (HbA1c) and fasting blood glucose and to be decreased after improvement of glycemic control.Citation28,Citation33 The mechanism of elevated serum CA19-9 in diabetic patients remains unclear. However, some studies reported associations between CA19-9 elevation, β-cell function and insulin resistance.Citation27,Citation31,Citation32 In addition, circulating CEA has been reported to increase in patients with diabetesCitation33–Citation38 and was positively associated with HbA1c.Citation38,Citation39 CEA levels are also reported to be associated with insulin resistance.Citation40
An increased risk of diabetes was reported in patients with pancreatic cancer, accompanied by high CEA and CA19-9 levels.Citation41 However, the effects of combined CEA and CA19-9 levels on abnormal glucose regulation have not been reported in subjects without established malignancy. We therefore hypothesized that there was a synergistic association of CEA and CA19-9 on abnormal glucose regulation.
Patients and Methods
Patients
The aim of this cross-sectional study was to investigate the synergistic association of CEA and CA19-9 on type 2 diabetes and prediabetes. We retrospectively collected the medical information of subjects who had undergone health examinations at the Health Management Center in Taichung Veterans General Hospital between March 2009 and February 2018. Several health examination programs were offered, and some of the programs included the detection of CEA and CA19-9.
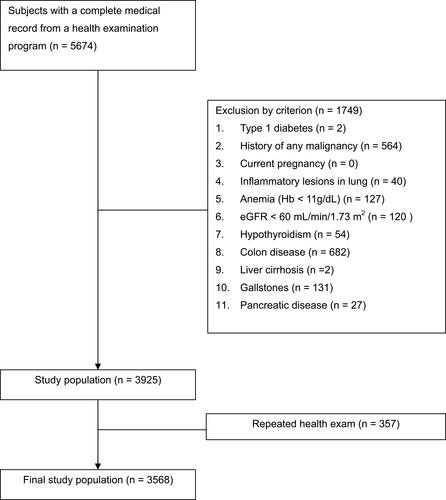
The inclusion criteria were adults who had complete data for CA19-9 and CEA in the health examination program. The exclusion criteria were (1) type 1 diabetes, (2) a history of any malignancy, (3) current pregnancy, (4) current inflammatory lesions in the lung, (5) anemia with hemoglobin (Hb) < 11 g/dL, (6) CKD with an estimated glomerular filtration rate (eGFR) < 60 mL/min/1.73 m2, (7) a history of hypothyroidism, (8) a history of colon diseases, including inflammatory bowel disease and colonic polyps, (9) a history of liver cirrhosis, (10) a history of gallstones, and (11) a history of pancreatic disease. Only the data for the first program were recorded for subjects who had undergone repeated health examinations (). Anonymous demographic characteristics and laboratory data were obtained from the Health Management Center after delinking the identification code. The study protocol was approved by the Institutional Review Board of Taichung Veterans General Hospital in Taichung, Taiwan, with a waiver for obtaining informed consent.
Figure 1 Flow diagram of the enrollment of study subjects.
Abbreviations: Hb, hemoglobin; eGFR, estimated glomerular filtration rate.
Assessment
Data obtained from medical records included age, sex, height, body weight, systolic blood pressure (SBP), diastolic blood pressure (DBP), white blood cell count (WBC) with the percentage of neutrophils, Hb, HbA1c, plasma glucose, serum levels of CEA, CA19-9, alanine aminotransferase (ALT), uric acid, creatinine, calcium, total cholesterol, high-density lipoprotein (HDL) cholesterol, triglycerides, total protein, albumin, and total bilirubin.
Blood samples for biochemical analyses were collected in the morning after an overnight fast. Glucose was detected using an oxidase‒peroxidase method (Wako Diagnostics, Tokyo, Japan). HbA1c was measured using cation-exchange high-performance liquid chromatography (National Glycohemoglobin Standardization Program certificated; G8, TOSOH, Tokyo, Japan). Hb and WBC with differential counts were detected using a commercial autoanalyzer (Sysmex SE-9000, Kobe, Japan). Biochemical analyses were performed using a photometric enzymatic method with a chemical analyzer (Hitachi 7600, Tokyo, Japan). CEA and CA19-9 were detected using an Elecsys 2010 (Roche Diagnostics, Penzberg, Germany) in an electrochemiluminescence immunoassay.
Body mass index (BMI) was calculated as weight (kg)/(height [m])2, and eGFR was calculated as 186 × (serum creatinine)−1.154 × (age)−0.203 (× 0.742 if female).Citation42 The absolute neutrophil count (ANC) was calculated as WBC × neutrophil percentage. Smokers were defined as subjects with a self-reported smoking history. Diabetes was defined according to a history of type 2 diabetes or use of antidiabetic drugs, an HbA1c level ≥ 6.5%, or a fasting glucose level ≥ 126 mg/dL in this health examination. Normal glucose was defined as no history of diabetes, HbA1c ≤ 5.6%, and glucose < 100 mg/dL in this health examination. Prediabetes was defined as an HbA1c between 5.7 and 6.4% or glucose between 100 and 125 mg/dL in subjects who did not meet the criteria for diabetes.Citation7 Low HDL cholesterol was defined as an HDL < 40 mg/dL in men or < 50 mg/dL in women.Citation43
Statistical Analysis
All continuous data are presented as the median (interquartile range). The categorical data are presented as the number and percentage. A Mann–Whitney U-test was conducted to detect significant differences in continuous variables between groups. Chi-square tests were conducted to detect differences in categorical variables. The correlation coefficient (ρ) and statistical significance of relationships were determined using Spearman correlation. Backward multivariate logistic regression was used to analyze the factors associated with type 2 diabetes and prediabetes. Statistical analysis was performed using SPSS version 22.0 software (IBM Corp., Armonk, NY, USA).
Results
A total of 3568 subjects were enrolled in the study, and their characteristics are shown in . To understand the influences of CEA and CA-199, we also showed the characteristics of all subjects grouped by a median CEA of 1.75 ng/mL and a median CA19-9 of 9.91 U/mL. A significantly higher proportion of diabetes was found in subjects with a high CEA level than in those with a low CEA level (12.83% vs 6.42%, P < 0.001), and a significantly higher proportion of prediabetes was found in subjects with a high CEA level than in those with a low CEA level (48.75% vs 41.30%, P < 0.001). Similarly, a significantly higher proportion of diabetes was found in subjects with a high CA19-9 level than in those with a low CA19-9 level (12.16% vs 7.12%, P < 0.001), and a significantly higher proportion of prediabetes was found in subjects with a high CA19-9 level than in those with a low CA19-9 level (46.39% vs 43.69%, P < 0.001).
Table 1 Clinical Characteristics of All Subjects, Grouped by a Median CEA of 1.75 Ng/mL and Grouped Based on a Median CA19-9 of 9.91 U/mL
A significantly higher glucose level (89 [84–98] vs 88 [82–94] mg/dL, P < 0.001) and a higher HbA1c level (5.7 [5.5–6.0] vs 5.6 [5.4–5.9] %, P < 0.001) were observed in subjects in the high CEA group than in the low CEA group; a significantly higher glucose level (89 [83–98] vs 88 [82–94] mg/dL, P < 0.001) and a higher HbA1c level (5.7 [5.5–6.0] vs 5.6 [5.4–5.9] %, P < 0.001) were observed in subjects in the high CA19-9 group than in the low CA19-9 group.
Furthermore, subjects in the high CEA group were older (P < 0.001) and had higher proportions of males (P < 0.001) and smokers (P < 0.001), a higher BMI (P < 0.001), a higher SBP (P < 0.001) and a higher DBP (P < 0.001), a higher Hb (P < 0.001), higher total cholesterol (P = 0.006), higher triglycerides (P < 0.001), higher ALT (P < 0.001), higher bilirubin (P < 0.001), higher calcium (P < 0.001), higher uric acid (P < 0.001), lower HDL cholesterol (P < 0.001), lower total protein (P < 0.001), and lower eGFR (P < 0.001) than those in the low CEA group. There was no significant difference in ANC or serum albumin between these two groups.
Subjects in the high CA19-9 group were older (P < 0.001) and had lower proportions of males (P < 0.001) and smokers (P = 0.034), a lower BMI (P = 0.004), lower Hb (P = 0.014), higher total cholesterol (P = 0.032), higher HDL cholesterol (P = 0.008), lower uric acid (P < 0.001), and lower serum albumin (P = 0.012) than those in the low CA19-9 group. There was no significant difference in SBP, DBP, ANC, triglycerides, ALT, total protein, total bilirubin, calcium, or GFR between these two groups. It is notable that subjects in the high CEA group also had a higher CA-199 level (11.63 [7.21–18.63] vs 8.93 [6.66–12.14] U/mL, P < 0.001) and vice versa (P < 0.001). There was a significant positive correlation between CEA and CA19-9 levels (ρ = 0.21, P < 0.001).
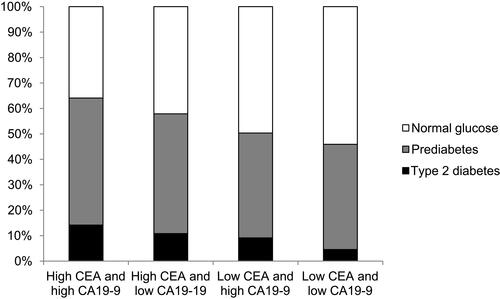
To understand the synergistic association of CEA and CA19-9, we grouped all the subjects into four groups according to the medians of CEA and CA19-9: the high CEA with high CA19-9, high CEA with low CA19-9, low CEA with high CA19-9, and low CEA with low CA19-9 groups. The proportions of diabetes, prediabetes, and normal glucose among these four groups are shown in . There were statistically significant differences in the proportions of diabetes, prediabetes and normal glucose across these four groups (P values for trend were less than 0.001 for the proportions of diabetes, prediabetes and normal glucose). The high CEA with high CA19-9 group had the highest prevalence of diabetes, and there was a statistically significant trend for the prevalence of diabetes across these four groups (14.2%, 10.8%, 9.2%, and 4.6%, respectively; P < 0.001). In the subjects without diabetes, the high CEA with high CA19-9 group had the highest proportion of prediabetes and there was a statistically significant trend for the prevalence of prediabetes across these four groups (58.2%, 52.8%, 45.3%, and 43.3%, respectively; P < 0.001).
Figure 2 Proportions of type 2 diabetes, prediabetes and normal glucose among the four groups categorized according to median serum carcinoembryonic antigen (CEA) and carbohydrate antigen 19–9 (CA19-9) levels; P values for trend < 0.001 for the proportions of diabetes, prediabetes and normal glucose.
Using multivariate logistic regression analyses (), subjects with high CEA and low CA19-9 had a significantly higher risk of type 2 diabetes (odds ratio [OR] = 2.10, 95% confidence interval [CI]: 1.39–3.18, P < 0.001) than those with low CEA and low CA19-9. Similarly, subjects with high CA19-9 levels and low CEA levels had a significantly higher risk of type 2 diabetes (OR = 2.18, 95% CI: 1.42–3.34, P < 0.001) than those with low CEA levels and low CA19-9 levels. Furthermore, high CEA and high CA19-9 had a synergistic association, as demonstrated by the highest risk of type 2 diabetes (OR = 2.65, 95% CI: 1.81–3.88, P < 0.001) among the groups. On the other hand, subjects with high CEA and low CA19-9, or high CA19-9 and low CEA, did not have a significantly different risk of prediabetes compared with those with low CEA and low CA19-9 (OR = 1.19, 95% CI: 0.96–1.48, P = 0.115; OR = 1.12, 95% CI: 0.90–1.39, P = 0.316, respectively). However, subjects with high CEA and high CA19-9 had a significantly higher risk of prediabetes than those with low CEA and low CA19-9 (OR = 1.32, 95% CI: 1.08–1.61, P = 0.006).
Table 2 Backward Multivariate Logistic Regression Analysis Showing Odds Ratios for Diabetes and Prediabetes Between Subjects with Different CEA and CA19-9 Levels
Discussion
Our main finding in the present study is that subjects with high serum levels of both CEA and CA19-9 showed an increased risk of type 2 diabetes, compared to the increased level of just CEA alone or high CA19-9 alone. To the best of our knowledge, it is the first report that a combination of high CEA and CA19-9 levels was significantly associated with prediabetes, in spite of no significant association between prediabetes and high CEA alone or high CA19-9 alone. In previous studies, CEA was positively correlated with HbA1c only in patients with diabetes but not in subjects with prediabetes or normal glucose regulation.Citation39 Patients with new-onset diabetes had a higher risk of elevated CA19-9 levels than those with normal glucose after adjustments for confounders.Citation30 Because of the synergistic association of CEA and CA19-9 on the risk of type 2 diabetes or prediabetes, both tumor markers might play a pathophysiologic role in type 2 diabetes or prediabetes.
The mechanisms of CEA and CA19-9 in abnormal glucose regulation are still unclear. Hyperglycemia provides a potential condition for neoplastic proliferation. In vitro studies showed that a hyperglycemic environment stimulated the proliferation of breast and pancreatic cancer cells.Citation44,Citation45 In a mouse model, diabetes was associated with the development of skin and mammary tumors after tumor induction.Citation46 In a prospective study in the Vasterbotten Intervention Project in Sweden and in the Hong Kong diabetes registry study, hyperglycemia was reported to increase cancer risk.Citation47,Citation48 Poor glucose control has also been reported to be associated with a higher risk of all-cause mortality and recurrent cancer events in breast cancer survivors.Citation49
CEA induces the expression of inflammatory markers by activating monocytes and hepatic macrophages,Citation50 and subsequent inflammation might result in insulin resistance and the development of diabetes.Citation51–Citation54 CEA‐related cell adhesion molecules play a role in neutrophil activation.Citation55 Chung et alCitation39 found that WBC and inflammatory markers showed positive correlations with both fasting glucose and HbA1c, and WBC was independently correlated with CEA in subjects with diabetes. Furthermore, insulin resistance with hyperinsulinemia might promote tumor cell proliferation via insulin‐like growth factor receptors.Citation56,Citation57
CA19-9 expressed by the exocrine pancreas is a marker of pancreatic tissue damage, which might be accompanied by impaired beta-cell function. Therefore, CA19-9 might reflect a decline in pancreatic function, including exocrine and endocrine functions. In addition, insulin insufficiency could result in pancreatic exocrine deficiency and release of CA19-9 by ductal cells.Citation58 Yu et alCitation27 demonstrated that increased serum CA19-9 levels were inversely correlated with pancreatic beta-cell function in patients with diabetes and claimed that long-term poor glycemic control may lead to beta-cell dysfunction, which is reflected by elevated serum CA19-9 levels. Therefore, an increase in serum CA19-9 levels might reflect the intensity of cellular dysfunction after metabolic disturbances. For patients with type 2 diabetes, the glucotoxicity generated by hyperglycemia is commonly thought to be the fundamental acquired factor that causes a continuous decline in beta-cell function in type 2 diabetes.Citation59,Citation60
In addition to impaired beta-cell function, insulin resistance is a fundamental characteristic of type 2 diabetes. Esteghamati et alCitation31 reported significant associations of CA19-9 with HbA1c and insulin resistance, and these associations were persistent in subjects with diabetes but not in those without diabetes. Tu et alCitation32 found that insulin resistance is an important contributing factor in the changes in serum levels of CA19-9 after rapid metabolic control by Roux-en-Y gastric bypass. Since glucose toxicity is associated with insulin resistance and changes in the serum levels of CA19-9,Citation61 the association between elevated CA19-9 and hyperglycemia might be involved in the mechanisms of both beta-cell dysfunction and insulin resistance.
Age, BMI, and blood pressure were shown to be independent risk factors for type 2 diabetes or prediabetes in the present study. These findings were in line with previous studies. Age is a major risk factor for type 2 diabetes, and the percentage of adults with diabetes increases with age.Citation3 The risk of impaired glucose tolerance (IGT) or type 2 diabetes rises with increasing BMI.Citation62–Citation64 In addition, in a cohort investigation, hypertension were associated with an increased risk of developing type 2 diabetes.Citation65 Subjects with higher HDL cholesterol had a lower risk of prediabetes in the present study. Lower HDL levels are a characteristic of dyslipidemia in patients with type 2 diabetes. In the UK Prospective Diabetes Study (UKPDS), HDL cholesterol levels were reduced compared with those of the nondiabetic controls.Citation66
It is notable that calcium level was also an independent risk factor for type 2 diabetes or prediabetes in the present study. In a previous study, elevated serum calcium was found to be associated with a greater risk of type 2 diabetes.Citation67 This association remained significant even after adjustment for 25-hydroxyvitamin D, parathyroid hormone, and phosphate, which have themselves been associated with diabetes.Citation68–Citation70 However, eGFR was not an independent risk factor for prediabetes in this study. This nonsignificant result might be caused by excluding patients with CKD since they have higher CEA levels.Citation12
This study had some limitations. First, we did not assess the causal effect of CEA and CA19-9 on abnormal glucose regulation in this cross-sectional study. Second, we did not assess the pathophysiological mechanism underlying the association between these tumor markers and diabetes. Third, our findings cannot be applied to patients with malignancy or disorders of the pancreas and colon because they were excluded from the present study. Finally, there was no information on IGT since the oral glucose tolerance test was not included in the health examination program.
Conclusion
The present study found a synergistic association of CEA and CA19-9 on the risk of type 2 diabetes and prediabetes. This finding might provide a possible mechanism of CEA and CA19-9 in patients with type 2 diabetes and prediabetes. Further investigations to prospectively examine the causal effects of these tumor markers on diabetes and prediabetes are needed.
Author Contributions
All authors made substantial contributions to conception and design, acquisition of data, or analysis and interpretation of data; took part in drafting the article or revising it critically for important intellectual content; gave final approval of the version to be published; and agree to be accountable for all aspects of the work.
Acknowledgments
We thank the Health Management Center database of Taichung Veterans General Hospital.
Disclosure
The authors report no conflicts of interest in this work.
Additional information
Funding
References
- GBD. 2013 Mortality and Causes of Death Collaborators. Global, regional, and national age-sex specific all-cause and cause-specific mortality for 240 causes of death, 1990–2013: a systematic analysis for the Global Burden of Disease Study 2013. Lancet. 2015;385(9963):117–171. doi:10.1016/S0140-6736(14)61682-2
- Cho NH, Shaw JE, Karuranga S, et al. IDF diabetes atlas: global estimates of diabetes prevalence for 2017 and projections for 2045. Diabetes Res Clin Pract. 2018;138:271–281. doi:10.1016/j.diabres.2018.02.023
- Sheen YJ, Hsu CC, Jiang YD, Huang CN, Liu JS, Sheu WH. Trends in prevalence and incidence of diabetes mellitus from 2005 to 2014 in Taiwan. J Formos Med Assoc. 2019;118(Suppl 2):S66–S73. doi:10.1016/j.jfma.2019.06.016
- Porta M, Curletto G, Cipullo D, et al. Estimating the delay between onset and diagnosis of type 2 diabetes from the time course of retinopathy prevalence. Diabetes Care. 2014;37(6):1668–1674. doi:10.2337/dc13-2101
- Beagley J, Guariguata L, Weil C, Motala AA. Global estimates of undiagnosed diabetes in adults. Diabetes Res Clin Pract. 2014;103(2):150–160. doi:10.1016/j.diabres.2013.11.001
- American Diabetes Association. 2. Classification and diagnosis of diabetes: standards of medical care in diabetes-2019. Diabetes Care. 2019;42(Suppl 1):S13–S28. doi:10.2337/dc19-S002
- Cosentino F, Grant PJ, Aboyans V, et al. 2019 ESC Guidelines on diabetes, pre-diabetes, and cardiovascular diseases developed in collaboration with the EASD. Eur Heart J. 2020;41(2):255–323.
- Locker GY, Hamilton S, Harris J, et al. ASCO 2006 update of recommendations for the use of tumor markers in gastrointestinal cancer. J Clin Oncol. 2006;24(33):5313–5327. doi:10.1200/JCO.2006.08.2644
- Touitou Y, Proust J, Klinger E, Nakache JP, Huard D, Sachet A. Cumulative effects of age and pathology on plasma carcinoembryonic antigen in an unselected elderly population. Eur J Cancer Clin Oncol. 1984;20(3):369–374. doi:10.1016/0277-5379(84)90083-X
- Amino N, Kuro R, Yabu Y, et al. Elevated levels of circulating carcinoembryonic antigen in hypothyroidism. J Clin Endocrinol Metab. 1981;52(3):457–462. doi:10.1210/jcem-52-3-457
- Ruibal Morell A. CEA serum levels in non-neoplastic disease. Int J Biol Markers. 1992;7(3):160–166. doi:10.1177/172460089200700307
- Tong HL, Dong ZN, Wen XY, Gao J, Wang B, Tian YP. Impact of chronic kidney disease on serum tumor markers concentrations. Chin Med J. 2013;126(2):274–279.
- Pines E, Slama JL, Holeman A, Ley G, Malbec D, Boudon P. Taux inhabituellement élevé du CA 19-9 au cours d’une pancréatite chronique [Unusually high level of CA 19-9 in chronic pancreatitis]. Gastroenterol Clin Biol. 1995;19(6–7):641–642.
- Mukae H, Hirota M, Kohno S, et al. Elevation of tumor-associated carbohydrate antigens in patients with diffuse panbronchiolitis. Am Rev Respir Dis. 1993;148(3):744–751. doi:10.1164/ajrccm/148.3.744
- Fukuda I, Yamakado M, Kiyose H. Influence of smoking on serum carcinoembryonic antigen levels in subjects who underwent multiphasic health testing and services. J Med Syst. 1998;22(2):89–93. doi:10.1023/A:1022643102208
- Bilge Ü, AN YG, Gölge N, Kara B. Relationship of CA 19-9 with choledocholithiasis and cholangitis. Turk J Gastroenterol. 2011;22(2):171–177. doi:10.4318/tjg.2011.0186
- Shively JE, Beatty JD. CEA-related antigens: molecular biology and clinical significance. Crit Rev Oncol Hematol. 1985;2(4):355–399. doi:10.1016/S1040-8428(85)80008-1
- Kannagi R. Carbohydrate antigen sialyl Lewis a–its pathophysiological significance and induction mechanism in cancer progression. Chang Gung Med J. 2007;30(3):189–209.
- Benchimol S, Fuks A, Jothy S, Beauchemin N, Shirota K, Stanners CP. Carcinoembryonic antigen, a human tumor marker, functions as an intercellular adhesion molecule. Cell. 1989;57(2):327–334. doi:10.1016/0092-8674(89)90970-7
- Berg EL, Robinson MK, Mansson O, Butcher EC, Magnani JL. A carbohydrate domain common to both sialyl Le(a) and sialyl Le(X) is recognized by the endothelial cell leukocyte adhesion molecule ELAM-1. J Biol Chem. 1991;266(23):14869–14872.
- Bagaria B, Sood S, Sharma R, Lalwani S. Comparative study of CEA and CA19-9 in esophageal, gastric and colon cancers individually and in combination (ROC curve analysis). Cancer Biol Med. 2013;10(3):148–157. doi:10.7497/j.issn.2095-3941.2013.03.005
- Shibutani M, Maeda K, Nagahara H, et al. Significance of CEA and CA19-9 combination as a prognostic indicator and for recurrence monitoring in patients with stage II colorectal cancer. Anticancer Res. 2014;34(7):3753–3758.
- Shimojo N, Naka K, Nakajima C, et al. The effect of non-insulin-dependent diabetes on serum concentrations of tumor-associated carbohydrate antigens of CA19-9, CA-50, and sialyl SSEA-1 in association with the Lewis blood phenotype. Clin Chim Acta. 1990;190(3):283–289. doi:10.1016/0009-8981(90)90182-R
- Petit JM, Vaillant G, Olsson NO, et al. Elevated serum CA19-9 levels in poorly controlled diabetic patients. Relationship with Lewis blood group. Gastroenterol Clin Biol. 1994;18(1):17–20.
- Uygur-Bayramicli O, Dabak R, Orbay E, et al. Type 2 diabetes mellitus and CA 19-9 levels. World J Gastroenterol. 2007;13(40):5357–5359. doi:10.3748/wjg.v13.i40.5357
- Nakamura N, Aoji O, Yoshikawa T, et al. Elevated serum CA19-9 levels in poorly controlled diabetic patients. Jpn J Med. 1986;25(3):278–280. doi:10.2169/internalmedicine1962.25.278
- Yu H, Li R, Zhang L, Chen H, Bao Y, Jia W. Serum CA19-9 level associated with metabolic control and pancreatic beta cell function in diabetic patients. Exp Diabetes Res. 2012;2012:745189. doi:10.1155/2012/745189
- Murai J, Soga S, Saito H, et al. Study on the mechanism causing elevation of serum CA19-9 levels in diabetic patients. Endocr J. 2013;60(7):885–891. doi:10.1507/endocrj.EJ12-0364
- Gul K, Nas S, Ozdemir D, Gumus M, Ersoy R, Cakir B. CA 19-9 level in patients with type 2 diabetes mellitus and its relation to the metabolic control and microvascular complications. Am J Med Sci. 2011;341(1):28–32. doi:10.1097/MAJ.0b013e3181f0e2a0
- Huang Y, Xu Y, Bi Y, et al. Relationship between CA 19-9 levels and glucose regulation in a middle-aged and elderly Chinese population. J Diabetes. 2012;4(2):147–152. doi:10.1111/j.1753-0407.2011.00179.x
- Esteghamati A, Hafezi-Nejad N, Zandieh A, Sheikhbahaei S, Emamzadeh-Fard S, Nakhjavani M. CA 19-9 is associated with poor glycemic control in diabetic patients: role of insulin resistance. Clin Lab. 2014;60(3):441–447. doi:10.7754/Clin.Lab.2013.121243
- Tu Y, Yu H, Zhang P, et al. Decreased serum CA19-9 is associated with improvement of insulin resistance and metabolic control in patients with obesity and type 2 diabetes after Roux-en-Y gastric bypass. J Diabetes Investig. 2014;5(6):694–700. doi:10.1111/jdi.12200
- Benhamou PY, Vuillez JP, Halimi S, Meffre G, Bachelot I. Influence of metabolic disturbances of diabetes mellitus on serum CA 19-9 tumor marker. Diabete Metab. 1991;17(1):39–43.
- Hasan M, Mohieldein A. Association between serum carcinoembryonic antigen level and oxidative stress parameters among diabetic females. Int J Clin Exp Med. 2015;8(4):6489–6494.
- Ata N, Dal K, Kucukazman M, et al. The effect of glycemic control on CEA, CA 19-9, amylase and lipase levels. Open Med. 2014;10(1):8–13. doi:10.1515/med-2015-0002
- Zayed AA, Beano AM, Amer FN, et al. Serum levels of carcinoembryonic antigen in patients with type 2 diabetes. Endocr Pract. 2016;22(11):1310–1318. doi:10.4158/EP161221.OR
- Shang X, Song C, Du X, Shao H, Xu D, Wang X. The serum levels of tumor marker CA19-9, CEA, CA72-4, and NSE in type 2 diabetes without malignancy and the relations to the metabolic control. Saudi Med J. 2017;38(2):204–208. doi:10.15537/smj.2017.2.15649
- Lu J, Wang H, Zhang X, Yu X. HbA1c is positively associated with serum carcinoembryonic antigen (CEA) in patients with diabetes: a cross-sectional study. Diabetes Ther. 2018;9(1):209–217. doi:10.1007/s13300-017-0356-2
- Chung S, Lee Y, Roh EY. HbA1c showed a positive association with carcinoembryonic antigen (CEA) level in only diabetes, not prediabetic or normal individuals. J Clin Lab Anal. 2019;33(6):e22900. doi:10.1002/jcla.22900
- Esteghamati A, Zandieh A, Saadipoor A, et al. The role of metabolic syndrome and related clinical variables in determining CEA levels. Adv Clin Exp Med. 2014;23(6):907–912. doi:10.17219/acem/37334
- Guo Q, Kang M, Zhang B, Chen Y, Dong X, Wu Y. Elevated levels of CA 19-9 and CEA in pancreatic cancer-associated diabetes. J Cancer Res Clin Oncol. 2010;136(11):1627–1631. doi:10.1007/s00432-010-0820-0
- National Kidney Foundation. K/DOQI clinical practice guidelines for chronic kidney disease: evaluation, classification, and stratification. Am J Kidney Dis. 2002;39(2 Suppl 1):S1–S266.
- Grundy SM, Cleeman JI, Daniels SR, et al. Diagnosis and management of the metabolic syndrome: an American Heart Association/National Heart, Lung, and Blood Institute scientific statement. Circulation. 2005;112(17):2735–2752. doi:10.1161/CIRCULATIONAHA.105.169404
- Okumura M, Yamamoto M, Sakuma H, et al. Leptin and high glucose stimulate cell proliferation in MCF-7 human breast cancer cells: reciprocal involvement of PKC-α and PPAR expression. Biochim Biophys Acta. 2002;1592(2):107–116. doi:10.1016/S0167-4889(02)00276-8
- Liu H, Ma Q, Li J. High glucose promotes cell proliferation and enhances GDNF and RET expression in pancreatic cancer cells. Mol Cell Biochem. 2011;347(1–2):95–101. doi:10.1007/s11010-010-0617-0
- Nunez NP, Oh WJ, Rozenberg J, et al. Accelerated tumor formation in a fatless mouse with type 2 diabetes and inflammation. Cancer Res. 2006;66(10):5469–5476. doi:10.1158/0008-5472.CAN-05-4102
- Stattin P, Björ O, Ferrari P, et al. Prospective study of hyperglycemia and cancer risk. Diabetes Care. 2007;30(3):561–567. doi:10.2337/dc06-0922
- Yang X, Ko GT, So WY, et al. Associations of hyperglycemia and insulin usage with the risk of cancer in type 2 diabetes: the Hong Kong diabetes registry. Diabetes. 2010;59(5):1254–1260. doi:10.2337/db09-1371
- Goto A, Noto H, Noda M, et al. Report of the Japan Diabetes Society (JDS)/Japanese Cancer Association (JCA) joint committee on diabetes and cancer, second report. Diabetol Int. 2016;7(1):12–15. doi:10.1007/s13340-016-0257-z
- Bessa X, Elizalde JI, Mitjans F, et al. Leukocyte recruitment in colon cancer: role of cell adhesion molecules, nitric oxide, and transforming growth factor β1. Gastroenterology. 2002;122(4):1122–1132. doi:10.1053/gast.2002.32369
- Pham MN, Hawa MI, Roden M, et al. Increased serum concentrations of adhesion molecules but not of chemokines in patients with Type 2 diabetes compared with patients with Type 1 diabetes and latent autoimmune diabetes in adult age: action LADA 5. Diabet Med. 2012;29(4):470–478. doi:10.1111/j.1464-5491.2011.03546.x
- Pham MN, Hawa MI, Pfleger C, et al. Pro-and anti-inflammatory cytokines in latent autoimmune diabetes in adults, type 1 and type 2 diabetes patients: action LADA 4. Diabetologia. 2011;54(7):1630–1638. doi:10.1007/s00125-011-2088-6
- Xiang Y, Zhou P, Li X, et al. Heterogeneity of altered cytokine levels across the clinical spectrum of diabetes in China. Diabetes Care. 2011;34(7):1639–1641. doi:10.2337/dc11-0039
- Salman ZK, Refaat R, Selima E, El Sarha A, Ismail MA. The combined effect of metformin and L-cysteine on inflammation, oxidative stress and insulin resistance in streptozotocin-induced type 2 diabetes in rats. Eur J Pharmacol. 2013;714(1–3):448–455. doi:10.1016/j.ejphar.2013.07.002
- Stern N, Markel G, Arnon TI, et al. Carcinoembryonic antigen (CEA) inhibits NK killing via interaction with CEA-related cell adhesion molecule 1. J Immunol. 2005;174(11):6692–6701. doi:10.4049/jimmunol.174.11.6692
- Pollak M. Insulin and insulin-like growth factor signalling in neoplasia. Nat Rev Cancer. 2008;8(12):915–928. doi:10.1038/nrc2536
- Giovannucci E, Harlan DM, Archer MC, et al. Diabetes and cancer: a consensus report. Diabetes Care. 2010;33(7):1674–1685. doi:10.2337/dc10-0666
- Williams JA, Goldfine ID. The insulin-pancreatic acinar axis. Diabetes. 1985;34(10):980–986.
- Wajchenberg BL. β-cell failure in diabetes and preservation by clinical treatment. Endocr Rev. 2007;28(2):187–218. doi:10.1210/10.1210/er.2006-0038
- Prentki M. Islet beta cell failure in type 2 diabetes. J Clin Invest. 2006;116(7):1802–1812. doi:10.1172/JCI29103
- Evans JL, Goldfine ID, Maddux BA, Grodsky GM. Are oxidative stress-activated signaling pathways mediators of insulin resistance and beta-cell dysfunction? Diabetes. 2003;52(1):1–8. doi:10.2337/diabetes.52.1.1
- Mokdad AH, Ford ES, Bowman BA, et al. Prevalence of obesity, diabetes, and obesity-related health risk factors, 2001. JAMA. 2003;289(1):76–79. doi:10.1001/jama.289.1.76
- Helmrich SP, Ragland DR, Leung RW, Paffenbarger RS. Physical activity and reduced occurrence of non-insulin-dependent diabetes mellitus. N Engl J Med. 1991;325(3):147–152. doi:10.1056/NEJM199107183250302
- Nguyen NT, Nguyen XM, Lane J, Wang P. Relationship between obesity and diabetes in a US adult population: findings from the National Health and Nutrition Examination Survey, 1999-2006. Obes Surg. 2011;21(3):351–355. doi:10.1007/s11695-010-0335-4
- Hayashi T, Tsumura K, Suematsu C, Endo G, Fujii S, Okada K. High normal blood pressure, hypertension, and the risk of type 2 diabetes in Japanese men. The Osaka Health Survey. Diabetes Care. 1999;22(10):1683–1687. doi:10.2337/diacare.22.10.1683
- U.K. Prospective Diabetes Study 27. Plasma lipids and lipoproteins at diagnosis of NIDDM by age and sex. Diabetes Care. 1997;20(11):1683–1687. doi:10.2337/diacare.20.11.1683
- Rooney MR, Pankow JS, Sibley SD, et al. Serum calcium and incident type 2 diabetes: the Atherosclerosis Risk in Communities (ARIC) study. Am J Clin Nutr. 2016;104:1023–1029. doi:10.3945/ajcn.115.130021
- Xuan Y, Zhao HY, Liu JM. Vitamin D and type 2 diabetes mellitus (D2). J Diabetes. 2013;5(3):261–267. doi:10.1111/1753-0407.12024
- Mitri J, Pittas AG. Vitamin D and diabetes. Endocrinol Metab Clin North Am. 2014;43(1):205–232. doi:10.1016/j.ecl.2013.09.010
- Reis JP, Michos ED, Selvin E, Pankow JS, Lutsey PL. Race, vitamin D-binding protein gene polymorphisms, 25-hydroxyvitamin D, and incident diabetes: the Atherosclerosis Risk in Communities (ARIC) study. Am J Clin Nutr. 2015;101(6):1232–1240. doi:10.3945/ajcn.115.107334