
Abstract
Purpose
Sodium-glucose co-transporter-2 (SGLT2) inhibitors have various pleiotropic effects, including body weight reduction, and therefore have the potential to be used in various applications. However, such effects have not been fully investigated; thus, non-clinical studies using animal models are needed. In animal experiments, SGLT2 inhibitors are usually administered by oral or dietary methods. However, the detailed characteristics of these dosing methods, especially to induce their pleiotropic effects, have not been reported. Therefore, we compared the preventive effects of canagliflozin, an SGLT2 inhibitor, on body weight gain following oral gavage and dietary administration methods in a mouse model of diet-induced obesity.
Methods
Canagliflozin was dosed by oral gavage or dietary administration for 9 weeks to 6-week-old C57BL/6N mice fed a high-fat diet, and parameters related to obesity were evaluated.
Results
The suppression of body weight gain, fat mass, and hepatic lipid content was observed following both dosing methods, whereas the effect on body weight tended to be stronger in the dietary administration group. In adipose tissue, fatty acid synthase expression was significantly decreased in the dietary administration group, and its expression was significantly correlated with fat mass. However, the expression of genes related to fatty acid oxidation was unchanged, indicating that the preventive effect on body weight gain was mediated mainly through the suppression of lipid synthesis rather than the promotion of lipid oxidation.
Conclusion
Canagliflozin prevented body weight gain through the suppression of lipid synthesis via both dosing methods, although there were some differences in the efficacy. The findings of our study can help to identify new mechanisms of action of SGLT2 inhibitors and potential applications.
Keywords:
Introduction
The prevalence of type 2 diabetes mellitus (T2DM) and obesity is increasing globally. For patients with T2DM and obesity, the management of body weight is important. Sodium glucose co-transporter 2 (SGLT2) inhibitors reduce blood glucose levels through inhibition of renal glucose reabsorption in the proximal tubules, thereby increasing glucose excretion to the urine.Citation1 These inhibitors exhibit pleiotropic effects, such as body weight reduction, liver function improvement, and protection against cardiovascular and renal disease.Citation1–Citation3 Owing to these diverse effects, SGLT2 inhibitors have the potential to be used for various applications other than blood glucose management; however, the detailed mechanisms underlying these effects have not been fully examined. For a better understanding of the effects of SGLT2 inhibitors, non-clinical studies using animal models are indispensable. In previous studies, SGLT2 inhibitors have usually been administered to animals by oral gavage or through their diet.Citation4,Citation5 However, there are no reports comparing the efficacy of SGLT2 inhibitors administered by these methods. Understanding the difference in dosing methods and selection of the optimal method are crucial steps for performing effective non-clinical studies to enhance the understanding of drugs. Therefore, to obtain useful information on the administration method of SGLT2 inhibitors in non-clinical studies, the present study compared the preventive effect of canagliflozin on body weight gain between oral gavage and dietary administration, by focusing mainly on fatty acid metabolism.
Materials and Methods
Reagents
Canagliflozin was synthesized by Mitsubishi Tanabe Pharma Corporation.Citation6 All other reagents were purchased from Nacalai Tesque (Kyoto, Japan) unless stated otherwise.
Animals
Experimental procedures and the care of animals were performed in accordance with the requirements of the Animal Research Committee of Kyoto University (permission number: 27–87) and in compliance with “Guidelines for Proper Conduct of Animal Experiments” created by Science Council of Japan. C57BL/6N mice (Japan SLC, Inc., Shizuoka, Japan) were housed in a temperature-controlled room (25°C ± 1°C) under a 12 h light/dark cycle, and fed a 60 kcal% high-fat diet (HFD) (Research Diets, New Brunswick, NJ, USA), which is used widely in diet-induced obesity models.Citation7,Citation8
Canagliflozin Administration
Following a 7-day acclimation period, 6-week-old mice were divided into three groups: control (Cont), oral gavage (Gav), and dietary administration (Food) groups (n=5 per group). As the effect of canagliflozin on urinary glucose excretion is nearly maximal at an oral dose of 30 mg/kg,Citation9 this dose was selected for this study. In the Gav group, canagliflozin was suspended in 0.5% carboxymethyl cellulose (CMC) solution and orally administered once daily. In the other two groups, a solution of 0.5% CMC was orally administered. In the Food group, canagliflozin was mixed in with the 60 kcal% high-fat diet powder. Diets containing canagliflozin were prepared once weekly, based on the average body weight and food intake from the previous week, and adjusted to a dose of 30 mg/kg/day of canagliflozin. The other two groups were fed HFD powder without canagliflozin. All food was available ad libitum; fresh food were administered every other day and the amount of food intake was measured.
Body Composition
After 8 weeks of canagliflozin administration, body composition was measured using a body composition analyzer, the EchoMRI 3-in-1 system (Hitachi, Tokyo, Japan).Citation10
Tissue Isolation
After 9 weeks of canagliflozin treatment, the mice were anesthetized with isoflurane (Wako, Osaka, Japan); subsequently, blood and tissue samples were collected and plasma characteristics were measured as described previously.Citation11 Adipose tissue and liver samples were used for histological and mRNA analyses.
Histological Analysis
The tissues were fixed in 4% paraformaldehyde. The fixed adipose tissues were embedded in paraffin and the fixed liver tissues were embedded in OCT compound (Sakura Finetek Japan, Tokyo, Japan). The tissue blocks were sliced into 5-μm-thick sections. The adipose tissue and liver sections were stained with hematoxylin/eosin and Oil Red O/hematoxylin, respectively.Citation10
mRNA Analysis
Total RNA extraction, reverse transcription and quantitative polymerase chain reaction were performed as described previously.Citation12 All oligonucleotide primer sets used were designed as previously reported.Citation10,Citation13 All mRNA expression data were normalized to the expression of 36b4.
Statistical Analysis
Statistical analysis was performed using one-way analysis of variance followed by the Fisher’s least significant difference test. A p value of <0.05 was considered statistically significant.
Results
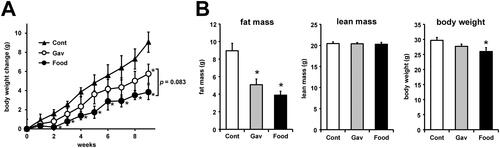
Compared with the control group, the canagliflozin-treated groups (Gav, Food) showed smaller body weight gains despite greater food intake (, ). There was no difference in food intake between the Gav and Food groups (). In the Gav group, body weight gain was reduced significantly compared with the Cont group at week 9 (). However, the Food group showed a significantly smaller body weight gain than the Cont group, starting from the second week of treatment (). After 9 weeks of treatment, the Food group tended to have a smaller body weight gain than the Gav group (). Body composition analysis at week 8 revealed significant reductions in fat mass in both the Gav and Food groups, with no differences in lean mass, compared with the Cont group (, ). The Food group had a lower mean fat mass than the Gav group; however, only the Food group showed significantly smaller body weight than the Control group in week 8 of treatment ().
Table 1 Physiological Characteristics of Canagliflozin-Treated Mice
Figure 1 Changes in the body weight and biological characteristics of canagliflozin-treated mice. (A) Weekly changes in the body weight of mice in each group. (B) Fat mass, lean mass, and body weight of mice in each group detected using MRI analysis performed on week 8 of treatment. The data are expressed as the mean ± SEM. *p<0.05 vs control. N=5 for each group.
Analysis of the plasma characteristics revealed that levels of ketone body were increased significantly in both canagliflozin-treated groups compared with the Cont group following 9 weeks of treatment (). Of the tissue masses measured, adipose tissue mass was significantly lowered by canagliflozin treatment (). In brown adipose tissue (BAT), the adipocytes were smaller in both the canagliflozin-treated groups than in the Cont group, and the Food group had the smallest size among the groups (). Ucp1 mRNA expression in BAT was significantly lower in the Food group and tended to be lower in the Gav group than in the Cont group ().
Figure 2 Analysis of BAT, WAT, and liver tissue isolated from mice treated with or without canagliflozin. (A) Hematoxylin and eosin (H&E) staining of BAT isolated from mice in each group. Scale bar = 200 μm. (B) The relative mRNA expression of Ucp1 in BAT of mice in each group. (C) H&E staining of WAT isolated from mice in each group. Scale bar = 200 μm. (D) Relative mRNA expression of Fasn, Adipoq, and Ccl2 in WAT isolated from mice in each group. (E) Oil Red O staining and triglyceride (TG) content of liver tissue isolated from mice in each group. Scale bar = 200 μm. (F) Relative mRNA expression of Fasn and Cpt1a in the liver tissues from mice in each group. (G) Correlation between inguinal WAT (iWAT) mass and WAT Fasn expression (left) and liver triglyceride levels and liver Fasn expression (right). (H) Correlation between the total fat mass detected using MRI analysis and WAT Fasn expression. For (G) and (H), the correlation coefficients were calculated based on Pearson’s correlation. The data are expressed as the mean ± SEM. *p<0.05 vs control. N=4–5 for each group.
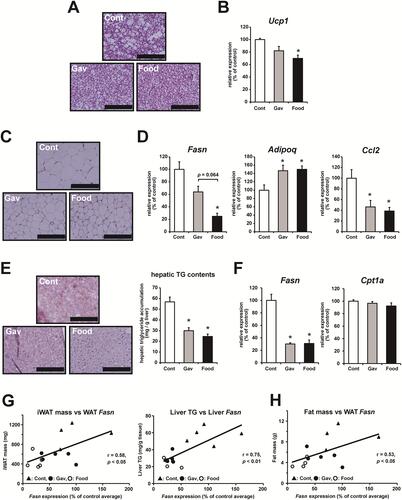
Adipocyte size in the white adipose tissue (WAT) also appeared to decrease more in the canagliflozin-treated groups than in the Cont group (). In WAT, canagliflozin reduced the expression of fatty acid synthase (Fasn) (). Fasn expression was significantly lower in the Food group than in the Cont group and tended to be lower than that in the Gav group (). In WAT, mRNA expression of adiponectin (Adipoq), an anti-inflammatory adipokine, was increased, and that of C-C motif chemokine 2 (Ccl2), an inflammatory adipokine, was decreased in both canagliflozin-treated groups compared with the Cont group (). There were no significant differences in the mRNA expression of these adipokines between the Gav and Food groups.
The histological analysis of liver sections showed that the Oil Red O-stained areas were reduced in canagliflozin-treated groups, and the measurement of triglyceride content showed significant reductions (). The Fasn mRNA expression in liver was significantly lower in the canagliflozin-treated groups than in the Cont group (). However, mRNA expression of carnitine palmitoyltransferase 1A (Cpt1a), an enzyme related to mitochondrial fatty acid β-oxidation was unchanged (). There were no differences in hepatic characteristics in the Gav and Food groups ( and ). There was a positive correlation between WAT mass and WAT Fasn expression and between liver triglyceride and liver Fasn expression (). The total fat mass, including lipids in the adipose tissue and the liver, was also positively correlated with WAT Fasn expression ().
Discussion
In this study, canagliflozin suppressed body weight gain and reduced the expression of a representative lipogenic gene,Citation14 Fasn, in the liver and WAT. The correlation analysis revealed a positive correlation between fat mass and Fasn expression. In contrast, the expression of fatty acid oxidation-related genes, such as Ucp1, the primary protein responsible for thermogenesis in BATCitation15 and Cpt1a in the liver was decreased or unchanged by canagliflozin, respectively. These results suggested that suppression of lipid synthesis, rather than promotion of fatty acid oxidation, was responsible for the reduction in body weight caused by canagliflozin in this study.
In a previous study, the dietary administration of SGLT2 inhibitors increased the expression of genes related to fatty acid oxidation.Citation4 The principal difference between the previous study and this study was the feeding conditions: pair-feeding in the previous study vs ad libitum feeding in this study. The SGLT2-inhibitor-mediated suppression of glucose reabsorption appeared to affect the whole-body energy metabolism, including feeding behavior.Citation16,Citation17 Indeed, an increase in food intake levels was observed in the canagliflozin-treated groups in this study. Feeding condition affects lipid metabolism,Citation18 and the difference in feeding condition may be the cause of the difference between the results of previous studies and this study. In addition, a clinical study showed that canagliflozin treatment increased the caloric intake of patients.Citation19 Thus, ad libitum feeding in mice may more accurately reflect the clinical condition.
In this study, Fasn expression in WAT tended to be lower in the Food group than in the Gav group. Fasn expression in WAT is reported to play a significant role in body weight regulation.Citation14 Thus, this difference in Fasn expression may be one of the causes of the difference in the preventive effect of canagliflozin on body weight gain between oral gavage and dietary administration. In addition, although WAT mass and Fasn expression in WAT were numerically lower in the Food group than in the Gav group, there were no differences in hepatic triglyceride content and hepatic Fasn expression. Several reports have indicated that there are different transcriptional regulatory systems of Fasn expression in the liver and WAT. It has been reported that metabolic stimuli, such as fasting and refeeding, affected Fasn expression in both the liver and WAT, and that these tissues showed different responsiveness to those stimuli.Citation18 Another study has suggested that there was a WAT-specific transcriptional factor that regulated Fasn expression in WAT.Citation20 In humans, a clinical study also showed that the effect of an SGLT2 inhibitor on the improvement of hepatic dysfunction was independent of body weight reduction.Citation3 A better understanding of the effects of SGLT2 inhibitors on Fasn expression in WAT and the liver may allow the discovery of a novel mechanism of the action of SGLT2 inhibitors. Collectively, the suppression of fatty acid synthesis in WAT may play an important role in the preventive effects of canagliflozin on body weight gain.
In this study, there were some differences in the effects of canagliflozin following oral gavage and dietary administration. Body weight gain and Fasn expression in WAT tended to be lower in the Food group than in the Gav group. Ucp1 mRNA expression in BAT was also numerically lower in the Food group than in the Gav group. Compared with the Gav group, in which canagliflozin was administered per day, in the Food group, it was continually administered in smaller amounts throughout the day. Some reports showed that SGLT2 inhibitors induced a fasting-like state.Citation21 During fasting, lipogenesis-related genes decreased and increased after refeeding,Citation22 and such phenomena may occur during SGLT2 inhibitor treatment. As the half-life of canagliflozin was relatively short (2–4 h) in mice,Citation23 continuous administration could maintain blood canagliflozin levels and the Food group could therefore have higher renal glucose excretion rates compared with untreated controls for a longer duration than the Gav group. The maintenance of higher blood canagliflozin levels will prolong the duration of the fasting-like state, which could lead to a stable reduction of Fasn expression in WAT. These continued effects of canagliflozin may also exert a somewhat stronger suppressive effect on body weight gain, as observed in the Food group. However, the specific mechanisms underlying such differences were still uncovered.
In the present study, we showed that the dosing method was an important factor for the determination of the efficacy of one of the pleiotropic effects of canagliflozin. To obtain more information about the dosing method of canagliflozin, it is necessary to evaluate the dose-response relationship and the effect of different administration periods in a larger sample size. In addition, we only assessed the preventive effect on body weight gain as a pleiotropic effect of canagliflozin in this study. To deepen the understanding of SGLT2 inhibitors, experiments focused on other pleiotropic effects of canagliflozin, such as hepatic functional improvement and renal and cardiovascular protection, will be needed. However, our results will provide a new basis for non-clinical studies focused on the pleiotropic effect of SGLT2 inhibitors.
Conclusion
In summary, dietary administration tended to result in a stronger preventive effect on body weight gain than administration by oral gavage, although both dosing methods resulted in a significant reduction in body weight gain. Our results suggested that lipid synthesis suppression in WAT, rather than lipid oxidation promotion, was responsible for canagliflozin-induced body weight gain suppression. Our study supports further non-clinical studies on SGLT2 inhibitors, which may reveal new mechanisms of action and support the potential use of SGLT2 inhibitors in various applications.
Acknowledgments
The authors thank S. Shinotoh and R. Takahashi for administrative support and M. Komori for technical support. This study was funded by Mitsubishi Tanabe Pharma Corporation.
Disclosure
T. Goto received grants from Japan Society for the Promotion of Science KAKENHI, outside the submitted work. H. Iijima is an employee of Mitsubishi Tanabe Pharma Corporation. All other authors have no conflicts of interest.
References
- Inagaki N, Harashima SI, Iijima H. Canagliflozin for the treatment of type 2 diabetes: a comparison between Japanese and non-Japanese patients. Expert Opin Pharmacother. 2018;19(8):895–908. doi:10.1080/14656566.2018.1473378
- Neal B, Perkovic V, Mahaffey K, et al. Canagliflozin and cardiovascular and renal events in type 2 diabetes. N Engl J Med. 2017;377(7):644–657. doi:10.1056/NEJMoa1611925
- Komiya C, Tsuchiya K, Shiba K, et al. Ipragliflozin improves hepatic steatosis in obese mice and liver dysfunction in type 2 diabetic patients irrespective of body weight reduction. PLoS One. 2016;11(3):e0151511. doi:10.1371/journal.pone.0151511
- Xu L, Nagata N, Nagashimada M, et al. SGLT2 inhibition by empagliflozin promotes fat utilization and browning and attenuates inflammation and insulin resistance by polarizing M2 macrophages in diet-induced obese mice. Ebiomedicine. 2017;20:137–149. doi:10.1016/j.ebiom.2017.05.028
- Chiba Y, Yamada T, Tsukita S, et al. Dapagliflozin, a sodium-glucose co-transporter 2 inhibitor, acutely reduces energy expenditure in BAT via neural signals in mice. PLoS One. 2016;11(3):ARTN e0150756. doi:10.1371/journal.pone.0150756
- Nomura S, Sakamaki S, Hongu M, et al. Discovery of canagliflozin, a novel C-glucoside with thiophene ring, as sodium-dependent glucose cotransporter 2 inhibitor for the treatment of type 2 diabetes mellitus. J Med Chem. 2010;53(17):6355–6360. doi:10.1021/jm100332n
- Aguayo-Mazzucato C, Andle J, Lee TB, et al. Acceleration of β cell aging determines diabetes and senolysis improves disease outcomes. Cell Metab. 2019;30(1):129–142.e4. doi:10.1016/j.cmet.2019.05.006
- Yoneshiro T, Wang Q, Tajima K, et al. BCAA catabolism in brown fat controls energy homeostasis through SLC25A44. Nature. 2019;572(7771):614–619. doi:10.1038/s41586-019-1503-x
- Kuriyama C, Xu JZ, Lee SP, et al. Analysis of the effect of canagliflozin on renal glucose reabsorption and progression of hyperglycemia in zucker diabetic Fatty rats. J Pharmacol Exp Ther. 2014;351(2):423–431. doi:10.1124/jpet.114.217992
- Yeh YS, Jheng HF, Iwase M, et al. The mevalonate pathway is indispensable for adipocyte survival. iScience. 2018;9:175–191. doi:10.1016/j.isci.2018.10.019
- Goto T, Hirata M, Aoki Y, et al. The hepatokine FGF21 is crucial for peroxisome proliferator-activated receptor-α agonist-induced amelioration of metabolic disorders in obese mice. J Biol Chem. 2017;292(22):9175–9190. doi:10.1074/jbc.M116.767590
- Kawarasaki S, Kuwata H, Sawazaki H, et al. A new mouse model for noninvasive fluorescence-based monitoring of mitochondrial UCP1 expression. FEBS Lett. 2019;593(11):1201–1212. doi:10.1002/1873-3468.13430
- Sakamoto T, Nitta T, Maruno K, et al. Macrophage infiltration into obese adipose tissues suppresses the induction of UCP1 level in mice. Am J Physiol Endocrinol Metab. 2016;310(8):E676–E687. doi:10.1152/ajpendo.00028.2015
- Lodhi IJ, Yin L, Jensen-Urstad AP, et al. Inhibiting adipose tissue lipogenesis reprograms thermogenesis and PPARγ activation to decrease diet-induced obesity. Cell Metab. 2012;16(2):189–201. doi:10.1016/j.cmet.2012.06.013
- Cannon B, Nedergaard J. Brown adipose tissue: function and physiological significance. Physiol Rev. 2004;84(1):277–359. doi:10.1152/physrev.00015.2003
- Vallon V, Gerasimova M, Rose MA, et al. SGLT2 inhibitor empagliflozin reduces renal growth and albuminuria in proportion to hyperglycemia and prevents glomerular hyperfiltration in diabetic Akita mice. Am J Physiol Renal Physiol. 2014;306(2):F194–F204. doi:10.1152/ajprenal.00520.2013
- Obata A, Kubota N, Kubota T, et al. Tofogliflozin improves insulin resistance in skeletal muscle and accelerates lipolysis in adipose tissue in male mice. Endocrinology. 2016;157(3):1029–1042. doi:10.1210/en.2015-1588
- Palou M, Priego T, Sánchez J, et al. Sequential changes in the expression of genes involved in lipid metabolism in adipose tissue and liver in response to fasting. Pflugers Arch. 2008;456(5):825–836. doi:10.1007/s00424-008-0461-1
- Matsuba I, Kanamori A, Takihata M, et al. Canagliflozin increases calorie intake in type 2 diabetes without changing the energy ratio of the three macronutrients: CANA-K Study. Diabetes Technol Ther. 2020;22(3):228–234. doi:10.1089/dia.2019.0372
- Nishi-Tatsumi M, Yahagi N, Takeuchi Y, et al. A key role of nuclear factor Y in the refeeding response of fatty acid synthase in adipocytes. FEBS Lett. 2017;591(7):965–978. doi:10.1002/1873-3468.12620
- Packer M. SGLT2 inhibitors produce cardiorenal benefits by promoting adaptive cellular reprogramming to induce a state of fasting mimicry: a paradigm shift in understanding their mechanism of action. Diabetes Care. 2020;43(3):508–511. doi:10.2337/dci19-0074
- Tang HN, Tang CY, Man XF, et al. Plasticity of adipose tissue in response to fasting and refeeding in male mice. Nutr Metab (Lond). 2017;14:3. doi:10.1186/s12986-016-0159-x
- Evaluation and Licensing Division, Pharmaceutical and Food Safety Bureau, Ministry of Health Labour and Welfare, Japan. Report on the deliberation results: CANAGLU 100mg (canagliflozin). [cited April 7, 2020]. http://www.pmda.go.jp/drugs/2014/P201400070/22600AMX00744000_A100_1.pdf.